The Use of Apps Based on Augmented Reality as a Tool for Teaching STEM Subjects in Compulsory Secondary Education
El uso de apps basadas en la realidad aumentada como herramienta para la enseñanza de asignaturas STEM de la Educación Secundaria Obligatoria
Enzo Ferraria(*), Pablo Herrero-Teijónb, Laura Delgado Martínc, Santiago Andrés Sánchezd, Anne-Marie Ballegeere, Diego Corrochano Fernándezf, Miguel Ángel Fuertesg, Patricia González Ocejoh, Camilo Ruiz Méndezi
a Department of Mathematics and Science Education. Universidad de Salamanca, Spain.
https://orcid.org/0000-0002-4533-021Xenzoferrari@usal.es
b Consejería de Educación. Junta de Castilla y León, Spain.
https://orcid.org/0000-0001-7478-1637pherrerot@educa.jcyl.es
c Department of Mathematics and Science Education. Universidad de Salamanca, Spain.
https://orcid.org/0000-0001-7203-1832laura@usal.es
d Department of Mathematics and Science Education. Universidad de Salamanca, Spain
https://orcid.org/0000-0002-8088-1607santiandres@usal.es
e Department of Mathematics and Science Education. Universidad de Salamanca, Spain
https://orcid.org/0000-0001-6296-1868amballegeer@usal.es
f Department of Mathematics and Science Education. Universidad de Salamanca, Spain
https://orcid.org/0000-0002-6085-9744dcf@usal.es
g Department of Mathematics and Science Education. Universidad de Salamanca, Spain
https://orcid.org/0000-0002-6914-6871fuertes@usal.es
h Consejería de Educación. Junta de Castilla y León, Spain
https://orcid.org/0009-0007-2029-5896patricia.gonoce@educa.jcyl.es
i Department of Mathematics and Science Education. Universidad de Salamanca, Spain
https://orcid.org/0000-0001-9538-5780camilo@usal.es
ABSTRACT
Augmented Reality (AR) as a resource in all areas of education is now a reality. Since the widespread use of smartphones, the number of AR applications has not stopped growing, and it has potential use in education. In this publication, we analyse the suitability of AR-based apps to teach STEM (Science, Technology, Engineering and Mathematics) concepts in compulsory secondary education in Spain. The study includes a quasi-experimental design, with an experimental group and a control group, to demonstrate the benefit of this technology in the classroom. In addition, a pretest-post-test design was applied, consisting of a pre-test and a post-test knowledge questionnaire. A five-question Likert-type questionnaire was used with the students to measure satisfaction with the activity and the appropriateness of the apps. Our study found high satisfaction in all four cases. In addition, the Wilcoxon W-test revealed that three of the four experimental groups using AR significantly improved their academic performance, with case three being the only non-significant (p=.051). This publication is part of the Educational Research Project, “Improving scientific competence through augmented reality (EDUCYL2020-02)”, funded by the Consejería de Educación de la Junta de Castilla y León through the Dirección General de Innovación y Formación del Profesorado.
Keywords
Augmented reality, STEM education, Compulsory Secondary Education in Spain.
RESUMEN
La incorporación de la Realidad Aumentada (RA) en la educación ha experimentado un auge significativo, especialmente tras la generalización del uso de los smartphones. Con una creciente gama de aplicaciones de RA, surge la interrogante sobre su aplicabilidad eficaz en la enseñanza de conceptos STEM (Ciencia, Tecnología, Ingeniería, Matemáticas) en la educación secundaria obligatoria en España. En este estudio, exploramos la pertinencia y eficacia de estas aplicaciones basadas en RA mediante un diseño cuasi-experimental en cuatro contextos educativos distintos. Cada contexto incluye un grupo experimental y uno de control para evaluar el impacto pedagógico de la RA. Utilizamos un diseño pre-test-post-test, basado en cuestionarios de conocimientos aplicados antes y después de la intervención educativa. Adicionalmente, con el propósito de valorar la satisfacción del estudiante y la adecuación de las aplicaciones, se administró un cuestionario Likert de cinco ítems. Los resultados indican un elevado nivel de satisfacción estudiantil en cada uno de los cuatro contextos evaluados. Además, el test W Wilcoxon reveló que tres de los cuatro grupos experimentales que utilizaron la RA mejoraron significativamente su rendimiento académico, siendo el caso tres el único de no ser significativo (p=.051). Esta publicación se enmarca en el Proyecto de Investigación Educativa, “Mejora de la competencia científica a través de la realidad aumentada (EDUCYL2020-02)”, financiado por la Consejería de Educación de la Junta de Castilla y León a través de la Dirección General de Innovación y Formación del Profesorado.
Palabras clave
Realidad Aumentada, educación STEM, Educación Secundaria Obligatoria (ESO en España.
1. Introduction
Today's schoolchildren are continually exposed to new technology at all levels and stages, and educational practices must reflect this fact. As the development of these technologies seems unstoppable, educators should accept and embrace them, understanding the challenges and opportunities they present (Cabero Almenara & Valencia, 2021). During the global COVID-19 crisis, digital technologies have shown to be particularly helpful in delivering high-quality education (Schleicher, 2020). Before incorporating new technology into education, however, great consideration must be given to how the teaching profession will change and how everyone will have access to these tools (Cabero Almenara, 2020).
During the global COVID-19 crisis, digital technologies have shown to be particularly helpful in delivering high-quality education (Schleicher, 2020). Before incorporating new technology into education, it is vital to carefully debate how the teaching profession will change and how everyone will have access to these tools (Cabero Almenara, 2020).
Augmented Reality (AR) is one of the new technologies that should be introduced in educational practices. It can provide a rich experience for students to explore and understand complex topics. The tools to use this technology are now widely available and can be used as educational tools in many learning scenarios (Martín-Gutiérrez et al. 2017).
These technologies are now widely available through smartphones. AR should not be confused with Virtual Reality (VR) as they refer to different technologies. In VR, the existing reality is completely dispensed, creating a completely new reality. The user controls the interaction with this new virtual reality with the help of a joystick, special glasses and custom hardware. In VR, the user is immersed in a new reality, usually completely different from the real world. However, AR information is added to the existing reality to enrich and interact with it more profoundly. At first, the AR was reserved for large companies, research centres and universities (Garzón et al., 2020). However, its use is becoming increasingly popular due to the broad penetration of smartphones and the development of 4G and 5G networks (Arici et al., 2019). The launch of the smartphone video game “Pokemon Go” was a before and after in the popularisation and development of AR-based applications. The ecosystem of AR has evolved in quantity and variety, and applications such as Instagram, Snapchat and other popular social networks have made this technology available to users and developers with great ease and in conjunction with mobile devices (Sinha & Srivastava, 2022).
Research institutions, universities, and companies have invested in AR research. These results demonstrate the feasibility and innovation of AR as a human-computer interaction technology (Chen et al., 2019).
The different types of AR have evolved over the years, but according to Blázquez (2017), there are essentially two types of AR depending on the elements that act as “triggers” of the information:
1. Marker-based AR: Markers are nowadays the most common way to act as information triggers in AR applications (when the device’s camera detects any of these markers, digital information is displayed). Bookmarks can be grouped into two groups:
a) Flat markers: They adopt flat geometric shapes that allow device software to recognise them. Currently, flat markers are used with a great diversity of shapes and colours. The idea is that the image of the marker is presented randomly and chaotically so that the software can recognise it and display the information (in this way, it is very difficult for the information to be activated by mistake because it is almost impossible to find a pattern so chaotic and messy that it was not previously predefined). Examples of this type of marker are the traditional barcodes and the now-famous QR codes.
b) Markerless NFT (Natural Feature Tracking): the information triggers are objects or images from the real world.
2. Geolocated AR: The new information is activated by elements of the device that indicate its position, such as geolocation (given by GPS, GLONASS, etc.), orientation, device angle, speed and acceleration (given by sensors such as compass, gyroscope or accelerometer). Thus, it is an AR-based on positioning parameters.
New software for the development of AR applications can now track the face of the user with high precision and use movement or gestures of the face of the user as triggers of information.
2. Augmented Reality and Education
The generalised use of AR in education is only a matter of time, as the technology and accessibility barriers guarantee easy access. Reinoso Ortiz (2012) has already mentioned the possibilities of AR as another tool of ICT in education. In the middle of this decade, the first reviews of AR experiences applied to compulsory education appeared (Cabero Almenara & Barroso Osuna, 2016; Prendes Espinosa, 2015). Despite being a great promise as a learning facilitator tool, its implementation in Spanish classrooms has been rather moderate. The 2016 Horizon report (Johnson et al., 2016, pp. 40-41) considers it an emerging technology that will have to be present in many classrooms by 2018-2019 (this prediction has not been fulfilled in the case of Spain, since most primary schools and high schools are not yet using it and it does not seem that specific plans are being developed for its implementation in the near term).
According to Dede and Dunleavy (2014), cited by Álvarez (2016), the fact that AR is considered a technology that enhances learning is based on two completely independent theoretical frameworks:
1. The famous constructivist theories of learning (those proposed by Bruner and Vygotsky) assert that people build their new knowledge based on what they already know and believe (although this aspect highly depends on different aspects, such as their social and cultural circumstances, the prevailing social context, their previous personal experiences and those proposed to them in the classroom). From these points of view, AR theoretically has enormous potential to improve students’ knowledge construction.
2. Situated Learning Theory states that meaningful learning occurs in a specific context, the quality of which depends directly on interactions among people, objects, places, processes and culture (Brown et al., 1989). The use of AR leads to a new way for the student to interact with curriculum content, with teachers and other students, and with processes, places or culture, which should positively impact learning.
There are several empirical studies (Buitrago-Pulido, 2015; Estapa & Nadolny, 2015; Giasiranis & Sofos, 2016) where improvement in the outcomes of students taught mathematics using AR technology has been demonstrated (it is no longer conjecture or theory).
Similar to video games in the first decade of this century (Squire, 2006), AR could be a great facilitator of the teaching-learning process as a supplement to students’ perception and interaction with the real world, contributing in novel and important ways to the teaching of the contents of the STEM (Science, Technology, Engineering and Mathematics) disciplines and the acquisition of basic competences (Chang et al., 2022).
Pedrinaci et al. (2012) globally define the scientific competence as “an integrated set of personal capacities to use scientific knowledge to:
• Describe, explain and predict natural phenomena.
• Understand the characteristic features of science.
• Formulate and investigate problems and hypotheses.
• Document, argue and make personal and social decisions about the natural world and the changes that human activity generates in it."
AR, understood as the additional information obtained through a camera device, can be used perfectly, either by itself or as a complement, to work on the four personal skills of students previously described by Pedrinaci et al. (2012). Indeed, teachers consider that AR increases students' scientific skills and motivation towards science, promotes collaboration and creates a classroom climate conducive to inquiry and project work (Villalustre et al., 2019).
One of the great advantages of AR is that you only need 3 elements to use it:
• A device with a camera (computer with a webcam, tablet, smartphone, virtual reality glasses...).
• A software program (QR code reader, BIDI...).
• A trigger (image, QR code, BIDI...).
Of the three previous elements, the second, using software programs, is the most problematic regarding educational use. Despite the myriad programs and applications, ensuring they do not collect sensitive data from the students who use them is necessary. For AR to truly be used in the classroom, it is important to ensure that the hardware is affordable and does not impose prohibitive costs on the centre and/or students, which can contribute to the well-known digital divide.
The greatest advantages of using AR in education are (Blázquez, 2017):
• Motivation: Using innovative technology in the classroom increases student motivation enormously.
• Collaborative work: AR, through its applications and the use of the necessary devices, represents a very appropriate resource for carrying out activities between students and promoting group work.
• Construction of knowledge by the student: if the student participates from the beginning, is guided in the management of AR applications and has the appropriate devices, does the student develop a higher capacity/competence? learning to learn is also improved since he is not a mere spectator or observer of the information but interacts with it.
• More information: through an image, a code, a word or a short text, rich information is accessed that broadens the possibility of delving into the subject studied.
• Free technology: to put this technology into practice, it is unnecessary to make large investments. Most applications are free or have a free "lite" version that allows you to handle basic functions and still do big jobs.
• Greater accessibility: most students and/or their families have a smartphone or tablet with which they can perform many tasks.
• Development of technological skills: students’ digital competence and their families are developed if they participate in some tasks.
Today, we should add other advantages to this list: Many of the AR activities can be designed to be done by students at home (Quicios García et al., 2020). If there were again a temporary suspension of face-to-face teaching, as has happened in the 2019-20 academic year, the use of this methodology could make the work at home more bearable for students, who may welcome the implementation of this type of activity as a complement to some of the more traditional activities offered in virtual classrooms. AR also helps students acquire basic competencies in science, technology and digital competence, as it improves critical thinking and students gain autonomy (Fernández-Enríquez & Delgado-Martín, 2020).
3. Research Questions
In this paper, we explore how the use of AR applications in contexts of secondary education in Spain can improve student learning in STEM topics and how AR can complement other educational resources.
The use of AR to explain the contents of STEM subjects in compulsory secondary education can improve certain aspects of the learning experience:
• Increased attention and motivation during content explanation.
• Arouse interest in STEM subjects
• An improvement in results and science and digital competencies.
The main objective of the present article is to evaluate the impact of teaching STEM subjects in secondary education using augmented reality applications (AR apps) such as StarWalk2®, Measure Google®, and GeoXplorer® to see how they influence learning and student satisfaction. This is the main novelty of the study. Our primary research questions are:
RQ1: How does using augmented reality applications (AR apps) impact student learning?
RQ2: What is the level of satisfaction with using augmented reality applications (AR apps) in students' learning?
4. Methodology
This research design corresponds to a quasi-experimental study (Gopalan et al., 2020; Stanley & Campbell, 1973). According to Hedrick et al., this kind of study has the same purpose as experimental studies: to prove the existence of a causal relationship between two or more variables. When randomization is impossible, quasi-experiments (similar to experiments) allow the treatment's or program's impacts to be estimated, depending on whether a reasonable basis for comparison has been established (1993, p. 58).
These designs are characterised by an experimental group and a control group, the difference being whether or not they use an AR application.
We consider three different AR applications in this study. In the following section, we describe how these applications work and how they were used with the study participants.
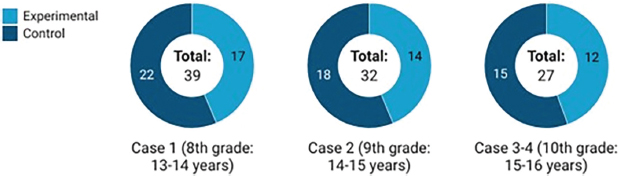
A non-probabilistic convenience sampling was used to obtain ninety-eight (n= 98) students from a secondary school in Spain aged between 13 and 16 years old. The study was conducted during the 2021–2022 academic year. Figure 1 details students in the sample for each case. In the four cases, the number of students in the control group is slightly higher than in the experimental group. Thus, in case 1 (8th grade/ 2ºESO), there are 17 students in the experimental group and 22 in the control group; in case 2 (9th grade/3ºESO), 14 in the experimental group and 18 in the control group, and finally in cases 3 and case 4 (10th grade/4ºESO) 12 in the experimental group and 15 in the control group.
Figure 1. The Participants by group.
Both groups (experimental and control) developed the same didactic units in STEM classes. The experimental group used the applications StarWalk2®, Measure Google®, and GeoXplorer® distributed in four cases. Table 1 summarises the main characteristics of each case. The control group used textbooks in a "traditional" way with expository approaches and a teacher-centred methodology.
Table 1. Main characteristics of each case.
Concept |
Case 1 |
Case 2 |
Case 3 |
Case 4 |
Course |
8th grade / 2ºESO |
9th grade / 3ºESO |
10th grade / 4ºESO |
10th grade / 4ºESO |
Subject |
Physics and Chemistry |
Physics and Chemistry |
Biology and Geology |
Physics and Chemistry |
Experimental Group |
Students using the “StarWalk2®” application |
Students using the “Measure Google®” application |
Students using the “GeoXplorer®” application |
Students using the “GeoXplorer®” application |
Control Group |
Students receiving a traditional masterclass |
Students receiving a traditional masterclass |
Students receiving a traditional masterclass |
Students receiving a traditional masterclass |
Our first case refers to 8th grade/2º. ESO students aged between 13 and 14 years. The subjects were physics and chemistry, and the topics covered were basic astronomy concepts. The AR APP was the StarWalk2 APP (https://starwalk.space/en).
This AR application was designed to enrich the experience of looking at the sky. The application uses the GPS, the gyroscope and accelerometers on the mobile device to determine the direction of the sky the camera is pointing. Once the image is displayed on the screen, information about the corresponding object is displayed. Since the application works in real-time, the camera can be pointed in different directions to explore the sky and the information is updated.
The intervention with students started with initial sessions where the teacher introduced the topics. In this case, focusing on astronomy, students start by visually discovering the concepts of constellations, the zodiac, rocky planets, gas planets, and natural and artificial satellites (Figure 2). Previous concepts, such as the northern or southern hemispheres, were also clarified in class, and the students were provided with arguments based on observation of the night sky to refute flat-Earth arguments. Students were given tablets with the application, and small groups of 4 or 5 were formed around the devices. It is important to note that the application can be used in daylight and inside the classroom, as shown in Figure 2.
Figure 2. The student is looking for a constellation on his tablet.

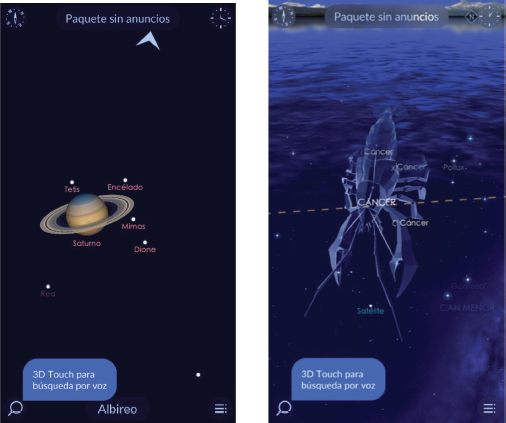
Students investigated the names of some constellations: Orion, Perseus, Heracles, Andromeda, etc. (Figure 3) by pointing the tablet in different directions. The concept of AR was usually very rapidly understood by the students and the interaction with the APP was very smooth.
Figure 3. Some screenshots of the activities carried out in the APP StarWalk2®.
The second case involves 9th grade/3ºESO students between 14 and 15 years in physics and chemistry. In this case, the topic was: Taking measurements with the Google Measurement APP. This tool allows you to measure objects using only the camera. The APP identifies the object's boundaries and, with a given reference, can provide the measurements of objects based on the number of pixels they occupy in the screen and the calibration formula.
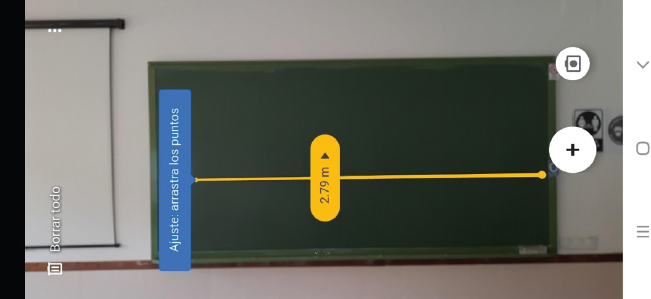
The physics and chemistry students (Figure 4) used this AR APP to measure different objects in the High School: blackboards, corridors, classrooms, etc. (Figure 5). In addition, they made several conversion factors, taking advantage of the fact that the application allows you to select SI units or English system units.
Figure 4. Students using the Google Measurement App.
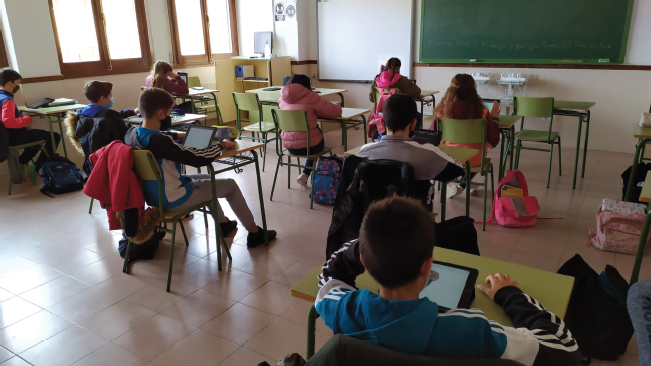
Figure 5. A screenshot of one of the activities carried out.
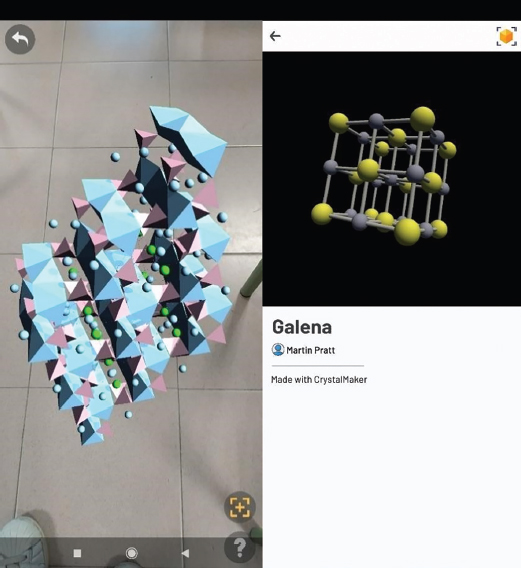
The third and fourth cases were with the 10th grade/4ºESO students aged between 15 and 16. In the third case, the subject was physics and chemistry, and the topic was 3D crystalline networks using the GeoXplorer APP. This AR APP allows visualisation of the crystalline structure of different materials. Showing the 3D arrangement of the atoms in the structures, the students can interact with it and observe them from different angles.
The visualisation of 3D structures is very important for the development of scientific competence since good training is necessary to assimilate the crystalline networks of ionic substances, minerals, etc. Using the GeoXplorer APP, students can move some of the most representative crystalline structures, such as cristobalite or galena, in any direction of space, in such a way that the comprehension of these structures is greatly enhanced when they have had the opportunity to rotate them, lengthen them, look into them, etc. (Figure 6).
Figure 6. Some of the 3D structures worked by the students.
In the fourth case, the subject was Biology and Geology, and the topic was studying minerals with the GeoXplorer APP. The group used this APP to analyse different mineral samples, which would not have been possible otherwise due to the measures against COVID-19. They have studied different groups of minerals and the complex structures of the most representative silicates (Figure 7).
Figure 7. A realistic picture of a mineral sample.

Two measurement instruments were used to determine the impact of the use of AR APP on educational facts. First, it was a knowledge questionnaire with multiple choice questions that all groups (control and experimental) filled out before (pre-test) and after (post-test) the instruction. The questionnaire has a grading scale from 1 to 10. Two science experts, one specialist in classroom teaching and one expert in STEM content assessment, together with the corresponding course teacher, were involved in the development of the questionnaire.
Second, the questionnaire was applied to the experimental group, which determined the level of satisfaction with the augmented reality activity and the suitability of the APP used. A Likert-type user experience questionnaire was used, in which the students of each group rated from 1 to 5 (“I strongly disagree (1)”, “I disagree (2)”, “I am undecided (3)”, “I agree (4)” and “I strongly agree (5)”) their degree of satisfaction with the following aspects: the methodology used; learning acquired during the activity; duration of the activity; ease of use of the application and degree of overall satisfaction. More details are shown in Table 2.
Table 2. Categories of satisfaction in the use of AR apps.
Categories |
Question |
Methodology used |
Did you like using the AR app in classroom? |
Learning acquired |
Has the AR app helped you to learn new things? |
Duration |
Did you find the number of classes in which we have used the AR app adequate? |
Ease of use |
Did you find the AR app easy to use? |
Overall satisfaction |
I highly value the fact of using an AR app in this subject. |
Statistical software JASP version 0.16.3 was used to conduct the hypothesis comparisons. Data analysis was structured and performed around two non-parametric tests:
• The Mann-Whitney U test compares the relationship between the performance variable in the pretest and the post-test, depending on the group.
• The Wilcoxon W test is used to determine whether performance differences exist before (pretest) and after (post-test) using the augmented reality app in the experimental group and after the master class in the control group.
Firstly, we tested if there was a difference in significance between the pretests of both groups (control and experimental), and then, we analysed the pretest and post-test performances of the experimental and control groups. In addition, we analysed where there were different significances in pre-test-post-test performance in both groups. The level of significance used in all contrasts is analysed under 5%. To interpret its value, we add its effect size (d). To quantify the magnitude of the difference between two medians, values between .10 and .29 are considered small differences, .30 to .49 as moderate differences and values greater than .50 as large (Cohen, 2013).
5. Results
First, we investigated how the use of AR apps affects student learning. For this purpose, we verified that both groups (control and experimental) did not present significant differences in the pretest. Then, we proceeded to analyse the results in the post-test. For this purpose, we used the nonparametric Mann-Whitney U test. Table 3 shows the pretest results of both control and experimental groups in each case. The results show no significant differences between the two groups in all cases in the pre-test.
Table 3. Contrast statistic pretest.
Case |
Group |
n |
M |
Med |
SD |
Hypothesis Testing |
||
Z |
MWU p |
RB |
||||||
1 |
Control |
22 |
6.63 |
6.50 |
1.80 |
-.128 |
.900 |
0.024 |
Experimental |
17 |
6.67 |
6.70 |
1.77 |
||||
2 |
Control |
18 |
6.56 |
6.60 |
2.10 |
-1.48 |
.138 |
0.310 |
Experimental |
14 |
7.74 |
8.20 |
2.09 |
||||
3 |
Control |
15 |
7.65 |
7.20 |
1.60 |
-1.17 |
.241 |
0.267 |
Experimental |
12 |
8.36 |
8.35 |
1.23 |
||||
4 |
Control |
15 |
7.70 |
7.40 |
1.72 |
-1.51 |
.130 |
0.344 |
Experimental |
12 |
8.60 |
8.40 |
1.06 |
||||
n: sample size; Med: median; M: mean; SD: standard deviation; Z: Standardized Test Statistic; MWU p: Mann–Whitney U t-test and RB: Rank-Biserial Correlation (Cohen’s effect size).
After verifying the contrast statistics in the pretest, we tested the impact of using AR apps with the nonparametric Wilcoxon test. The results are summarised in Table 4.
Table 4. Pre-test-post-test contrast statistical differences in the control and the experimental group.
Case |
Group |
Pretest |
Post-test |
Hypothesis Testing |
||||||
n |
Med |
M(SD) |
n |
Med |
M(SD) |
Z |
Wcx p |
RB |
||
1 |
Control |
22 |
6.63 |
6.50(1.80) |
22 |
6.91 |
6.90(1.62) |
-2.32 |
.025 |
0.563 |
Experimental |
17 |
6.67 |
6.70(1.77) |
17 |
7.66 |
7.90(1.76) |
-3.37 |
<.001 |
0.963 |
|
2 |
Control |
18 |
6.56 |
6.60(2.10) |
18 |
6.44 |
6.25(2.11) |
-1.02 |
.307 |
0.307 |
Experimental |
14 |
7.74 |
8.20(2.09) |
14 |
8.25 |
9.00(1.97) |
-2.38 |
.017 |
0.747 |
|
3 |
Control |
15 |
7.65 |
7.20(1.60) |
15 |
7.63 |
7.80(1.77) |
-0.28 |
.800 |
0.086 |
Experimental |
12 |
8.36 |
8.35(1.23) |
12 |
8.75 |
9.05(1.16) |
-1.94 |
.051 |
0.600 |
|
4 |
Control |
15 |
7.70 |
7.40(1.72) |
15 |
7.79 |
7.50(1.80) |
-1.26 |
.221 |
0.410 |
Experimental |
12 |
8.60 |
8.40(1.06) |
12 |
8.89 |
8.90(0.94) |
-2.54 |
.011 |
0.956 |
|
n: sample size; Med: median; M: mean; SD: standard deviation; Wcx p: Wilcoxon t-test and RB: Rank-Biserial Correlation (Cohen’s effect size).
As we can see, the control group showed no statistically significant improvement in most cases, except for case 1. However, the improvement in using AR apps presented a more substantial effect size. In the same line, the enhancement happened in most cases formatted by the experimental group. The experimental group presented better post-test scores in cases 1, 2 and 4. Case 3 was close to being significant. Moreover, the differences between pre-tests and post-tests were substantial, even in case 3. The results indicated significant differences between the pre-test and post-test; the post-test is the one that achieves a higher score in most cases in the experimental group.
Second, we evaluated the satisfaction with the learning resources used in the four cases. The results show a high level of satisfaction. Notably, in all four cases studied, students found the apps very easy to use, with scores above 4. For learning success and duration of the activity, all scores were close to 4. Ease of use and overall satisfaction were above 4, exceeding 4.5, with only case 2 scoring below 4.
Interestingly, case 3 presented the lowest scores. More details are shown in figure 8. Generally, students positively evaluate using learning resources in teaching and learning.
Figure 8. Scores of the considered variables for the different cases.

6. Discussion
This article investigates the importance of using AR apps for teaching STEM subjects in the 8th, 9th and 10th grades of secondary education. Syawaludin et al. (2019) state that STEM topics are generally abstract and challenging to understand. AR-based apps are an alternative way to concretise abstract concepts covered in secondary education (Cheng & Tsai, 2013; Paembonan & Ikhsan, 2021; Syawaludin et al., 2019). On the other hand, AR apps offer advantages such as ease of use, increased satisfaction, increased motivation and reduced students’ cognitive load (Sırakaya & Alsancak Sırakaya, 2020). Thus, we aim to evaluate the learning activities designed in AR-based STEM for secondary school students and their associated benefits.
Our first research question targeted the impact of using augmented reality applications (AR apps) on student learning. The findings from this study suggest that learning activities with augmented reality perform better than activities that only traditionally use textbooks. Research development in Indonesia supports our results with students in 8th grade who have better learning outcomes after the intervention using AR APPs in their science classes (Astuti et al., 2019). Similarly, applying a qualitative study, Karagozlu et al. (2019) suggest that attending science classes with students in 7th grade positively affects their learning. AR apps improve science knowledge in university students (Criollo-C et al., 2022; Mariscal et al., 2020) and in primary education students (Çetin & Türkan, 2022). Garzón et al. (2019) found through a meta-analysis of 61 studies that AR apps have a medium effect on learning effectiveness.
Our second research question was targeted to determine the level of satisfaction with using augmented reality applications (AR apps) in students’ learning. Our results show that students evaluate these apps satisfactorily. This agrees with other studies, such as Salvador-Herranz et al. (2013), in which the students manifested that using AR apps helped them improve their learning of science issues. Likewise, students expressed that the classes with these applications help retain knowledge (Cai et al., 2013). Karagozlu et al. (2019) found that students consider using these apps as an excellent methodology to be applied in their classes, as they believe that they provide them with benefits such as improving their attention and raising interest in science subjects.
Similarly, Liou et al. (2017) found that these applications are easy to use because students are often familiar with their handling. In terms of satisfaction with its use, our results are consistent and in line with other investigations (Karagozlu et al., 2019; Sáez-López et al., 2019; Salvador-Herranz et al., 2013; Wojciechowski & Cellary, 2013). However, it must be recognised that these apps are also often time-consuming (Laine et al., 2016), and this is reflected in our findings, which show that of the five categories, this was the lowest score.
Our findings reinforce previous research on the importance of AR apps in the teaching and learning process. Furthermore, our results corroborate the appreciation of student satisfaction when teachers accompany their classes with these applications (Maas & Hughes, 2020).
Despite our study’s positive results, the sample size restricts the generalisation of the results. However, most studies on this topic are conducted with the same sample size (Sırakaya & Alsancak Sırakaya, 2020). Another limitation is that our results are based on quantitative research. The results could be strengthened if accompanied by qualitative methodology, so we suggest applying a mixed methodological approach for future research.
7. Conclusions
Overall, apps help teach specific contents of the STEM curriculum in secondary education. The different AR experiences proved that using the mobile phone as a central element in using AR in the classroom is very appropriate.
The use of AR-based experiences is fascinating from the point of view of developing key competencies since it allows the integration of many of them in the same activity. Furthermore, some of the experiences were carried out in groups of students under lockdown due to COVID-19, who could carry out the expertise entirely or in an adapted way in real-time from home.
Practically, all of the AR experiences carried out have been rated by teachers and students as very motivating, with many students continuing to work with home applications involving their families.
One of the teacher's limitations is the lack of the required hardware, especially the lack of tablets in educational centres. However, in many cases, it is efficiently solvable thanks to the personal smartphones of the students themselves. One factor to consider if we want to use AR apps is time, which teachers should consider when using this resource in their classes.
Several apps can serve more than one subject, which shows that the management of this technology can effectively overcome compartmentalised teaching and highlight the relationship between the different STEM disciplines.
Funding
Educational Research Project, "Improving scientific competence through augmented reality (EDUCYL2020-02)", funded by the Consejería de Educación de la Junta de Castilla y León through the Dirección General de Innovación y Formación del Profesorado. Grant “Educación para el Cambio Climático y la Sostenibilidad, un estudio longitudinal de aprendizaje intergeneracional” PID2020-114358RB-I00 funded by MCIN/AEI/ 10.13039/501100011033 ERDF A way of making Europe. Grant “Impactos climáticos en la educacion y medidas de adaptación basadas en la naturaleza en la educación. Eduheat” TED2021-130300B-C21 funded by MCIN/AEI /10.13039/501100011033 and by the European Union NextGenerationEU/ PRTR
Authors’ contributions
Enzo Ferrari: Data curation, Formal analysis, Methodology, Software, Validation, Visualization.
Pablo Herrero-Teijón: Data curation, Formal análisis, Investigation, Methodology, Supervision, Validation, Visualization.
Laura Delgado Martín: Conceptualization.
Santiago Andrés Sánchez: Investigation.
Anne-Marie Ballegeer: Conceptualization, Validation, Writing – review & editing
Diego Corrochano Fernández: Conceptualization.
Miguel Ángel Fuertes: Writing – original draft.
Patricia González Ocejo: Supervision.
Camilo Ruiz Méndez: Conceptualization, Writing – original draft, Writing – review & editing.
References
Allen, M. J., & Yen, W. M. (1979). Introduction to Measurement Theory. Wadsworth. Inc.
Álvarez, S. (2016). El trabajo interdisciplinar en el aula de matemáticas. Diseño de una experiencia. [Trabajo fin de máster, Universidad de Salamanca].
Arici, F., Yildirim, P., Caliklar, Ş., & Yilmaz, R. M. (2019). Research trends in the use of augmented reality in science education: Content and bibliometric mapping analysis. Computers & Education, 142, Article 103647. https://doi.org/10.1016/j.compedu.2019.103647
Astuti, F. N., Suranto, S., & Masykuri, M. (2019). Augmented reality for teaching science: Students’ problem solving skill, motivation, and learning outcomes. JPBI (Jurnal Pendidikan Biologi Indonesia), 5(2), 305-312. https://doi.org/10.22219/jpbi.v5i2.8455
Blázquez, A. (2017). Realidad aumentada en educación. Universidad Politécnica de Madrid. Gabinete de Tele-Educación. Vicerrectorado de Servicios Tecnológicos de la Universidad Politécnica de Madrid.
Brown, J. S., Collins, A., & Duguid, P. (1989). Situated cognition and the culture of learning. Educational Researcher, 18(1), 32–42. https://doi.org/10.3102/0013189X018001032
Buitrago-Pulido, R. D. (2015). Incidencia de la realidad aumentada sobre el estilo cognitivo: caso para el estudio de las matemáticas. Educación y Educadores, 18(1), 27-41. https://doi.org/10.5294/edu.2015.18.1.2
Cabero Almenara, J. (2020). Aprendiendo del tiempo de la COVID-19. Revista Electrónica Educare (Educare Electronic Journal), 24(Suplemento Especial), 1-3. https://doi.org/10.15359/ree.24-s.2
Cabero Almenara, J., & Barroso Osuna, J. M. (2016). Ecosistema de aprendizaje de realidad aumentada: posibilidades educativas. TCE: Tecnología, Ciencia y Educación, 5, 141-154. https://doi.org/10.51302/tce.2016.101
Cabero Almenara, J., & Valencia, R. (2021). And COVID-19 transformed the educational system: reflections and experiences to learn. International Journal of Educational Research and Innovation (IJERI), (15), 218-228. https://doi.org/10.46661/ijeri.5246
Cai, S., Chiang, F. K., & Wang, X. (2013). Using the augmented reality 3D technique for a convex imaging experiment in a physics course. International Journal of Engineering Education, 29(4), 856–865.
Çetin, H., & Türkan, A. (2022). The Effect of Augmented Reality based applications on achievement and attitude towards science course in distance education process. Education and Information Technologies, 27(2), 1397–1415. https://doi.org/10.1007/s10639-021-10625-w
Chang, H. Y., Binali, T., Liang, J. C., Chiou, G. L., Cheng, K. H., Lee, S. W. Y., & Tsai, C. C. (2022). Ten years of augmented reality in education: A meta-analysis of (quasi-) experimental studies to investigate the impact. Computers & Education, 191, 104641. https://doi.org/10.1016/j.compedu.2022.104641
Chen, Y., Wang, Q., Chen, H., Song, X., Tang, H., & Tian, M. (2019). An overview of augmented reality technology. Journal of Physics: Conference Series, 1237(2), Article 022082. https://doi.org/10.1088/1742-6596/1237/2/022082
Cheng, K. H., & Tsai, C. C. (2013). Affordances of Augmented Reality in Science Learning: Suggestions for Future Research. Journal of Science Education and Technology, 22(4), 449–462. https://doi.org/10.1007/s10956-012-9405-9
Cohen, J. (2013). Statistical power analysis for the behavioral sciences (2nd ed.) Academic press. https://doi.org/10.4324/9780203771587
Criollo-C, S., Altamirano-Suarez, E., Jaramillo-Villacís, L., Vidal-Pacheco, K., Guerrero-Arias, A., & Luján-Mora, S. (2022). Sustainable Teaching and Learning through a Mobile Application: A Case Study. Sustainability, 14(11), Article 6663. https://doi.org/10.3390/su14116663
Dunleavy, M., & Dede, C. (2014). Augmented Reality Teaching and Learning. In J. M. Spector, M. D. Merrill, J. Elen, & M. J. Bishop (Eds.), Handbook of Research on Educational Communications and Technology (pp. 735–745). Springer New York. https://doi.org/10.1007/978-1-4614-3185-5_59
Ebel, R. L., & Frisbie, D. A. (1972). Essentials of educational measurement. Prentice Hall.
Estapa, A., & Nadolny, L. (2015). The effect of augmented reality enhanced mathematics lesson on student achievement and motivation. Journal of STEM Education, 16, 40-48.
Fernández-Enríquez, R., & Delgado-Martín, L. (2020). Augmented Reality as a Didactic Resource for Teaching Mathematics. Applied Sciences, 10(7), Article 2560. https://doi.org/10.3390/app10072560
Finch, W. H., & French, B. F. (2018). Educational and Psychological Measurement. Routledge. https://doi.org/10.4324/9781315650951
Quicios García, M. P., Herrero Teijón, P., & González Ocejo, P. (2020). La eficacia de la enseñanza a distancia durante el confinamiento por COVID-19 en las zonas de baja cobertura de la España vaciada. El caso de Salamanca. Enseñanza & Teaching: Revista Interuniversitaria de Didáctica, 38(2), 67-85. https://doi.org/10.14201/et20203826785
Garzón, J., Kinshuk, Baldiris, S., Gutiérrez, J., & Pavón, J. (2020). How do pedagogical approaches affect the impact of augmented reality on education? A meta-analysis and research synthesis. Educational Research Review, 31, Article 100334. https://doi.org/10.1016/j.edurev.2020.100334
Garzón, J., Pavón, J., & Baldiris, S. (2019). Systematic review and meta-analysis of augmented reality in educational settings. Virtual Reality, 23(4), 447–459. https://doi.org/10.1007/s10055-019-00379-9
Giasiranis, S., & Sofos, L. (2016). Production and evaluation of educational material using augmented reality for teaching the module of “Representation of the information on computers” in junior high school. Creative Education, 7, 1270-1291. https://doi.org/10.4236/ce.2016.79134
Gopalan, M., Rosinger, K., & Ahn, J. B. (2020). Use of quasi-experimental research designs in education research: Growth, promise, and challenges. Review of Research in Education, 44(1), 218-243. https://doi.org/10.3102/0091732X20903302
Hair, J. F., Black, W. C., Babin, B. J., & Anderson, R. E. (2019). Multivariate data analysis (8th Ed.). Annabel Ainscow.
Hedrick, T. E., Bickman, L., & Rog, D. J. (1993). Applied research design. A practical guide. Sage. https://doi.org/10.4135/9781412983457
Johnson, L., Adams Becker, S., Cummins, M., Estrada, V., Freeman, A., & Hall, C. (2016). The NMC Horizon Report: 2016 Higher Education Edition. The New Media Consortium.
Karagozlu, D., Kosarenko, N. N., Efimova, O. V., & Zubov, V. V. (2019). Identifying students’ attitudes regarding augmented reality applications in science classes. International Journal of Emerging Technologies in Learning, 14(22), 45–55. https://doi.org/10.3991/ijet.v14i22.11750
Laine, T. H., Nygren, E., Dirin, A., & Suk, H. J. (2016). Science Spots AR: a platform for science learning games with augmented reality. Educational Technology Research and Development, 64(3), 507–531. https://doi.org/10.1007/s11423-015-9419-0
Liou, H. H., Yang, S. J. H., Chen, S. Y., & Tarng, W. (2017). The influences of the 2D image-based augmented reality and virtual reality on student learning. Educational Technology and Society, 20(3), 110–121.
Maas, M. J., & Hughes, J. M. (2020). Virtual, augmented and mixed reality in K–12 education: A review of the literature. Technology, Pedagogy and Education, 29(2), 231–249. https://doi.org/10.1080/1475939X.2020.1737210
Magnusson, D. (1967). Test theory. Addison Wesley.
Mariscal, G., Jiménez, E., Vivas-Urias, M. D., Redondo-Duarte, S., & Moreno-Pérez, S. (2020). Virtual Reality Simulation-Based Learning. Education in the Knowledge Society, 21(11), 1–15. https://doi.org/10.14201/eks.20809
Martín-Gutiérrez, J., Mora, C. E., Añorbe-Díaz, B., & González-Marrero, A. (2017). Virtual technologies trends in education. Eurasia Journal of Mathematics, Science and Technology Education, 13(2), 469-486. https://doi.org/10.12973/eurasia.2017.00626a
Paembonan, T. L., & Ikhsan, J. (2021). Supporting Students’ Basic Science Process Skills by Augmented Reality Learning Media. Journal of Educational Science and Technology (EST), 7(2), 188-196. https://doi.org/10.26858/est.v0i0.19448
Pedrinaci, E., Caamaño, A., Cañal, P., & de Pro, A. (2012). 11 ideas clave: El desarrollo de la competencia científica. Graó.
Prendes Espinosa, C. (2015). Realidad aumentada y educación: Análisis de experiencias prácticas. Píxel-Bit. Revista de Medios y Educación, 46, 187-203. https://doi.org/10.12795/pixelbit.2015.i46.12
Price, L. R., (2017). Psychometric methods: Theory into practice. The Guilford Press.
Reinoso Ortiz, R. (2012). Posibilidades de la realidad aumentada en educación. Tendencias emergentes en educación con TIC. In J. Hernández Ortega, M. Pennesi, D. Sobrino López, & A. Vázquez Gutiérrez (Eds.), Tendencias emergentes en educación con TIC (pp. 175-197). Espiral.
Sáez-López, J. M., Sevillano-García, M. L. & Pascual-Sevillano, M. A. (2019) Aplicación del juego ubicuo con realidad aumentada en Educación Primaria. Comunicar. Revista Científica de Educomunicación, 27(61), 71-82. https://doi.org/10.3916/C61-2019-06
Salvador-Herranz, G., Pérez-López, D., Ortega, M., Soto, E., Alcañiz, M., & Contero, M. (2013). Manipulating Virtual Objects with Your Hands: A Case Study on Applying Desktop Augmented Reality at the Primary School. In 2013 46th Hawaii International Conference on System Sciences (Wailea, HI, USA, 7-10 January 2013) (pp. 31-39). https://doi.org/10.1109/HICSS.2013.390
Schleicher, A. (2020). The Impact of COVID-19 on Education: Insights from "Education at a Glance 2020". OECD Publishing.
Sinha, M., & Srivastava, M. (2022). Augmented Reality-Enabled Instagram Game Filters: Key to Engaging Customers. Journal of Promotion Management, 28(4), 467–486. https://doi.org/10.1080/10496491.2021.2008577
Sırakaya, M., & Alsancak Sırakaya, D. (2022). Augmented reality in STEM education: a systematic review. Interactive Learning Environments, 30(8), 1556–1569. https://doi.org/10.1080/10494820.2020.1722713
Squire, K. (2006). From content to context: Videogames as designed experience. Educational Researcher, 35(8), 19–29. https://doi.org/10.3102/0013189x035008019
Stanley, J. C., & Campbell, D. (1973). Diseños experimentales y cuasiexperimentales en la investigación social. Rand McNal.
Syawaludin, A., Gunarhadi, & Rintayati, P. (2019). Enhancing elementary school students’ abstract reasoning in science learning through augmented reality-based interactive multimedia. Jurnal Pendidikan IPA Indonesia, 8(2), 288–297. https://doi.org/10.15294/jpii.v8i2.19249
Villalustre Martínez, L., del Moral Pérez, M. E., & Neira Piñeiro, M. R. (2019). Percepción docente sobre la Realidad Aumentada en la Enseñanza de Ciencias en Primaria. Análisis DAFO. Revista Eureka sobre Enseñanza y Divulgación de las Ciencias, 16(3), 3301-3320. https://doi.org/10.25267/Rev_Eureka_ensen_divulg_cienc.2019.v16.i3.3301
Wojciechowski, R., & Cellary, W. (2013). Evaluation of learners’ attitude toward learning in ARIES augmented reality environments. Computers and Education, 68, 570–585. https://doi.org/10.1016/j.compedu.2013.02.014
Annexes
Evidence of item analysis and reliability
We calculated item indices typical of Classical Test Theory (CTT) as Magnusson (1967) recommended. CTT involve the item difficulty (P), Item discrimination (D) and Cronbach’s alpha (α) if the item is deleted. Item difficulty (P) is calculated as the proportion of correct responses on each item. According to Allen and Yen (1979), values between 0.30 and 0.70 provide helpful information about knowledge measurement. Moreover, values outside of this range, less than .3, are considered extremely difficult, and above .7 is moderately easy. Item Discrimination (D) is how an item differentiates those who know more from those who know less. D is based on the proportion of correct answers from the high group and the total number of correct answers from both the high and low groups. According to Ebel and Frisbie (1972, p. 232) and Price (2017), when D presents values above .4 are very good items, .30 to .39, reasonably good but possibly subject to improvement. Values between .20 to .29 Marginal items, usually needing improvement below. Finally, values less than .19 are Poor items to be rejected or improved by revision. An alternative technique for estimating item discrimination is the correlation (rpbs) between the item response and the total score on the scale (Finch & French, 2018). The reliability for every item is measured with Cronbach's alpha (if the item is deleted). This should have values close to or above .7. Average variance extracted should have values close to .4 with indicators loadings above .5.
According to the results in Table S.1, we can see that the most challenging item was item 6 (P = 0.282), and the easiest were items 5 and 9 (P = 0.846 and P = 0.821 respectively). Most items had P values within the 0.3–0.7 range that Allen and Yen (1978) suggested were recommended.1. Based upon D, we would conclude that the best discriminating item was 5. However, according to rpbs was item 1. On the other hand, the scale had an appropriate reliability (α=.717), and the average variance extracted was .371.
Annex Table S.1 Case 1. Descriptive Statistics and Item Analysis for Universe Quiz Items.
Nº |
Item |
Answers |
M |
SD |
P |
D |
rpbs |
α if Item deleted# |
Indicators loadings* |
|||
1 |
Which planet's axis is almost parallel to its orbital plane, making it spin nearly on its side? |
Venus |
Uranus |
Saturn |
Jupiter |
.667 |
.478 |
.667 |
.600 |
.691 |
.563 |
.574 |
2 |
The doughnut-shaped zones of highly energetic charged particles trapped at high altitudes in the magnetic field of Earth are known as: |
Van Allen radiation belt |
Magnetopause |
Magnetosphere |
Magnetosheath |
.667 |
.478 |
.667 |
.900 |
.376 |
.657 |
.573 |
3 |
Who discovered the laws of planetary motion? |
Galileo |
Newton |
Copernicus |
Kepler |
.692 |
.468 |
.692 |
.500 |
.542 |
.611 |
.510 |
4 |
What is the visible part of the Sun called? |
Atmosphere |
Lithosphere |
Photosphere |
Stratosphere |
.333 |
.478 |
.333 |
.427 |
.673 |
.569 |
.716 |
5 |
Which astronomer formulated the big bang theory? |
Georges Lemaître |
William Herschel |
Carl Sagan |
Edwin Hubble |
.846 |
.366 |
.846 |
1.00 |
.467 |
.622 |
.535 |
6 |
Which is the name of a radio source that is very far from Earth? |
Tracer |
Phaser |
Quasar |
Taser |
.282 |
.456 |
.282 |
.227 |
.601 |
.592 |
.564 |
7 |
Approximately how many kilometres are there in a light-year? |
9.5 x10¹² km |
9.5 x10⁹ km |
9.5 x10³ km |
9.5 x10⁶ km |
.333 |
.478 |
.333 |
.536 |
.464 |
.634 |
.694 |
8 |
Which is the hottest planet in our solar system? |
Mars |
Mercury |
Venus |
Saturn |
.462 |
.505 |
.462 |
.800 |
.351 |
.670 |
.686 |
9 |
What is the outermost region of the Sun’s atmosphere called? |
Chromosphere |
Penumbra |
Core |
Corona |
.821 |
.389 |
.821 |
.673 |
.442 |
.629 |
.631 |
M: Median, SD: Standard Deviation, P: item difficulty, D: Item discrimination, rpbs: correlation biserial punctual (alternative to D), and Cronbach’s alpha (α) if the item is deleted. #Cronbach’s α for total scale is 0.717.
* Average variance extracted is .371
The results in Table S.2 show that the most challenging items were items 7 (P = 0.469), and the most straightforward items were items 1 and 4 (P = 0.688). All items had P values within the range of 0.3-0.7. According to D and rpbs, we may conclude that the best discriminant item was item 5. This was adequate regarding reliability (α for total scale is 0.808.), and the average variance extracted is .475.
Annex Table S.2 Case 2. Descriptive Statistics and Item Analysis for Measurement Units Quiz Items.
Nº |
Item |
Answers |
M |
SD |
P |
D |
rpbs |
α if Item deleted# |
Indicators loadings* |
|||
1 |
What are the SI base units? |
9 |
6 |
8 |
7 |
.688 |
.471 |
.688 |
.900 |
.810 |
.756 |
.679 |
2 |
In what unit would an intensity of electric current be expressed? |
Newton |
Joule |
Coulomb |
Ampere |
.625 |
.492 |
.625 |
.700 |
.625 |
.786 |
.560 |
3 |
Which of the following is NOT a unit of measurement? |
Temperature |
Length and area |
Mass |
None of the above |
.688 |
.471 |
.688 |
.700 |
.651 |
.786 |
.754 |
4 |
Knowing that acceleration is a magnitude that expresses the variation of speed per unit of time, which unit of those shown should you use to express it in SI? |
ms-2 |
ms2 |
ms-1 |
ms |
.500 |
.508 |
.500 |
.327 |
.319 |
.841 |
.822 |
5 |
What is a Pascal equal to? |
kg m s-2 |
kg m-1 s-2 |
kg s2 m-1 |
None of the above |
.500 |
.508 |
.500 |
1.00 |
.834 |
.749 |
.633 |
6 |
Which of the following balls has the greatest speed? |
Golf 5.7 km/min |
Football 140.4km/h |
Baseball 155 mile/h (Note: 1 mile=1609m) |
Tennis 67m/s |
.500 |
.508 |
.500 |
.809 |
.662 |
.785 |
.684 |
7 |
The prefix "kilo" has a numerical value of: |
1000 |
100 |
0.001 |
0.01 |
.469 |
.507 |
.469 |
.718 |
.579 |
.800 |
.421 |
8 |
144km/h equal to: |
400 m/s |
4.0 dm/s |
400 m/seg |
40 m/s |
.594 |
.499 |
.594 |
.900 |
.732 |
.771 |
.856 |
M: Median, SD: Standard Deviation, P: item difficulty, D: Item discrimination, rpbs: correlation biserial punctual (alternative to D), and Cronbach’s alpha (α) if the item is deleted. #Cronbach’s α for total scale is 0.808.
* Average variance extracted is .475
Table S.3 shows that the most challenging was item 6 (P = 0.444), and the most straightforward items were items 5 to 9 (P = 0.926). However, we decided to keep them because they have crucial content validity. Using D and rpbs, we concluded that the best discriminant item was item 5. Concerning the reliability, this was satisfactory (α=.710), and the average variance extracted is .392.
Annex Table S.3 Case 3. Descriptive Statistics and Item Analysis for Crystal Lattices and Ionic Bonding Quiz Items.
Nº |
Item |
Answers |
M |
SD |
P |
D |
rpbs |
α if Item deleted# |
Indicators loadings* |
|||
1 |
What would be the charge on a calcium ion if a calcium atom loses two electrons? |
+2 |
-2 |
0 |
-1 |
.852 |
.362 |
.852 |
.444 |
.646 |
.559 |
.425 |
2 |
What would be the formula of an oxide if the metal ion has +2 charge? |
MO2 |
M2O2 |
M2O |
MO |
.741 |
.447 |
.741 |
.667 |
.554 |
.592 |
.651 |
3 |
The caesium chloride structure adopts a: |
Cubic lattice |
Hexagonal lattice |
Rocksalt structure |
None of the above |
.481 |
.509 |
.481 |
.889 |
.686 |
.547 |
.584 |
4 |
Which of the following unit cells has constituent particles occupying the corner positions only? |
Body-centred cell |
Primitive cell |
Face centred cell |
End-centred cell |
.481 |
.509 |
.778 |
.222 |
.316 |
.484 |
.513 |
5 |
Ionic compounds are normally: |
Soluble in water |
Insoluble in water |
Soluble in oil |
None of the above |
.444 |
.506 |
.481 |
1.00 |
.809 |
.635 |
.707 |
6 |
The number of Na+ ions which surround each CI- ion the NaCI crystal lattice is |
6 |
8 |
4 |
1 |
.926 |
.267 |
.444 |
.667 |
.446 |
.587 |
.532 |
7 |
A crystal is a solid composed of atoms, ions, or molecules arranged in a pattern that is periodic in how many dimensions? |
3 |
2 |
1 |
None of the above |
.926 |
.267 |
.926 |
.222 |
.555 |
.587 |
.695 |
8 |
It is the smallest part of a crystal that, if repeated regularly by translation in three dimensions, creates the whole crystal. |
Plant cell |
Special cell |
Body cell |
Unit cell |
.926 |
.267 |
.926 |
.222 |
.555 |
.640 |
.614 |
9 |
What determines ionic bonds to form? |
Number of total electrons |
Number of valence electrons |
Number of ionic electrons |
Number of total protons |
.778 |
.424 |
.926 |
.222 |
.343 |
.720 |
.821 |
M: Median, SD: Standard Deviation, P: item difficulty, D: Item discrimination, rpbs: correlation biserial punctual (alternative to D), and Cronbach’s alpha (α) if the item is deleted. #Cronbach’s α for total scale is 0.710. * Average variance extracted is .392
We can see from the results in Table S.4 that the most challenging item was item 6 (P = 0.481), and the most straightforward item was item 3 (P = 0.926). Using D, we can conclude that the most discriminating items were items 5 and 6. However, according to rpbs, item 1 was the best discriminant. With reliability concerns, this was below .7. However, it is adequate for exploratory studies (Hair et al., 2019) such as ours. The average variance extracted was appropriate, with .388.
Annex Table S.4 Case 4. Descriptive Statistics and Item Analysis for Minerals and Rocks Quiz Items.
Nº |
Item |
Answers |
M |
SD |
P |
D |
rpbs |
α if Item deleted# |
Indicators loadings* |
|||
1 |
What type of rock is coal? |
Conglomerate |
Silicate |
Metamorphic |
Sedimentary |
.889 |
.320 |
.889 |
.273 |
.553 |
.485 |
.545 |
2 |
Which element puts the green in emeralds? |
Chromium |
Rubidium |
Copper |
Iron |
.778 |
.424 |
.778 |
.545 |
.605 |
.468 |
.571 |
3 |
Which is the hardest form of pure carbon? |
Garnet |
Graphite |
Diamond |
Carbide |
.926 |
.267 |
.926 |
.182 |
.290 |
.557 |
.616 |
4 |
Which mineral is the principal ore of aluminium? |
Anthracite |
Pyrite |
Blenda |
Bauxite |
.704 |
.465 |
.704 |
.455 |
.506 |
.530 |
.696 |
5 |
What abundant mineral has many useful properties, including the piezoelectric effect? |
Diamond |
Quartz |
Alumina |
Coal |
.704 |
.465 |
.704 |
.723 |
.717 |
.404 |
.566 |
6 |
Which one is not included in group of Silicate Minerals: |
Carbonates |
Ferromagnesian |
Non-ferromagnesian |
Felsic |
.481 |
.509 |
.481 |
.723 |
.436 |
.584 |
.540 |
7 |
Which is not a clay mineral? |
Pyrite |
Kaolinite |
Montmorillonite |
Illite |
.593 |
.501 |
.593 |
.636 |
.530 |
.531 |
.786 |
M: Median, SD: Standard Deviation, P: item difficulty, D: Item discrimination, rpbs: correlation biserial punctual (alternative to D), and Cronbach’s alpha (α) if the item is deleted. #Cronbach’s α for total scale is 0.620. * Average variance extracted is .388
_______________________________
(*) Autor de correspondencia / Corresponding author