Education in the Knowledge Society 23 (2022)
![]()
Can Gamification Help in Increasing Motivation, Engagement, and Satisfaction? A gamified experience in teaching CS to students from other disciplines
¿Puede la gamificación ayudar a aumentar la motivación, el compromiso y la satisfacción? Experiencia gamificada en la enseñanza de la informática en alumnos de otras disciplinas
Miguel García-Iruelaa(*), Raquel Hijón-Neirab, Cornelia Connollyc
a Computer Science Department, Universidad Rey Juan Carlos, Madrid, España.
https://orcid.org/0000-0003-2383-6401 miguel.garciai@urjc.es.
b Computer Science Department, Universidad Rey Juan Carlos, Madrid, España.
https://orcid.org/0000-0003-3833-4228 raquel.hijon@urjc.es
c School of Education, College of Arts, Social Sciences, & Celtic Studies, National University of Ireland Galway, Ireland. Lero, SFI Centre for Software Research, National University of Ireland Galway, Ireland.
https://orcid.org/0000-0001-9778-5569 cornelia.connolly@nuigalway.ie
* Corresponding author
ABSTRACT
The digital revolution is causing the new generations to demand new ways of learning. Motivating students is one crucial element of the learning-teaching process to achieve students’ learning, which is the main objective of education. Using typical gaming elements in non-game environments, gamification transforms the learning process into a more motivating and enjoyable experience. Therefore, gamification offers adequate solutions for the educational needs of the new generation of students. Although most studies have found benefits from gamification, the results have not been encouraging in some cases. Several review studies suggest that more empirical studies are needed to investigate the motivating effects of using gamification in different educational settings and for specific student types. This study wants to answer whether using the proposed gamification design affects motivation, engagement, and satisfaction in teaching computer science to university students from other disciplinary areas such as journalism and audiovisual communication. The experiment consists of a gamified experience in a virtual classroom in Moodle for four weeks on general computer science content. A control group and a test group were used. The difference between the two was the use of gamified elements (points, badges, levels, task unlocking...). From the data obtained in this study, no significant differences were found in motivation and satisfaction between the different groups or the different methodologies. Our results demonstrate a specific positive correlation between engagement, motivation, and satisfaction. It is worth noting the positive values obtained in this type of course among all the students who were part of this experience and methodology.
Keywords
gaming; computer science education; learning sciences; motivation; engagement; satisfaction.
RESUMEN
La revolución digital está provocando que las nuevas generaciones demanden nuevas formas de aprendizaje. Motivar a los estudiantes a que presten atención y se comprometan con el material se ha convertido en uno de los objetivos de la educación. La gamificación, mediante el uso de elementos típicos del juego en entornos ajenos al juego, transforma el proceso de aprendizaje en una experiencia más motivadora y placentera, por lo que la gamificación ofrece soluciones adecuadas a las necesidades educativas de la nueva generación de estudiantes. Pese a que la mayoría de los estudios han encontrado beneficios del uso de la gamificación, en algunos casos los resultados no han sido alentadores. Varios estudios de revisión sugieren que se necesitan más estudios empíricos para investigar los efectos motivadores del uso de la gamificación en diferentes entornos educativos y para tipos específicos de estudiantes. Este estudio quiere dar respuesta a si el uso del diseño de gamificación propuesto afecta a la motivación, el compromiso y la satisfacción en la enseñanza de la informática en estudiantes universitarios de otras áreas disciplinares como el periodismo y la comunicación audiovisual. El experimento consta de una experiencia gamificada en un aula virtual en Moodle durante cuatro semanas sobre contenidos generales de informática. Se empleó un grupo de control y un grupo test, la diferencia entre ambos era el empleo de elementos gamificados (puntos, insignias, niveles, desbloqueo de tareas…). A partir de los datos obtenidos en este estudio no se encontraron diferencias significativas en motivación y satisfacción entre los distintos grupos ni entre las distintas metodologías. Nuestros resultados demuestran una cierta correlación positiva entre compromiso, motivación y satisfacción. Cabe destacar los valores positivos obtenidos en este tipo de cursos entre todos los alumnos que formaron parte de esta experiencia y metodología.
Palabras clave
juego; educación en informática; ciencias del aprendizaje; motivación; compromiso; satisfacción.
1. Introduction
The digital revolution is rapidly changing the world and humanity. Younger generations, who are born with digital technologies, called Millennials or Y-Generation, grow up in a world where everyone has a computer in their pocket (Koivisto & Hamari, 2014). These modern children prefer to learn information that is useful, fun, and relevant (Jukes & Dosaj, 2004), they learn differently (Prensky, 2014). The requirement to know how this generation can learn better and what their preferred learning styles are (Arabaci & Polat, 2013) has become a new educational problem (Campbell, 2016).
Motivating students to pay attention and engage to the material has become one of the central objectives of education. More importantly, educators want the desire to learn to come from the student and therefore the students to be intrinsically motivated to learn (Deci & Ryan, 2000). It is in this way that the use of gamification can be useful.
1.1 Gamification
Gamification refers to the design of systems, services, and processes to provide positive and engaging experiences like the engaging experiences provided by games, commonly with the aim of motivating beneficial behaviors (Hamari, 2019; Landers et al., 2018). The scientific definition of gamification is defined as the process of applying elements of the game to contexts outside the game (Ding et al., 2018; Domínguez et al., 2013; Schöbel et al., 2020; Zimmerling et al., 2019). The elements of the game most adopted in various fields of study are levels, points, badges, leaderboards, and avatars (Barata et al., 2017). There are many other mechanisms that are also available in gamified systems such as combat, unlock content, boss fights, quests, social graphics, certificates, and memes (Buckley & Doyle, 2017).
Since its conceptual beginning around 2010, gamification has increasingly caught the attention of academics and professionals (Hamari et al., 2014). In addition to winning popular advocates, the approach has gained momentum from the positive outlooks published in the Gartner (2011) and IEEE (2014) business analysis that predict that most companies and organizations will implement gamification in the near future. Gamification has been considered one of the emerging and widely adopted key teaching technologies in education in this decade (Johnson, L. et al., 2016). Gamification offers adequate solutions for the educational needs of the new generation of students (Bíró, 2014).
1.2 Motivation, engagement, and satisfaction
The notion of gamification makes the course and learning exercise more engaging and encourages students to work more actively through digital means, such as earning points, badges, and earning a top position on a leaderboard (Barata et al., 2017; Baydas & Cicek, 2019). The gamification component is believed to be effective in increasing student motivation and improving their learning experience, engagement, and performance. From a pedagogical perspective, it is believed that the provision of extrinsic rewards is likely to harm intrinsic motivation (Mekler et al., 2017). Conversely, some authors have stated that gamification influences extrinsic and intrinsic motivation (Adukaite et al., 2017; Jurgelaitis et al., 2019).
The values of commitment and motivation always correlate positively with the academic performance of a student. The more committed a student is, the more likely they are to participate and the more intrinsic motivation they have (Coffman, 2012). Additionally, along with motivation and engagement, the inclusion of student satisfaction is considered in this study.
2. Previous Studies
Gamification approaches are being applied more frequently to positively affect behavior and cognitive processes by improving the system or service with possibilities of motivation and, finally, providing experiences like those of games (Huotari & Hamari, 2017).
Motivational possibilities have been widely used in many fields, such as business (Alcivar & Abad, 2016; Xi & Hamari, 2020), logistics (Warmelink et al., 2020), crowdsourcing (Morschheuser et al., 2017; Mason et al., 2012), retail (Poncin et al., 2017), innovation (Leclercq et al., 2017), healthcare (Hammedi et al., 2017; Johnson, D. et al., 2016; Cafazzo et al., 2012), banking (Rodrigues et al., 2016), mobile marketing (Hofacker et al., 2016; Souiden et al., 2019), human resource management (Kim, 2018) and education (de Pontes et al., 2019; Dichev & Dicheva, 2017; Dicheva et al., 2019; Fraser et al., 2019; Hanus, & Fox, 2015; Koivisto, & Hamari, 2019; Majuri et al., 2018; Osatuyi et al., 2018; Seaborn & Fels, 2015). Furthermore, gamification has been used in many contexts related to education, at different educational levels: from primary school to higher education (Caponetto et al., 2014); higher education, training and tutorials, languages, elementary education, and lifelong education (de Sousa Borges et al., 2014); higher education and training Dicheva et al., 2015); K-6 level (Simões et al., 2013). Also, it has been used in various subjects, such as computer science, math, multimedia, communication, medicine, biology, psychology (Dicheva et al., 2015) or online communities and social networks, health and wellness, crowdsourcing, sustainability, orientation; research, marketing (Seaborn & Fels, 2015). All these options show their potential to improve learning outcomes (Koivisto & Hamari, 2019; Seaborn & Fels, 2015).
The main objective of gamification is to increase engagement (Kapp, 2012; Villagrasa et al., 2014). Low student participation and lack of motivation are the main problems that teachers must address in schools (Lee & Hammer, 2011). For this reason, gamification has been applied mainly in educational contexts (De-Marcos et al., 2017; Hamari et al., 2014).
Although several empirical studies have alluded to the positive impact of gamified learning results (Göksün & Gürsoy, 2019; Hassan et al., 2019; Huang & Hew, 2018; Huang et al., 2019; Lo & Hew, 2020), other studies have produced contradictory results (Baydas & Cicek, 2019; Ding, 2019; Kyewski & Krämer, 2018; Rachels & Rockinson-Szapkiw, 2018). Some studies stated that the use of points, badges, levels, and leaderboards did not promote students' sense of community and did not increase students' competence, their need for satisfaction and intrinsic motivation (Ding et al., 2017; Mekler et al., 2017). For example, the study by Kyewski and Kramer (2018) reported that insignia did not successfully increase intrinsic motivation during the instructional period. These findings also suggest that gamification is not always appropriate for all types of content or context.
Review studies on the effectiveness of gamification are generally optimistic, mainly listing positive or mixed results of applied gamified strategies (Buckley & Doyle, 2017; Caponetto et al., 2014; Dicheva et al., 2015; Koivisto & Hamari, 2019; Lambruschini, & Pizarro, 2015; Majuri et al., 2018; Nah et al, 2014; Osatuyi et al., 2018; Reiners et al., 2012; Seaborn & Fels, 2015). However, they mention the need for more controlled experimental research on the impact of gamification, regardless of the application domain or the gamified strategy used (Buckley & Doyle, 2017; Caponetto et al., 2014; Dichev & Dicheva, 2017; Dicheva et al., 2015; Koivisto & Hamari, 2019; Majuri et al., 2018; Lambruschini, & Pizarro, 2015; Landers et al., 2018; Nah et al, 2014; Osatuyi et al., 2018; Reiners et al., 2012; Seaborn & Fels, 2015).
Dicheva et al. (2015) conducted a mapping study of gamification in education that investigated current empirical research on its implementation. They found that the reviewed articles reported promising results, but most empirical studies did not provide a rigorous evaluation, making it difficult to understand the reasons behind the positive or negative results. Therefore, Dicheva et al. (2015) suggest that more empirical studies are needed to investigate the motivating effects of using game elements in different educational contexts and for specific types of students. Although gamification has an important position in education, both within and outside universities, there is still little effective guidance on how to combine different gamification functions to improve learning performance in different educational contexts (Hanus & Fox, 2015; Koivisto & Hamari, 2019; Seaborn & Fels, 2015).
This study presents a gamified experience that brings together the main elements of gamification to observe the effect that the proposed design has on motivation, engagement and satisfaction in learning general computer concepts in university students belonging to the journalism and audiovisual communication area. The question we want to answer is whether the use of gamification affects motivation, engagement, and satisfaction in teaching CS in students from other disciplines.
3. Research Method
In March of 2019 in the public University Rey Juan Carlos, as part of the laboratory of the subject New Technologies in Information Systems it was proposed to carry out a series of activities in a course implemented under the Moodle platform, to check if it is true that the gamification in this environment can have a positive effect on motivation, engagement, and satisfaction.
The duration of the laboratory was 4 weeks, the same as the proposed course. The course was about general concepts in computing: hardware, software, operating systems, networks, security, and licenses. The subject is integrated into the university grades to provide students with basic technological knowledge to students in the area of humanities and social sciences.
3.1. Sample
The average age of the students was 20 years old. They are studying the first year of university in different degrees, but all of them grouped in the same branch of knowledge. Unlike previous experiences (Garcia-Iruela, et al., 2020) this group of students did not belong to a technical profile. By belonging to different cycles and schedule shifts, the students separated into 6 different groups as we can see in table 1. The decision did not consider age or previous experience, this group was chosen so that they knew the classmates with whom they shared a course and did not detect that some were an experimental group and others a control group. Each group in the experiment corresponds to a group with a different time shift at the university.
Half of the groups were in a gamified course, in total there were 174 registered students. The other half was a control group, in total there were 171 students enrolled in the course. Of the total number of registered students, 146 reached the final in the experimental groups and 150 in the control groups. There were 21 dropouts (12.1%) among control students and 28 among experimental students (16.4%), in total 14.2% of students dropped out. In the analysis of the experience, only the sample of students who completed it was considered, as there were no data in the surveys of the students who dropped out.
To sum up the sample information, in Table 1 we can observe by group if it was gamified, the degree, the number of students, the numbers of women, the number of men, the number of dropouts, and the teacher of the group.
Table 1. Groups information.
Group |
G1 |
G2 |
G3 |
G4 |
G5 |
G6 |
Gamified? |
NO |
NO |
NO |
YES |
YES |
YES |
Degree |
Audiovisual |
Journalism |
Journalism |
Audiovisual |
Audiovisual |
Journalism |
Students |
56 |
65 |
50 |
67 |
56 |
51 |
Dropouts |
8(14%) |
8(12%) |
5(10%) |
13(19%) |
9(16%) |
6(12%) |
Male |
21(37.5%) |
27(42%) |
16(32%) |
29(43%) |
29(52%) |
15(29%) |
Female |
35(62.5%) |
38(58%) |
34(68%) |
38(57%) |
27(48%) |
36(71%) |
Teacher |
T1 |
T2 |
T2 |
T3 |
T1 |
T2 |
3.2. Research design
The experiment is carried out for a month with the students of the face-to-face subject of new technologies from journalism and audiovisual communication. As part of the subject's laboratory, a virtual classroom was created in Moodle with additional activities that were worth 10% of the laboratory grade. This virtual classroom was accessible from the university and from home, the questionnaires and Moodle tasks was designed to be done from home, but some students completed them in-class sessions without teacher guidance. There were no restrictions to avoid this.
The subject has 6 ECTS credits and consisted of two face-to-face sessions of two hours per week, the proposed experience required an additional load of approximately half an hour per week.
The study used an experimental design between subjects in which the students were randomized into six groups (3 experimental groups and 3 control groups). The characteristics of the students such as age, sex or knowledge of the subject were not used for the distribution. Both groups had 4 weeks with the same activities to do. The only difference is that the experimental group enjoyed a gamified course in which they obtained points, badges, unlock tasks... while the control group did not have the gamified elements. The gamification elements used were:
• Badges: A badge that has been awarded for passing a milestone throughout the course, in our case, when completing an optional task, completing the survey, completing all the compulsory tasks of the week, completing all the compulsory tasks of the course, and completing all the compulsory and optional tasks. The badges were visible only for the student how got them.
• Feedback: An immediate response provided when performing the tasks. A message was automatically sent to the student at the end of each of the tasks.
• Missions: Each week was a mission that contained four mandatory tasks and one optional. It was required to do three lessons that consist in three pages, each page had a text about something related to the content and a question about it. The other two tasks were forums, in the mandatory one, students had to give their opinion on a topic related to the mission and in the optional one, they had to put a link to a social media post related to the content of the mission.
• Points: Certain points are awarded when performing a certain action or delivering a certain task. As the course progressed, the tasks completed awarded more points. For example, the lessons from the first mission awarded 15 points, those from the second 20, those from the third 25, and those from the fourth 30.
• Levels: Each level requires a certain number of points, as points are obtained, users’ level up. There were 8 levels: level 1 (0 points), level 2 (45 points), level 3 (90 points), level 4 (180 points), level 5 (300 points), level 6 (480 points), level 7 (570 points) and level 8 (1000 points).
• Leaderboard: A table showing the list of all the participants in the same group. Students can see the participants, their score, and their level.
• Time limit: Time established to finish a task; each task had a restriction of dates to meet.
• Locked content: To access some tasks it was necessary to have completed a previous task of the same mission.
The choice of elements is due to their widespread use and the possibility of integrating them all into the Moodle platform using the Gamemo plugin (García-Iruela & Hijón-Neira, 2018).
3.3. Surveys
To obtain feedback on the motivation and engagement of the students, it was decided to carry out a survey of the students at the end of the course. The survey has three different parts, the first to measure motivation, the second to measure engagement, and the third to measure satisfaction. In this way we can measure those aspects of each student at the end of the experience. Each of these parts is inspired by previously tested questionnaires specified in this section.
3.3.1. Motivation
The first part of the survey has used the Intrinsic Motivation Inventory (IMI), “It is a multidimensional measurement device intended to assess participants subjective experience related to a target activity in laboratory experiments” (Ryan & Deci, 2006). This allows us to evaluate different scales related to motivation, depending on what you want to measure, one or the other subscales will be used without affecting the results (Ryan & Deci, 2006). In our study, we considered the following scales important for evaluating motivation: “Interest/enjoyment”, “Perceived competence”, “Perceived choice”, “Pressure/tension” and “Effort/importance”.
At least 4 questions have been used to measure each scale since the incremental R for each element above 4 items for any given factor are quite small (Ryan & Deci, 2006). Each question had to be answered using a Likert scale from 1 (not all true) to 7 (very true).
3.3.2. Satisfaction
This part of the survey has seven questions common to the experimental and control groups, the first 4 questions have been collected from the satisfaction section of the USE questionnaire (Lund, 2001) and the other three from (De-Marcos et al., 2014). All these questions are rated from 1 (Strongly disagree) to 7 (Strongly agree).
3.3.3. Engagement
This part of the survey is based on the short version of the user engagement scale (UES) developed in “A practical approach to measuring user engagement with the refined user engagement scale (UES) and new UES short form” (O’Brien et al., 2018). The engagement measure is based on four factors:
1. FA: Focused attention, feeling absorbed in the interaction and losing track of time.
2. PU: Perceived usability, negative affect experienced because of the interaction and the degree of control and effort expended.
3. AE: Aesthetic appeal, the attractiveness and visual appeal of the interface.
4. RW: Include a mix question that are not included in the others (EN: Endurability, the overall success of the interaction and users’ willingness to recommend an application to others or engage with it in future and NO: Novelty, curiosity, and interest in the interactive task.
They have been formulated in a random order, preventing students from detecting the factor to be measured, in addition to adapting the questions to the context as recommended in (O’Brien et al., 2018). Each factor integrates three questions using a Likert scale from 1 to 5.
4. Analysis
To analyse the data, we will first show the global and sex data of gamified students versus non-gamified students, considering motivation, satisfaction and engagement. The information will then be displayed for each of the 6 groups (3 gamified and 3 control).
4.1 Gamified vs Control
4.1.1. Motivation and satisfaction
After 4 weeks, at the end of the course, students completed a survey to measure motivation, satisfaction and engagement. Table 2 shows the mean, maximum value, minimum value, and standard deviation of the gamified and control group obtained in motivation and satisfaction global and by sex.
Table 2. Average and standard deviation of motivation and satisfaction.
Motivation |
Satisfaction |
||||
AVG(Max-Min) |
SD |
AVG(Max-Min) |
SD |
||
Control |
Global |
4.3 (7-1) |
1.15 |
4.57(7-1) |
1.28 |
Women |
4.29(7-1) |
1.21 |
4.71(7-1) |
1.3 |
|
Men |
4.31(6.43-1.43) |
1.06 |
4.33(7-1.29) |
1.21 |
|
Gamified |
Global |
4.15(6.86-1) |
1.33 |
4.51(7-1) |
1.37 |
Women |
4.21(6.86-1) |
1.34 |
4.68(7-1) |
1.28 |
|
Men |
4.07(6.71-1.29) |
1.33 |
4.3(7-1) |
1.46 |
|
Both in motivation and satisfaction, the control group obtained higher values. We find that student motivation and satisfaction are related. Pearson's correlation coefficient between global motivation and global satisfaction found a positive correlation of r = 0.69 in the control group and r = 0.81 in the gamified group. Regarding women we find in the control group r = 0.64 and r = 0.85 in the gamified group. In men the correlation coefficient in the control group is 0.81 and in the test group 0.76.
Since we have two groups of samples greater than 15 and we seek to find significant effects between the values, we can use the t-test. Applying the t-test with average of motivation and satisfaction, we found that the differences found between the two groups (control and gamified) in satisfaction (ρ = 0.73) and motivation (ρ = 0.27) are not significant as they are greater than 0.05. If we do the t-test comparing the differences between men and women in motivation they are not significant (control group ρ = 0.91 and gamified group ρ = 0.46), while in satisfaction they are close to being significant (control group ρ = 0.06 and gamified group ρ = 0.07).
Taking into account that the maximum value is 7 points and values above 4 were obtained, it can be said that the results in motivation and course satisfaction are positive in both groups of students and in both sexes.
4.1.2. Engagement
This section shows the values obtained on engagement and its subsections: focused attention, perceived usability, aesthetic appeal, and endurability-novelty. They were evaluated on a 5-point scale. In Table 3 we can see the global values obtained in engagement and the standard deviation in the control group, in the test group and separated by sex.
Table 3. Average and standard deviation of engagement.
Engagement |
|||
AVG (Max-Min) |
SD |
||
Control |
Global |
3.44(4.75-1) |
0.67 |
Women |
3.46(4.75-1) |
0.71 |
|
Men |
3.41(4.75-1.42) |
0.6 |
|
Gamified |
Global |
3.44(5-1.92) |
0.63 |
Women |
3.44(4.83-1.92) |
0.66 |
|
Men |
3.45(5-1.92) |
0.59 |
|
To measure students’ engagement, a survey was also used at the end of the course. Four aspects were measured: "Focused attention", "Perceived usability", "Aesthetic appeal" and "Endurability-Novelty". The average between the mentioned aspects gives the engagement value. In Table 4 we can see the results obtained.
Table 4. Average and standard deviation of focused attention, perceived usability, aesthetic appeal, and endurability-novelty.
Focused attention |
Perceived usability |
||||
AVG(Max-Min) |
SD |
AVG(Max-Min) |
SD |
||
Control |
Global |
3.22(5-1) |
0.79 |
3.82(5-1) |
0.94 |
Women |
3.25(5-1) |
0.86 |
3.85(5-1) |
0.96 |
|
Men |
3.16(5-1) |
0.66 |
3.77(5-1.67) |
0.91 |
|
Gamified |
Global |
3.32(5-1.33) |
0.75 |
3.92(5-1) |
0.91 |
Women |
3.30(5-1.33) |
0.78 |
3.91(5-2) |
0.9 |
|
Men |
3.34(5-1.67) |
0.72 |
3.94(5-1) |
0.94 |
|
Aesthetic appeal |
Endurability-novelty |
||||
AVG(Max-Min) |
SD |
AVG(Max-Min) |
SD |
||
Control |
Global |
3.24(5-1) |
0.79 |
3.48(5-1) |
0.87 |
Women |
3.23(5-1) |
0.84 |
3.49(5-1) |
0.92 |
|
Men |
3.26(4.67-1.33) |
0.7 |
3.45(5-1.33) |
0.8 |
|
Gamified |
Global |
3.12(5-1) |
0.83 |
3.42(5-1) |
0.86 |
Women |
3.08(5-1) |
0.85 |
3.46(5-1) |
0.85 |
|
Men |
3.16(5-1) |
0.81 |
3.36(5-1) |
0.87 |
|
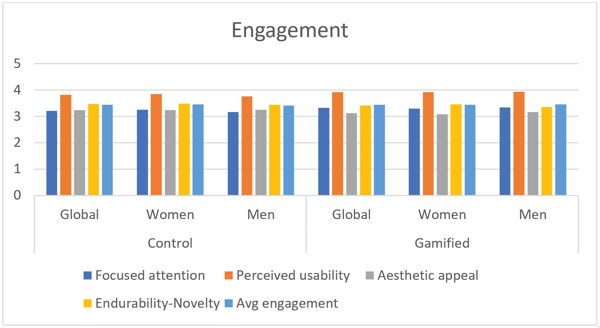
We observed similar behavior in both the control and gamified groups and among men and women in all four aspects. Applying the t-test between general values in both groups (Focused attention ρ = 0.21; Perceived usability ρ = 0.29; Aesthetic appeal ρ = 0.15; Endurability-Novelty ρ = 0.53) all values are greater than 0.05, therefore, there are no significant differences. We can see this graphically in Figure 1.
Figure 1. Results of engagement.
If we analyze it by sex, we also do not obtain significant differences in any of the values as we can see in Table 5.
Table 5. ρ-value between men and women in control and gamified group in focused attention, perceived usability, aesthetic appeal, and endurability-novelty.
Focused attention |
Perceived usability |
Aesthetic appeal |
Endurability-Novelty |
Engagement |
|
Control |
0.49 |
0.58 |
0.86 |
0.75 |
0.65 |
Gamified |
0.74 |
0.88 |
0.52 |
0.46 |
0.91 |
In engagement average, it stands out that both groups have the same value. Regardless of the methodology, practically the same results were obtained. On a positive note, it must be said that on a scale of 1 to 5 all aspects exceeded 3.
If we analyze the correlation between motivation and engagement, we obtain a coefficient r = 0.68 in the control group and r = 0.76 in the gamified group. If we analyze the correlation between engagement and satisfaction the coefficient in the control group is 0.75 and in the gamified group is 0.72. Positive correlations are achieved in both groups in both comparisons, as if we performed the analysis by sex in both groups.
4.1.3. Other aspects
Along with motivation, satisfaction and engagement, more interesting aspects such as "Pressure/tension", "Perceived choice", "Perceived competence" and "Effort/importance" were analyzed. In Table 6 we can see the results of both the gamified and control groups.
Table 6. Average and standard deviation of "Pressure/tension", "Perceived choice", "Perceived competence" and "Effort/importance".
Pressure/tension |
Perceived choice |
||||
AVG(Max-Min) |
SD |
AVG(Max-Min) |
SD |
||
Control |
Global |
2.87 (6.8-1) |
1.23 |
3.92(6.4-1) |
1.04 |
Women |
2.99(6.8-1) |
1.29 |
3.86(6.4-1) |
1.15 |
|
Men |
2.67(5.2-1) |
1.09 |
4.03(5.6-1.4) |
0.8 |
|
Gamified |
Global |
2.88(6.4-1) |
1.31 |
4.13(7-1) |
1.16 |
Women |
3(6.4-1) |
1.31 |
4.19(7-1) |
1.23 |
|
Men |
2.72(6.4-1) |
1.29 |
4.05(6.6-1.4) |
1.06 |
|
Perceived competence |
Effort/importance |
||||
AVG(Max-Min) |
SD |
AVG(Max-Min) |
SD |
||
Control |
Global |
4.54(7-1.2) |
1.13 |
4.42(6.25-2.5) |
0.73 |
Women |
4.5(7-1.2) |
1.11 |
4.43(6.25-2.5) |
0.78 |
|
Men |
4.61(7-1.8) |
1.17 |
4.4(5.75-2.5) |
0.64 |
|
Gamified |
Global |
4.59(7-1.4) |
1.04 |
4.44(5.75-2.5) |
0.66 |
Women |
4.49(7-2.2) |
1.03 |
4.53(5.75-3.25) |
0.63 |
|
Men |
4.74(7-1.4) |
1.03 |
4.33(5.5-2.5) |
0.67 |
|
We found very similar behavior between the sexes or between gamified and non-gamified students. We can see this clearly in Figure 2.
Figure 2. Results of Pressure/tension, Perceived choice, Perceived competence, and Effort/importance.
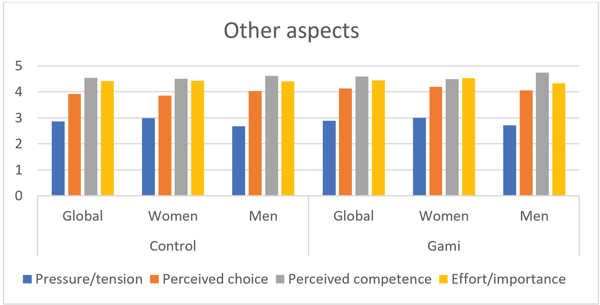
According to the t-test, no significant differences were found (Pressure/tension ρ = 0.91; Perceived choice ρ = 0.07; Perceived competence ρ = 0.66; Effort/importance ρ = 0.76). Pressure/tension is a negative aspect, in our case it should be considered that the value obtained is below 3 compared to the rest of the aspects, they have values above half of the scale 1 to 7. If we analyze by sex, the only significant difference is found between the women of the control group and the test group in “Perceived Choice” with ρ = 0.04 the rest of the values are far from being significant.
4.2. Groups
4.2.1. Motivation and satisfaction
In the previous section we have compared the students belonging to control groups (G1, G2 and G3) versus the gamified ones (G4, G5 and G6). For a more exhaustive analysis we will compare each of the 6 groups separately. In Table 7 we check the values obtained in satisfaction and motivation of the 6 groups of students.
Table 7. Results of motivation and satisfaction in each group.
Motivation |
Satisfaction |
||||
AVG(Max-Min) |
SD |
AVG(Max-Min) |
SD |
||
Control |
G1 |
4.39 (7-1) |
1.25 |
4.52(7-1.29) |
1.41 |
G2 |
4.42(6.57-1.57) |
1.1 |
4.64(7-1) |
1.21 |
|
G3 |
4.04(6.14-2.14) |
1.09 |
4.54(7-1.71) |
1.24 |
|
Gamified |
G4 |
3.87(6.71-1) |
1.41 |
4.18(7-1) |
1.5 |
G5 |
4.12(6.86-1.29) |
1.24 |
4.59(7-1) |
1.3 |
|
G6 |
4.56(6.71-1.43) |
1.25 |
4.89(7-2.43) |
1.18 |
|
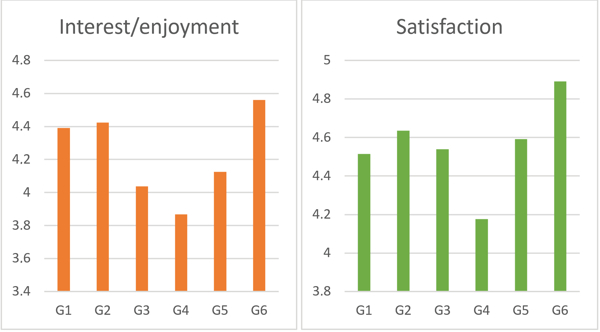
G1, G2 and G3 were the control group, we observed similar values between them. However, in G4, G5 and G6 that formed the gamified group, we see more disparate values between the groups in addition to a similar behavior in both satisfaction and motivation. As we can detect in Figure 3, we note that the drawing on both diagrams is similar.
Figure 3. On the right, satisfaction results for each group. On the left, motivation results for each group.
4.2.2. Engagement
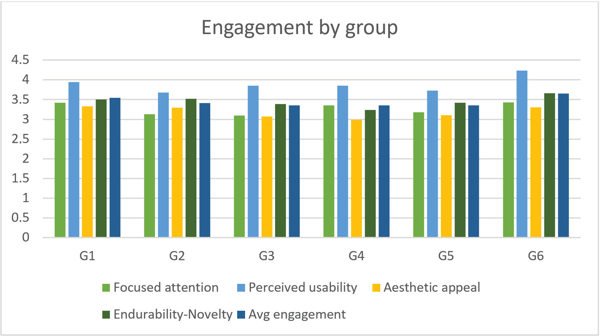
In Table 8 we can see the engagement in the 6 groups. Unlike motivation and satisfaction, engagement in all groups is very similar. If we look at the 4 aspects into which we subdivide engagement in Table 9, we see similar behavior in the values of all the groups, regardless of the methodology. The usability perception in all the groups stands out notably.
Table 8. Results of engagement in each group.
Engagement |
|||
AVG (Max-Min) |
SD |
||
Control |
G1 |
3.55(4.75-1.33) |
0.69 |
G2 |
3.41(4.75-1) |
0.73 |
|
G3 |
3.35(4.25-1.42) |
0.57 |
|
Gamified |
G4 |
3.36(5-2.17) |
0.57 |
G5 |
3.36(5-1.92) |
0.67 |
|
G6 |
3.66(4.83-1.92) |
0.61 |
|
Table 9. Results of the aspects of engagement in each group.
Focused attention |
Perceived usability |
||||
AVG(Max-Min) |
SD |
AVG(Max-Min) |
SD |
||
Control |
G1 |
3.42(5-1) |
0.75 |
3.94(5-1.67) |
0.91 |
G2 |
3.13(5-1) |
0.87 |
3.68(5-1) |
1.04 |
|
G3 |
3.1(4.33-1) |
0.71 |
3.85(5-2) |
0.82 |
|
Gamified |
G4 |
3.35(5-1.67) |
0.65 |
3.85(5-1) |
0.92 |
G5 |
3.18(5-1.33) |
0.82 |
3.73(5-1) |
0.96 |
|
G6 |
3.43(4.67-1.33) |
0.78 |
4.24(5-2) |
0.79 |
|
Aesthetic appeal |
Endurability-Novelty |
||||
AVG(Max-Min) |
SD |
AVG(Max-Min) |
SD |
||
Control |
G1 |
3.33(5-1) |
0.82 |
3.5(5-1.33) |
0.9 |
G2 |
3.3(5-1) |
0.79 |
3.52(5-1) |
0.91 |
|
G3 |
3.07(4.33-1.33) |
0.75 |
3.39(5-1.33) |
0.79 |
|
Gamified |
G4 |
2.99(5-1) |
0.87 |
3.23(5-1) |
0.93 |
G5 |
3.1(5-1) |
0.8 |
3.42(5-1) |
0.87 |
|
G6 |
3.3(5-1.33) |
0.8 |
3.66(5-1.67) |
0.69 |
|
In Figure 4 it is possible to show in a graphic way the similar behavior in the values of all the groups, regardless of the methodology.
Figure 4. Results of the aspects of engagement in each group.
If we analyze the correlations between motivation, satisfaction, and engagement, we obtain positive values in the 6 groups (Table 10).
Table 10. Pearson correlation coefficient between motivation, engagement, and satisfaction.
Motivation vs Satisfaction |
Motivation vs engagement |
Satisfaction vs engagement |
||
Control |
Global |
0.69 |
0.68 |
0.75 |
G1 |
0.73 |
0.71 |
0.77 |
|
G2 |
0.66 |
0.66 |
0.77 |
|
G3 |
0.68 |
0.73 |
0.73 |
|
Gamified |
Global |
0.81 |
0.76 |
0.72 |
G4 |
0.76 |
0.72 |
0.67 |
|
G5 |
0.83 |
0.74 |
0.72 |
|
G6 |
0.84 |
0.84 |
0.8 |
|
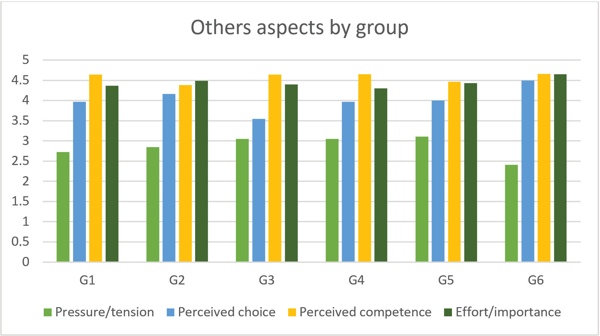
4.2.3. Other aspects
In all groups, “Perceived Competence” is better rated along with “Effort/importance”. "Perceived choice", although with significantly lower values, is still well valued. “Pressure/tension”, despite being a negative value, has a value greater than 2 in all groups, reaching over 3 in some of them, as can be seen in Table 11.
Table 11. Average and standard deviation of "Pressure/tension", "Perceived choice", "Perceived competence" and "Effort/importance".
Pressure/tension |
Perceived choice |
||||
AVG(Max-Min) |
SD |
AVG(Max-Min) |
SD |
||
Control |
G1 |
2.73 (6.4-1) |
1.17 |
3.97(6.4-1.4) |
1 |
G2 |
2.85(6.4-1) |
1.06 |
4.16(5.8-1) |
0.98 |
|
G3 |
3.05(6.8-1) |
1.47 |
3.55(6-1.2) |
1.05 |
|
Gamified |
G4 |
3.05(6.4-1) |
1.27 |
3.96(6.20-1.8) |
1.09 |
G5 |
3.11(6-1) |
1.31 |
4(6.40-1) |
1.13 |
|
G6 |
2.41(6.4-1) |
1.25 |
4.5(7-1.4) |
1.22 |
|
Perceived competence |
Effort/importance |
||||
AVG(Max-Min) |
SD |
AVG(Max-Min) |
SD |
||
Control |
G1 |
4.64(7-1.2) |
1.16 |
4.37(5.75-2.5) |
0.71 |
G2 |
4.38(7-1.6) |
1.17 |
4.48(5.5-3) |
0.62 |
|
G3 |
4.64(7-2.8) |
1.05 |
4.4(6.25-2.5) |
0.87 |
|
Gamified |
G4 |
4.65(7-2.4) |
1.08 |
4.3(5.75-2.5) |
0.71 |
G5 |
4.47(6.8-1.4) |
1.1 |
4.43(5.5-2.75) |
0.66 |
|
G6 |
4.66(7-2.2) |
0.91 |
4.65(5.5-3.25) |
0.53 |
|
Figure 5 shows the behavior of the values in a bar chart in which the trends can be seen visually.
Figure 5. Results of Pressure/tension, Perceived choice, Perceived competence, and Effort/importance in each group.
In the data shown by each group, the division between the sexes is not shown because the values obtained in each group comparing the sexes were the same as comparing gamified and non-gamified students.
5. Discussion
In this study, the intention was to analyze engagement, satisfaction, and motivation in a specific sample of students and with a specific gamification design, these aspects can be said that they are positively related to a student's academic performance (Coffman, 2012).
Unlike previous studies of short duration and with weak data (Dichev & Dicheva, 2017; Dicheva et al, 2015), a control group has been used to support the results and the four-week design that could be considered as medium duration.
In previous studies on gamification, positive results have been found in its use in education (Göksün & Gürsoy, 2019; Hassan et al., 2019; Huang & Hew, 2018; Huang et al., 2019; Lo & Hew, 2020), however other studies have produced contradictory results (Baydas & Cicek, 2019; Ding, 2019; Kyewski & Krämer, 2018; Rachels & Rockinson-Szapkiw, 2018).
In this case, although the motivation in the control group was higher than the gamified one, no significant differences were found and therefore no negative effects were found with the provision of extrinsic rewards in intrinsic motivation as in (Mekler et al, 2017). Nor can it be assured that in our case gamification influenced extrinsic and intrinsic motivation as in other studies (Adukaite et al., 2017; Jurgelaitis et al., 2019).
No positive results were found regarding engagement either, contrasting with studies such as (Rojas-López et al., 2019) that managed to improve student engagement in solving the challenges successfully. Possibly this difference is due to the design or the context in which the gamification is applied.
Therefore, the results of this study are among those that have found no positive effects on gamification, but no measurable negative effects either. A similar value of the aspects analyzed is observed in the 6 groups of the experience regardless of the methodology.
A correlation has been found between student motivation, engagement, and satisfaction with the experience. We can say that achieving greater motivation and engagement will imply better student satisfaction regarding the design of a course. Therefore, considering (Coffman, 2012) it is possible that satisfaction is also related to academic performance.
6. Limitations and future work
Although, this study includes the elements most used in gamification, such as the tables and badges (Barata et al., 2017), the results do not have to be the same if a different gamification design is used or with a different sample or in a different context. An easy-to-implement design has been sought for the experience that can be easily reproduced by any teacher without too much effort when using the GameMo plugin.
This study has focused on providing information about how a gamification design works in a specific context. The experience took place in a course on general computer science concepts with students of journalism and audiovisual communication degrees at a public university in Madrid. The results could differ in other subjects related to the degree, other studies, in another type of university or different educational level. The results help us to broaden the field of knowledge with results on motivation, engagement, and satisfaction in university-level students.
The experience had a specific design with several gamification elements in a Moodle platform lasting four weeks, the extension or reduction in time and the use of a different design could obtain different results.
This study focuses on the motivation, engagement, and satisfaction of students through surveys. It would be interesting to analyze other aspects such as the activity generated by the students and their academic performance and compare it with the data from this study.
Since a specific design is covered, it could be studied in other contexts such as a different educational level, degrees from other areas or in different subjects. Likewise, as a possible future work, there is the use of other gamified designs to check if it is possible to obtain different results in motivation, engagement, and satisfaction.
7. Conclusions
From the data obtained in this study no significant differences were found in engagement, motivation, and satisfaction between the different groups or the different methodologies. Contrary to popular belief, both motivation and satisfaction are higher in the control group compared to gamified students. Engagement was similar in both the test and control groups.
We obtained correlation between engagement, motivation, and satisfaction regardless of the methodology. In the 6 groups of students there is a similar behavior in engagement, satisfaction, and motivation. We can therefore claim that a group of students with greater motivation will achieve greater satisfaction and engagement like in academic courses of this type of motivated students will have a greater probability of obtaining greater satisfaction and engagement.
Regarding the four aspects that measure engagement, their behavior is similar in the 6 groups analyzed independently of the methodology. No significant differences are found. Therefore, we can say that it does not depend on whether the group is gamified or not. Our results demonstrate a certain positive correlation between engagement, motivation, and satisfaction in all the groups. The three values are interrelated with each other.
Aspects such as "Pressure / tension", "Perceived choice", "Perceived competence" and "Effort / importance" do not have significant differences between groups or methodology either. A lower value in “Pressure / tension” is observed with respect to the other values, it can be said that the positive aspects in this experience reach higher levels than the negative.
These data are obtained from the experience carried out in a subject on computer science in the degrees of journalism and audiovisual communication in a Spanish public university. Through a specific gamified design using the Moodle platform.
As a general conclusion, no significant difference is obtained between the gamified and the non-gamified group in this experience in any of the parameters. What the study demonstrates is a correlation between satisfaction, motivation, and engagement. It is worth noting the positive values obtained in this type of course among all the students who were part of this experience and methodology.
References
Adukaite, A., Van Zyl, I., Er, Ş., & Cantoni, L. (2017). Teacher perceptions on the use of digital gamified learning in tourism education: The case of South African secondary schools. Computers & Education, 111, 172–190. https://doi.org/10.1016/j.compedu.2017.04.008
Alcivar, I., & Abad, A. G. (2016). Design and evaluation of a gamified system for ERP training. Computers in Human Behavior, 58, 109–118. https://doi.org/10.1016/j.chb.2015.12.018
Arabaci, B., & Polat, M. (2013). Dijital yerliler, dijital göçmenler ve sinif yonetimi. Elektronik Sosyal Bilimler Dergisi, 12(47), 11–20. https://dergipark.org.tr/tr/pub/esosder/issue/6161/82824
Barata, G., Gama, S., Jorge, J., & Gonçalves, D. (2017). Studying student differentiation in gamified education: A long-term study. Computers in Human Behavior, 71, 550–585. https://doi.org/10.1016/j.chb.2016.08.049
Baydas, O., & Cicek, M. (2019). The examination of the gamification process in undergraduate education: A scale development study. Technology, Pedagogy and Education, 28(3), 269–285. https://doi.org/10.1080/1475939X.2019.1580609
Bíró, G. I. (2014). Didactics 2.0: A pedagogical analysis of gamification theory from a comparative perspective with a special view to the components of learning. Procedia-Social and Behavioral Sciences, 141, 148–151. https://doi.org/10.1016/j.sbspro.2014.05.027
Buckley, P., & Doyle, E. (2017). Individualising gamification: An investigation of the impact of learning styles and personality traits on the efficacy of gamification using a prediction market. Computers & Education, 106, 43–55. https://doi.org/10.1016/j.compedu.2016.11.009
Cafazzo, J. A., Casselman, M., Hamming, N., Katzman, D. K., & Palmert, M. R. (2012). Design of an mHealth app for the self-management of adolescent type 1 diabetes: a pilot study. Journal of Medical Internet Research, 14(3), e70. https://doi.org/10.2196/jmir.2058
Campbell, A. A. (2016). Gamification in higher education: Not a trivial pursuit Doctoral thesis. St. Thomas University Miami Gardens. Tallahassee, FL, USA.
Caponetto, I., Earp, J., & Ott, M. (2014). Gamification and education: A literature review. In European Conference on Games Based Learning (Vol. 1, p. 50). Academic Conferences International Limited.
Coffman, T. (2012). Using inquiry in the classroom: Developing creative thinkers and information literate students. R&L Education.
Deci, E. L., & Ryan, R. M. (2000). The" what" and" why" of goal pursuits: Human needs and the self-determination of behavior. Psychological Inquiry, 11(4), 227–268. https://doi.org/10.1207/S15327965PLI1104_01
De-Marcos, L., Domínguez, A., Saenz-de-Navarrete, J. & Pagés, C., (2014). An empirical study comparing gamification and social networking on e-learning. Computers & education, 75, 82–91. https://doi.org/10.1016/j.compedu.2014.01.012
De-Marcos, L., Garcia-Cabot, A., & Garcia-Lopez, E. (2017). Towards the social gamification of e-learning: A practical experiment. International Journal of Engineering Education, 33(1), 66–73.
de Pontes, R. G., Guerrero, D. D., & de Figueiredo, J. C. (2019). Analyzing gamification impact on a mastery learning introductory programming course. In Proceedings of the 50th ACM technical symposium on computer science education (pp. 400–406). https://doi.org/10.1145/3287324.3287367
de Sousa Borges, S., Durelli, V. H., Reis, H. M., & Isotani, S. (2014). A systematic mapping on gamification applied to education. In Proceedings of the 29th annual ACM symposium on applied computing (pp. 216–222). https://doi.org/10.1145/2554850.2554956
Dichev, C., & Dicheva, D. (2017). Gamifying education: what is known, what is believed and what remains uncertain: a critical review. International Journal of Educational Technology in Higher Education, 14(1), 1–36. https://doi.org/10.1186/s41239-017-0042-5
Dicheva, D., Dichev, C., Agre, G., & Angelova, G. (2015). Gamification in education: A systematic mapping study. Journal of Educational Technology & Society, 18(3), 75–88. https://doi.org/10.1109/LaTiCE.2014.10
Dicheva, D., Irwin, K., & Dichev, C. (2019). OneUp: Engaging students in a gamified data structures course. In Proceedings of the 50th ACM Technical Symposium on Computer Science Education (pp. 386–392). https://doi.org/10.1145/3287324.3287480
Ding, L. (2019). Applying gamifications to asynchronous online discussions: A mixed methods study. Computers in Human Behavior, 91, 1–11. https://doi.org/10.1016/j.chb.2018.09.022
Ding, L., Er, E., & Orey, M. (2018). An exploratory study of student engagement in gamified online discussions. Computers & Education, 120, 213–226. https://doi.org/10.1016/j.compedu.2018.02.007
Ding, L., Kim, C., & Orey, M. (2017). Studies of student engagement in gamified online discussions. Computers & Education, 115, 126–142. https://doi.org/10.1016/j.compedu.2017.06.016
Domínguez, A., Saenz-de-Navarrete, J., De-Marcos, L., Fernández-Sanz, L., Pagés, C., & Martínez-Herráiz, J. J. (2013). Gamifying learning experiences: Practical implications and outcomes. Computers & education, 63, 380–392. https://doi.org/10.1016/j.compedu.2012.12.020
Fraser, G., Gambi, A., Kreis, M., & Rojas, J. M. (2019). Gamifying a software testing course with code defenders. In Proceedings of the 50th ACM Technical Symposium on Computer Science Education (pp. 571–577). https://doi.org/10.1145/3287324.3287471
Garcia-Iruela, M., Fonseca, M. J., Hijon-Neira, R., & Chambel, T. (2020). Gamification and computer science students’ activity. IEEE Access, 8, 96829–96836. https://doi.org/10.1109/ACCESS.2020.2997038
Garcia-Iruela, M., & Hijon-Neira, R. (2018). Proposal of a management interface for gamified environments in Moodle. In 2018 International Symposium on Computers in Education (SIIE). IEEE. https://doi.org/10.1109/SIIE.2018.8586766
Gartner (2011). Gartner says by 2015, more than 50 percent of organizations that manage innovation processes will gamify those processes. https://bit.ly/3QNdbT9
Göksün, D. O., & Gürsoy, G. (2019). Comparing success and engagement in gamified learning experiences via Kahoot and Quizizz. Computers & Education, 135, 15–29. https://doi.org/10.1016/j.compedu.2019.02.015
Hamari, J. (2019). Gamification. In G. Ritzer, & C. Rojek (Eds.). The Blackwell Encyclopedia of sociology. John Wiley & Sons. https://doi.org/10.1002/9781405165518.wbeos1321
Hamari, J., Koivisto, J., & Sarsa, H. (2014). Does gamification work?--a literature review of empirical studies on gamification. In 2014 47th Hawaii international conference on system sciences (pp. 3025–3034). IEEE. https://doi.org/10.1109/HICSS.2014.377
Hammedi, W., Leclerq, T., & Van Riel, A. C. (2017). The use of gamification mechanics to increase employee and user engagement in participative healthcare services: A study of two cases. Journal of Service Management, 28(4), 640–661. https://doi.org/10.1108/JOSM-04-2016-0116
Hanus, M. D., & Fox, J. (2015). Assessing the effects of gamification in the classroom: A longitudinal study on intrinsic motivation, social comparison, satisfaction, effort, and academic performance. Computers & education, 80, 152–161. https://doi.org/10.1016/j.compedu.2014.08.019
Hassan, M. A., Habiba, U., Majeed, F., & Shoaib, M. (2019). Adaptive gamification in e-learning based on students’ learning styles. Interactive Learning Environments, 29(4), 545–565. https://doi.org/10.1080/10494820.2019.1588745
Huang, B., & Hew, K. F. (2018). Implementing a theory-driven gamification model in higher education flipped courses: Effects on out-of-class activity completion and quality of artifacts. Computers & Education, 125, 254–272. https://doi.org/10.1016/j.compedu.2018.06.018
Huang, B., Hew, K. F., & Lo, C. K. (2019). Investigating the effects of gamification-enhanced flipped learning on undergraduate students’ behavioral and cognitive engagement. Interactive Learning Environments, 27(8), 1106–1126. https://doi.org/10.1080/10494820.2018.1495653.
Hofacker, C. F., De Ruyter, K., Lurie, N. H., Manchanda, P., & Donaldson, J. (2016). Gamification and mobile marketing effectiveness. Journal of Interactive Marketing, 34, 25–36. https://doi.org/10.1016/j.intmar.2016.03.001
Huotari, K., & Hamari, J. (2017). A definition for gamification: anchoring gamification in the service marketing literature. Electronic Markets, 27(1), 21–31. https://doi.org/10.1007/s12525-015-0212-z
IEEE (2014). Everyone’s a gamer – IEEE experts predict gaming will be integrated into more than 85 percent of daily tasks by 2020. https://prn.to/3AcdWhz
Johnson, L., Becker, S. A., Cummins, M., Estrada, V., Freeman, A., & Hall, C. (2016). NMC horizon report: 2016 higher education edition (pp. 1–50). The New Media Consortium. https://www.learntechlib.org/p/171478/
Johnson, D., Deterding, S., Kuhn, K. A., Staneva, A., Stoyanov, S., & Hides, L. (2016). Gamification for health and wellbeing: A systematic review of the literature. Internet Interventions, 6, 89–106. https://doi.org/10.1016/j.invent.2016.10.002
Jukes, I., & Dosaj, A. (2004) Understanding DK (digital kids). Teaching and learning in the new digital landscape. https://bit.ly/3KjRPdF
Jurgelaitis, M., Čeponienė, L., Čeponis, J., & Drungilas, V. (2019). Implementing gamification in a university-level UML modeling course: A case study. Computer Applications in Engineering Education, 27(2), 332–343. https://doi.org/10.1002/cae.22077
Kapp, K. M. (2012). The gamification of learning and instruction: game-based methods and strategies for training and education. John Wiley & Sons.
Kim, T. W. (2018). Gamification of labor and the charge of exploitation. Journal of business ethics, 152(1), 27–39. https://doi.org/10.1007/s10551-016-3304-6
Koivisto, J., & Hamari, J. (2014) Demographic differences in perceived benefits from gamification. Computers in Human Behavior, 35, 179–188. https://doi.org/10.1016/j.chb.2014.03.007
Koivisto, J., & Hamari, J. (2019). The rise of motivational information systems: A review of gamification research. International Journal of Information Management, 45, 191–210. https://doi.org/10.1016/j.ijinfomgt.2018.10.013
Kyewski, E., & Krämer, N. C. (2018). To gamify or not to gamify? An experimental field study of the influence of badges on motivation, activity, and performance in an online learning course. Computers & Education, 118, 25–37. https://doi.org/10.1016/j.compedu.2017.11.006
Lambruschini, B. B., & Pizarro, W. G. (2015). Tech—Gamification in university engineering education: Captivating students, generating knowledge. In 2015 10th International Conference on Computer Science & Education (ICCSE) (pp. 295–299). IEEE. https://doi.org/10.1109/ICCSE.2015.7250259
Landers, R. N., Auer, E. M., Collmus, A. B., & Armstrong, M. B. (2018). Gamification science, its history and future: Definitions and a research agenda. Simulation & Gaming, 49(3), 315–337. https://doi.org/10.1177/1046878118774385
Leclercq, T., Poncin, I., & Hammedi, W. (2017). The engagement process during value co-creation: Gamification in new product-development platforms. International Journal of Electronic Commerce, 21(4), 454–488. https://doi.org/10.1080/10864415.2016.1355638
Lee, J. J., & Hammer, J. (2011). Gamification in education: What, how, why bother? Academic exchange quarterly, 15(2), 146.
Lo, C. K., & Hew, K. F. (2020). A comparison of flipped learning with gamification, traditional learning, and online independent study: the effects on students’ mathematics achievement and cognitive engagement. Interactive Learning Environments, 28(4), 464–481. https://doi.org/10.1080/10494820.2018.1541910
Lund, A. M. (2001). Measuring usability with the use questionnaire12. Usability interface, 8(2), 3–6.
Majuri, J., Koivisto, J., & Hamari, J. (2018). Gamification of education and learning: A review of empirical literature. In Proceedings of the 2nd international GamiFIN conference, GamiFIN 2018. CEUR-WS. http://ceur-ws.org/Vol-2186/paper2.pdf.
Mason, A. D., Michalakidis, G., & Krause, P. J. (2012). Tiger nation: empowering citizen scientists. In Proceedings of the 2012 6th IEEE International Conference on Digital Ecosystems Technologies (pp. 1–5). IEEE. https://doi.org/10.1109/DEST.2012.6227943
Mekler, E. D., Brühlmann, F., Tuch, A. N., & Opwis, K. (2017). Towards understanding the effects of individual gamification elements on intrinsic motivation and performance. Computers in Human Behavior, 71, 525–534. https://doi.org/10.1016/j.chb.2015.08.048
Morschheuser, B., Hamari, J., Koivisto, J., & Maedche, A. (2017). Gamified crowdsourcing: Conceptualization, literature review, and future agenda. International Journal of Human-Computer Studies, 106, 26–43. https://doi.org/10.1016/j.ijhcs.2017.04.005
Nah, F. F.-H., Zeng Q., Telaprolu V. R., Ayyappa A. P., Eschenbrenner B. (2014). Gamification of Education: A Review of Literature. In F. F.-H. Nah (Ed.) HCI in Business. HCIB 2014. Lecture Notes in Computer Science (vol 8527, pp. 401–409). Springer. https://doi.org/10.1007/978-3-319-07293-7_39
O’Brien, H. L., Cairns, P., & Hall, M. (2018). A practical approach to measuring user engagement with the refined user engagement scale (UES) and new UES short form. International Journal of Human-Computer Studies, 112, 28–39. https://doi.org/10.1016/j.ijhcs.2018.01.004
Osatuyi, B., Osatuyi, T., & De La Rosa, R. (2018). Systematic review of gamification research in is education: a multi-method approach. Communications of the Association for Information Systems, 42(1), 5. https://doi.org/10.17705/1CAIS.04205
Poncin, I., Garnier, M., Mimoun, M. S. B., & Leclercq, T. (2017). Smart technologies and shopping experience: Are gamification interfaces effective? The case of the Smartstore. Technological Forecasting and Social Change, 124, 320–331 https://doi.org/10.1016/j.techfore.2017.01.025
Prensky, M. (2014). The World Needs a New Curriculum: It's time to lose the "proxies," and go beyond "21st century skills"—and get all students in the world to the real core of education. Educational Technology, 54(4), 3–15
Rachels, J. R., & Rockinson-Szapkiw, A. J. (2018). The effects of a mobile gamification app on elementary students’ Spanish achievement and self-efficacy. Computer Assisted Language Learning, 31(1-2), 72–89. https://doi.org/10.1080/09588221.2017.1382536.
Rojas-López, A., Rincón-Flores, E. G., Mena, J. J., García-Peñalvo, F. J., & Ramírez-Montoya, M. S. (2019). Engagement in the course of Programming in Higher Education through the use of Gamification. Universal Access in the Information Society, 18(3), 583–597. https://doi.org/10.1007/s10209-019-00680-z
Reiners, T., Wood, L. C., Chang, V., Gütl, C., Herrington, J., Teräs, H., & Gregory, S. (2012). Operationalising gamification in an educational authentic environment. In Proceedings of the IADIS International Conference on Internet Technologies & Society (ITS 2012) (pp.93–100). IADIS.
Rodrigues, L. F., Costa, C. J., & Oliveira, A. (2016). Gamification: A framework for designing software in e-banking. Computers in Human behavior, 62, 620–634. https://doi.org/10.1016/j.chb.2016.04.035
Ryan, R. M., & Deci, E. L. (2006). Intrinsic motivation inventory (IMI). Self-Determination Theory, An Approach to Human Motivation and Personality. https://bit.ly/3Aj0Pvb
Schöbel, S., Janson, A., Jahn, K., Kordyaka, B., Turetken, O., Djafarova, N., Saqr, M., Wu, D., Söllner, M., Adam, M., Heiberg Gad, P., Wesseloh, H., & Leimeister, J. M. (2020). A Research Agenda for the Why, What, and How of Gamification Designs: Outcomes of an ECIS 2019 Panel. Communications of the association for information systems, 46(1), 30. https://doi.org/10.17705/1CAIS.04630
Seaborn, K., & Fels, D. I. (2015). Gamification in theory and action: A survey. International Journal of human-computer studies, 74, 14–31. https://doi.org/10.1016/j.ijhcs.2014.09.006
Simões, J., Redondo, R. D., & Vilas, A. F. (2013). A social gamification framework for a K-6 learning platform. Computers in Human Behavior, 29(2), 345–353. https://doi.org/10.1016/j.chb.2012.06.007
Souiden, N., Ladhari, R., & Chiadmi, N. E. (2019). New trends in retailing and services. Journal of Retailing and Consumer Services, 50, 286–288 https://doi.org/10.1016/j.jretconser.2018.07.023
Villagrasa, S., Fonseca, D., Redondo, E., & Duran, J. (2014). Teaching case of gamification and visual technologies for education. Journal of Cases on Information Technology (JCIT), 16(4), 38–57. http://dx.doi.org/10.4018/jcit.2014100104
Warmelink, H., Koivisto, J., Mayer, I., Vesa, M., & Hamari, J. (2020). Gamification of production and logistics operations: Status quo and future directions. Journal of business research, 106, 331–340. https://doi.org/10.1016/j.jbusres.2018.09.011
Xi, N., & Hamari, J. (2020). Does gamification affect brand engagement and equity? A study in online brand communities. Journal of Business Research, 109, 449–460. https://doi.org/10.1016/j.jbusres.2019.11.058
Zimmerling, E., Höllig, C. E., Sandner, P. G., & Welpe, I. M. (2019). Exploring the influence of common game elements on ideation output and motivation. Journal of Business Research, 94, 302–312. https://doi.org/10.1016/j.jbusres.2018.02.030