ISSN electrónico: 2172-9077
DOI: https://doi.org/10.14201/fjc.31217
ADVERTISING ENGAGEMENT: CONCEPTUALIZATION, SCALE DEVELOPMENT AND VALIDATION
Engagement publicitario: conceptualización, desarrollo de escala y validación
Dr. Haluk AKARSU
Research Assistant, Department of Public Relations and Advertising, Anadolu University, Türkiye
E-mail: halukakarsu@anadolu.edu.tr
 https://orcid.org/0000-0002-0838-8455
Prof. Dr. Necip Serdar SEVER
Professor, Department of Public Relations and Advertising, Anadolu University, Türkiye
E-mail: nssever@anadolu.edu.tr
https://orcid.org/0000-0002-3273-3984
Fecha de recepción del artículo: 24/01/2023
Fecha de aceptación definitiva: 13/03/2023
ABSTRACT
Even though there is wide use of the advertising engagement concept in the advertising sector, only a limited number of studies have focused on the concept and the measurement of the construct. Furthermore, there is a lack of consensus regarding the conceptualization of engagement in the marketing and advertising literature. In this study, we conceptualize advertising engagement and develop a 24-item scale called ‘Engagement Towards Advertisement’ (EA), which includes two factors: behavioral intention and mental processing. The EA scale development process encompasses four studies. Study 1 consists of item generation (N = 86), expert review (N=5), and pilot study (N=65). In study 2, item purification is carried out (N=309). Study 3 encompasses scale refinement, confirmation, and validation (N=408). Study 4 deals with conducting test-retest reliability (N=52) and evaluation of the general reliability of the scale, based on the data obtained in study 3. There is strong evidence that supports the reliability, convergent, and discriminant validity of the EA scale. The scale offers an opportunity for future empirical research in the area and provides a useful tool for researchers to collect data related to consumers’ level of engagement towards advertisements.
Keywords: engagement; advertising engagement; scale development; validity; reliability.
RESUMEN
A pesar de que el concepto de engagement publicitario se usa extensamente en la industria publicitaria, hay pocos estudios que se han centrado en la medición del concepto y la estructura. En este estudio, primero se ha trazado un marco conceptual para la estructura denominada «engagement» y los investigadores han propuesto una definición. Luego, se ha elaborado una escala denominada la Escala de Engagement con la Publicidad, que consta de 24 ítems y dos factores. El proceso de desarrollo de la Escala de Engagement Publicitario se ha completado como resultado de cuatro estudios. En el Estudio 1, se ha creado un conjunto de elementos (N=86), se ha obtenido la opinión de expertos (N=5) y se ha realizado un estudio piloto (N=65). En el Estudio 2 se ha realizado un análisis factorial exploratorio partiendo de los datos obtenidos (N=309). En el Estudio 3, se ha realizado un análisis factorial confirmatorio mediante la recolección de datos nuevamente (N=408) y se han verificado la precisión y la validez de la escala. La confiabilidad de la escala también se ha probado en el último estudio, el Estudio 4 (N=52). Como resultado del análisis, se han identificado pruebas sólidas que respaldan la confiabilidad y la validez de la Escala de Engagement Publicitario.
Palabras clave: engagement; engagement publicitario; desarrollo de escala; validez; confiabilidad.
1. Introduction
With every passing day, the number of touchpoints increases between consumers and brands. Magna (2021) reports that global all-media advertising spending grew by almost 22 % to reach a new all-time high of 710 billion dollars. However, consumers are trying to avoid advertisements. In 2019, 527 million people used mobile browsers that block advertisements by default, and 236 million people blocked advertisements on their desktops (Blockthrough, 2020). According to the We Are Social and Hootsuite’s report (2022), today, 37 % of Internet users use tools to block advertisements for at least part of their online activities. In addition, the Havas Group (2017) claim that people would not care if 74 % of the brands they use every day just disappeared. These situations reveal a massive challenge to the advertising and marketing sector. To overcome such challenges, engagement is seen as a key metric in marketing management (Haven, 2007). What is the engagement though? Many studies have tried to answer this question. However, the concept remains ambiguous.
Although its roots date back to the seventeenth century, engagement has been an increasingly popular concept for the marketing sector and researchers since the 2000s. Nowadays, organizations such as the Gallup Consulting, Advertising Research, and Interactive Burea organize seminars and conferences (Brodie, Hollebeek, Jurić & Ilić, 2011). Platforms like YouTube and Facebook create engagement metrics. Many authors (e.g., Brodie et al., 2011; Gambetti & Graffigna, 2010; Hollebeek, Glynn & Brodie, 2014) have tried to explain engagement. However, even though the number of engagement studies is increasing, various discussions also arise; these are listed below.
The first is that there are differences in the definition of engagement. Therefore, there is no consensus on the concept. For example, in the marketing and communication literature, the concept has five fundamental uses: customer engagement, consumer engagement, brand engagement, media engagement, and advertising engagement (AE) (Gambetti & Graffigna, 2010). Each use has a different meaning. In addition, AE is the least studied field compared to the others. The second, although it is often claimed that engagement is a multidimensional construct, is that most studies focus only on the behavioral dimension of engagement (Brodie et al., 2011), and that engagement is described as digital behavior (e.g., Chaffey, 2007; Gavilanes, Flatten & Brettel, 2018). This point of view reduces engagement to certain behavior, such as clicking, sharing, or commenting (Akarsu & Sever, 2019) and blocks understanding of its multidimensional nature. In addition, there is a need for various measurement tools that can measure engagement in all its dimensions, unlike practitioners. This is because measurement tools will contribute to the elimination of the ambiguities of AE by enabling different and empirical research studies.
We attempt to close this gap by conducting a comprehensive examination of the engagement literature and developing a measure of individuals’ level of engagement towards advertisements. This paper first offers various conceptualizations of engagement in the marketing and advertising literature. Subsequently, conceptualization and a definition of AE are offered. After this, we develop a two-dimensional construct, behavioral intention and mental processing. We present a finalized valid and reliable 24-item scale, which we call the Engagement Towards Advertisement Scale (EA Scale). Considering all these things, this research contributes to the engagement literature in the marketing and advertising area. Additionally, the EA scale allows for new studies by collecting data related to consumers’ levels of engagement towards advertisements.
2. Conceptualization of engagement in the marketing and advertising engagement
Today, engagement is the main driving force behind postmodern behavior and decision-making (Gambetti & Graffigna, 2010). In the 2000s, the concept attracts the attention of marketing and advertising researchers, and engagement has started to become the subject of studies carried out in marketing management. With different engagement studies, different interpretations of the term have arisen, such as connection, attachment, emotional involvement, and participation. However, it should be noted that these emerging conceptual interpretations can only be used to describe specific forms of engagement (Brodie et al., 2011). A number of authors combine various conceptualizations and definitions of engagement. We provide an overview of engagement conceptualizations and definitions offered in the marketing and advertising literature in Table 1, which reveals the following observations.
Table 1. Different definitions and conceptualizations of engagement
Author |
Definition |
Conceptualization |
Dimensions |
Community engagement generated by the consumer's intrinsic motivation to interact and collaborate with community members. |
Community Engagement |
Cognitive Emotional Behavioral |
|
A psychological process that designs the elements necessary for a brand to achieve and maintain customer loyalty. |
Customer Engagement |
Cognitive Emotional Behavioral |
|
It is a multidimensional concept that includes cognitive, emotional and/or behavioral dimensions. |
Consumer Engagement |
Cognitive Emotional Behavioral |
|
A positive and satisfying mental state resulting from the use of brands in consumers. |
Consumer Brand Engagement |
Vigor Dedication Absorption |
|
The amount of emotion that continues throughout the advertising process. |
Advertising Engagement |
Emotional |
|
Engagement is a state of being involved, occupied, fully absorbed, or engrossed in something-sustained attention. |
Engagement |
Cognitive Emotional Behavioral |
|
The customer's level of cognitive, emotional, and behavioral investment in specific brand interactions |
Customer Brand Engagement |
Cognitive Emotional Behavioral |
|
Customer engagement behavior goes beyond transactions and may be specifically defined as a customer’s behavioral manifestations that have a brand or firm focus, beyond purchase, resulting from motivational drivers. |
Customer Engagement Behavior |
Behavioral |
|
Customer engagement is a behavioral manifestation toward the brand or firm that goes beyond transactions |
Customer Engagement |
Behavioral |
|
The intensity of an individual's participation in the organization's proposals or corporate activities. |
Consumer Brand Engagement |
Cognitive Emotional Behavioral |
|
It is a measure of contextual relevance in which the messages of the brand are designed in any medium and presented based on the content of the medium. |
Advertising Engagement |
Unidimensional |
To begin with, marketing scholars refer to the concept of engagement in different ways. Concepts such as consumer engagement, consumer brand engagement, customer engagement behavior make it harder to understand the nature of engagement. These examples also suggest that scholars are struggling to find the right name for the concept.
Second, it is interesting to note that authors in marketing hold varying views of engagement’s nature. A number of authors approach engagement as a psychological state, while others approach it as a psychological process. In addition, many authors explain engagement as behavior. The main reason for approaching engagement as a behavior may be related to the ease of measuring online behavior (e.g., clicking, sharing, and commenting). However, we believe that such a view reduces advertising engagement to specific behaviors such as click, shares or comments on ads.
Third, as Table 1 notes, according to a few authors engagement is a one-dimensional construct. Certain of these authors focus on the emotional dimension of engagement, while others focus on the behavioral dimension. Meanwhile, most researchers agree that engagement is a multidimensional construct of cognition, emotion, and behavior. However, studies have tended to focus on the behavioral dimension of engagement. We also agree with the idea that engagement is a multidimensional construct and further studies are needed for explaining the different dimensions of engagement. This will allow us to have a comprehensive understanding of the concept.
In addition, there is no valid definition today, especially in the advertising area. In this study, we contribute to the field by defining engagement as specific to the field of advertising. Because we are aware that engagement has different meanings in different fields.
3. Dimensions of engagement
The fact that engagement consists of cognitive, emotional, and behavioral dimensions indicates that consumers can become engaged cognitively, emotionally, and behaviorally (Akarsu & Sever, 2019). Also, cognitive, emotional, or behavioral engagement towards an advertisement occur at different levels (Gavilanes et al., 2018). For example, brand name awareness corresponds to a low level of cognitive engagement (IAB, 2014). Absorption or losing track of time (Dwivedi, 2015) corresponds to a high level of cognitive engagement. This perspective suggests that AE can be at a low or a high level. Shallow (low level of engagement) and profound (high level of engagement) are two levels of AE that differ according to the individual’s mental effort towards advertisements (Yoon et al., 2018). Therefore, the higher the cognitive effort towards advertisements, or the more they occupy an individual’s mind, the higher the level of AE. Such a situation also applies to other dimensions of the engagement.
Usluel and Vural (2009) explain that cognitive engagement is a situation in which the individual does not realize how time passes and directs her/his full attention to what he/she is doing. In this respect, a person’s full attention to advertising or an advertising message indicates that the person is cognitively engaged.
Fredricks, Blumenfeld and Paris (2004) briefly explain emotional engagement as emotional reactions. Therefore, individuals who engage emotionally toward advertisements are expected to create emotional reactions. Emotional reactions consist of various types of emotions, such as dedication (Dwivedi, 2015) and identification (Phillips & McQuarrie, 2010), as well as basic emotion types, such as curiosity, sadness, happiness, and so on. Emotional reactions, such as sadness, anger, and others, are not all positive. For this reason, it is not always positive for individuals to emotionally engage towards advertisements. This shows us that an individual’s ad engagement can move in a negative direction, and accordingly creates undesirable consequences for the brand. Negative behaviors such as boycotting the brand, negative e-wom are still a form of brand engagement because it involves both thinking about the brand and behaviors against the brand.
Behavioral engagement is briefly defined as repeated interactions in digital environments (Chaffey, 2007). These interactions correspond to behavior, such as clicking, commenting, or sharing a social media post (Islam & Rahman, 2016; Yoon et al., 2018). However, behavioral engagement is not just a phenomenon that takes place in digital environments. Behavior towards ads can vary between different media such digital, radio, and TV. For instance, while a viewer may talk to people around them about the TV ad they have just watched, in the digital environment this may be reflected in the form of sharing an ad they have seen on the internet. Therefore, engagement behaviors should not be limited to digital behaviors only.
These explanations show that the nature of engagement consists of cognitive, emotional, and behavioral responses, at a low or high engagement level. It is important to consider the three main reaction groups (cognition, emotion, behavior) when AE is defined. The following section includes brief information regarding AE definitions in the existing literature. Also, at the end of the following section, the authors’ definition of AE is presented.
4. Defining advertising engagement
Today, although AE is one of the most used concepts in online advertising, it is one of the least understood of concepts in advertising. For this reason, a number of authors emphasize different terms to explain AE. For example, Kim, Ahn, Kwon and Reid (2017) use the term ‘interlock’ to explain AE. They define engagement as an interlocking mental experience that consists of being immersed and present in a television advertisement.
Higgins and Scholar (2009) define engagement as a state of being involved, occupied, fully absorbed, or engrossed in something, sustained attention. In addition, Ziliak (2011) emphasizes the concepts of ‘creating a positive impression’ and ‘capturing and maintaining a viewer’s attention’. Accordingly, the importance of AE is whether the advertisement creates a positive impression and whether the advertisement sustains the audience’s attention. If an advertisement does not attract attention in the first moment of the broadcast, an individual’s engagement becomes more difficult. We propose that the process by which a person’s mind is occupied with an advertisement is actually AE. In this context, AE simply means people’s mental or behavioral occupation with an advertisement’s message or content. From this point of view, we define AE as follows.
AE is the process of occupying the mind of a person who is exposed to the ad stimulus cognitively (attention, awareness, recall, and so on) emotionally (liking, discomfort, and so on), and/or behaviorally (clicking, telling, sharing, and so on.) with the ad stimulus.
Based on the explanations on both engagement and AE, we suggest that engagement is a multidimensional construct, and should therefore be treated as a process. It also comes in different forms -high or low, and positive or negative. In particular, we believe that «occupying the mind» best defines the concept of AE because the fact that a person’s mind is occupied with the ad message means that she/he is thinking about the product/brand being advertised. The thinking will eventually lead to the generation of emotions. This process tells us that the person is being engaged with the ad both cognitively and emotionally. We can assume that the person has a high level of engagement with the ad if that she/he performs a behavior as a result of engaging with the ad both emotionally and cognitively.
The definition and other explanations above form the basis of the EA scale. In the following section, we review the EA scale development process and discuss the implications of this research.
5. Aim and methodology
The primary purpose of this study is to develop a valid and reliable measurement tool of an individual’s level of engagement to advertisement. We aim to develop a measurement which allows new studies to collect data related to consumer’s level of engagement towards advertisements. A valid and reliable measurement tool will help to resolve the ambiguities of AE by enabling diverse and empirical research studies.
The scale development is a multistage process that aims to ensure the validity and reliability of the scale. In order to develop a reliable and valid scaled we have followed these basic stages -creation of the item pool, the structuring of the scale, and the evaluation stages of the scale (DeVellis, 2017). Table 2 summarizes the development process of the EA scale outlined in this study and the operations performed within this process.
Table 2. EA Scale development process
Stages of scale development process |
Details |
Study 1 Item Generation, Expert Review, and Pilot Study |
Item Generation (N = 86) - Literature review, examination of existing scales - Focus group interview (n = 15) - Semi-structured interview (n = 5) - Text writing and 6 analysis (n = 66) Expert Review (N = 5) - Submitting 73 statements in the item pool for expert 6 opinion - Deciding to retain 49 items in the draft form as a 6 result of 6 the KGO calculation Pilot Study (N = 65) - Implementation of a pilot study to determine the intelligibility of 49 items. - After the pilot study, 2 items were determined to be problematic, and these 6 items were removed from the scale and a 47-item draft form was reached. |
Study 2 Item Purification |
Data Collection (N = 309) - Reaching a 2-factor and 30-item scale as a 6result of EFA |
Study 3 Scale Refinement, Confirmation, and Validation |
Data Collection (N = 408) Scale Refinement and Confirmation - Reducing the scale to 24 items and examining the goodness of fit with CFA Validation - Evaluation of Convergent Validity - Evaluation of Discriminant Validity - Evaluation of Similar Scales Validity |
Study 4 Scale Reliability Assessment |
Data Collection (N = 52) - Conducting test-retest reliability with data obtained from 52 participants - Evaluation of the general reliability of the scale 7 based on the data obtained in study 3 (N = 408) |
Final |
EA Scale with 24 items and 2 factors |
6. Study 1. Item generation, expert review, and pilot study
Study 1 encompasses item generation, expert review, and pilot study. In this stage, we used various data collection methods. In addition, we collected data face-to-face from undergraduate students over eighteen years of age and from academicians. Information regarding the methods and participants is clarified in the sections where the studies are explained.
6.1. Item generation
We used four methods in the process of creating an item pool. The first of these is the literature review and the examination of scales in different fields. Accordingly, basic concepts expressed as important indicators of engagement such as, ‘a feeling of being connected’ (Calder et al., 2009), ‘being caught’, and ‘identification’ (Schaufeli, Bakker & Van Rhenen, 2009) were put in the forms of expressions and added to the item pool. In addition, by examining the scales for engagement in different fields (e.g., Algesheimer et al., 2005; Dwivedi, 2015; Hollebeek et al., 2014; Sprott et al., 2009; Vivek et al., 2014) certain expressions were added to the item pool. The fact that the scales under examination were designed in different fields made it necessary to adapt the expressions added to the item pool to the advertising field.
The second method used in the item pool creation process is a focus group interview. A purposive sampling technique was used to determine focus group participants. Two focus group interviews were held in the study. The participants were composed of academicians working on engagement (n = 7) and undergraduate students who had shared at least one advertisement on the digital platform up to that point (n = 8). Focus group interviews were conducted face-to-face, with the average focus group interview being 45 minutes long.
The third method used in creating an item pool is a semi-structured interview. In this stage, a purposive sample technique was employed, and semi-structured interviews were conducted with 5 academicians who were working on EA and experts in the field. Semi-structured interviews were conducted one-on-one and with the average interview lasting 37 minutes.
The last method used in the creation of the item pool was to get the participants (N = 66) to write AE-related texts and get the researchers to analyze these texts. The lack of a full consensus on AE led researchers to consider this structure from different perspectives. Accordingly, 66 undergraduate students, who had shared at least one advertisement on a digital platform, were asked to write a text explaining why they engaged with those ads. After this, the researchers analyzed these texts and added the common statements to the item pool. By analyzing all of the data obtained, the process of creating an item pool was completed, and a pool of 73 items was reached.
6.2. Expert review and pilot study
In the process of structuring the scale, the opinions of five academicians, who are experts in the field and working on engagement, were primarily used. After the feedback from the experts, the KGO value of 73 items was calculated. In studies involving 5 experts, the minimum values (KGO > .99) suggested by Veneziano and Hooper (1997) were used to decide which values were acceptable. As a result, it was determined that 49 items in the item pool had sufficient value.
After the determination of 49 items, a pilot study was carried out to test the intelligibility of these items (N = 65). Based on the face-to-face feedback received after the pilot study, it was decided to exclude two items from the scale, and a draft form with 47 items was reached.
After reaching the draft form with the pilot study, the study continued by collecting data from different samples with the convenience sampling technique. We aimed to ensure diversity among participants by reaching people with different demographic characteristics. Details of the demographic information of participants in study 2, study 3, and study 4 are shown in Table 3.
Table 3. Descriptive statistical results on participants in all studies
|
Study 2 (N=309) |
Study 3 (N=408) |
Study 4 (N=52) |
||||
Demographic information |
f |
% |
f |
% |
f |
% |
|
Sex |
Male |
133 |
43 |
160 |
39,2 |
19 |
36,5 |
Female |
176 |
57 |
248 |
60,8 |
33 |
63,5 |
|
Age |
18-25 |
27 |
8,7 |
131 |
32,1 |
14 |
26,9 |
26-40 |
167 |
54 |
210 |
51,5 |
27 |
51,9 |
|
41-60 |
98 |
31,7 |
58 |
14,2 |
7 |
13,5 |
|
61+ |
17 |
5,5 |
9 |
2,2 |
4 |
7,7 |
|
Education |
Primary school |
5 |
1,6 |
1 |
0,2 |
0 |
0 |
High school |
57 |
18,4 |
50 |
12,3 |
7 |
13,5 |
|
Two-year degree |
30 |
9,7 |
66 |
16,2 |
5 |
9,6 |
|
Graduate |
159 |
51,5 |
211 |
51,7 |
26 |
50,0 |
|
Postgraduate |
58 |
18,8 |
80 |
19,6 |
14 |
26,9 |
|
7. Study 2. Item purification
7.1. Data
After the pilot study, the 47-item draft scale was delivered to 331 participants for the Exploratory Factor Analysis (EFA). The number of participants suggested in the literature was considered when conducting the factor analysis, and the number of participants was determined to be at least 300 (Tabachnick & Fidell, 2013). The items on the scale were listed and mixed in order not to influence the participant’s decision, and each item was measured on a 5-point Likert scale.
Based on the data obtained, a missing data analysis was performed, and it was determined that there was no missing data. Following this, the Mahalanobis distance (MD) value was looked at to determine the outliers. 22 participants with a value above 82.01 were excluded from the study. Finally, the EFA was performed based on the data of 309 participants. (Details of the demographic information of participants are shown in Table 3).
7.2. EFA data analysis and findings
IBM SPSS 26 and Jamovi programs that perform transactions over the ‘lavaan’ package were used to determine the factor structure of the EA scale, and to purify the items in the scale. Based on collected data, the correlation matrix was analyzed first, and it was found that these values were above .30 and that there was no problem. When the skewness and kurtosis values of the data were examined, it was seen that these values were between +2 and -2, which was sufficient for a normal distribution (George & Mallery, 2016). Furthermore, by looking at the KMO (.977) and Barlett's Sphericity Test chi-square value (χ2 = 6143,689, p < .005), it was determined that the research set was large enough for factor analysis.
After determining the conformity of the data to the EFA, the first EFA (Maximum Likelihood factoring with Promax rotation) was performed to determine the number of factors and items. With repeated processes, items with a lower value than a .30 factor load, overlapping factors, factors with a lower value than the factor loads provided by the parallel analysis, and factors with insufficient reliability coefficients (.70 and below), were removed from the scale.
As a result of the last factor analysis, a 2-factor structure with 30 items, eigenvalues above 1, and explaining 70,339 % of the total variance were revealed. Based on the items, the first factor was named ‘Behavioral Intention (BI)’, the second factor was named ‘Mental Processing (MP)’. The discovery of the 2-factor structure as a result of EFA can be considered as evidence of the multidimensional structure of advertising engagement. As mentioned in the literature, the Behavioral Intention factor is equivalent to the behavioral dimension of the engagement. However, such scales measure the behavioral intention rather than the behavior itself. It is interesting to note that the items corresponding to the cognitive and emotional dimensions are grouped under one factor. This tells us that the participants did not consider the expressions of cognition and emotion independent of each other.
Peter and Olson (2010) state that there is a relationship between emotional and cognitive systems, and it is not the right approach to consider them independently of each other. Therefore, people's cognitive responses can affect the emotional responses of the same people or vice versa. From this point of view, it can be said that the number of factors reached as a result of the EFA supports this view. Therefore, when evaluating advertisement engagement, the cognitive and emotional dimensions should not be considered independently.
In addition, in the scale, it was seen that the highest factor load was 1.038 and the lowest factor load was .574 and that these values had loads that were stated as strong factor loads (Pallant, 2005). It was found that the scale and its items were sufficiently reliable (α = .978). The structuring of the scale was completed with these results. The next step was the testing of the validity and reliability of the EA scale.
8. Study 3. Scale refinement, confirmation and validation
8.1. Data
As in the Study 2, the number of participants suggested in the literature was taken into account when conducting the Confirmatory Factor Analysis (CFA) in the Study 3. The 30-item scale obtained as a result of the EFA was delivered to 421 participants for the CFA and validity assessment. Firstly, the Mahalanobis distance (MD) value was looked at to determine the outliers. Thirteen participants with a value above 76.57 were excluded from the study. After this, the CFA was performed based on the data of 408 participants (Details of the demographic information of participants are shown in Table 3).
8.2. CFA data analysis and findings
IBM SPSS 26, IBM SPSS Amos 24, and JASP and Jamovi programs were used for the analyses in study 3. In the first CFA performed, it was seen that certain items on the scale did not fit well within the scale. For this reason, items that did not fit well were removed from the scale and the table of correction indices was examined, with error covariance being performed among the required items. (Figure 1 shows the results for the CFA model).
Figure 1. Path diagram for the EA scale
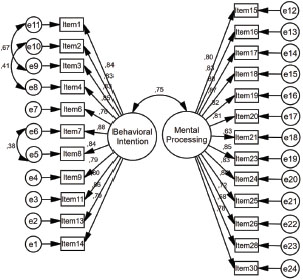
As a result of these analyses, 11 items were assigned to the Behavioral Intention factor, while 13 items were assigned to the Mental Processing factor, and ideal results were obtained for other values except the GFI value (x2/df = 3,80; CFI = 0.93; TLI = 0.92; NNFI = 0.92; IFI = 0.90; RMSEA = 0.08; SRMR = 0.06; GFI = 0.83). Based on the fact that the GFI value is affected by the sample size (Bollen, 1990) and the value it has (.83), it was thought that it would not harm the model.
Also, as a result of the calculations, it was determined that the standardized factor loads of the items varied between .63 and .88, that all items were in a significant (p < .001) relationship with the overall scale, the R2 values of the scale items varied between .397 and .779, and that the items had strong values. (Pallant, 2005). (Table 4 shows the general findings regarding the EA scale). All of these values indicate that the items have a high effect size and provide evidence of convergence validity. Following these findings, the next step is to evaluate the convergent and discriminant validity of the scale.
Table 4. Scale items, descriptive statistics, and s. factor loadings of the EA scale
Factor and Items |
X̄ |
SD |
s. Factor Load |
Factor Load |
Sh |
z-value |
p |
Behavioral Intentions |
|||||||
1. I share the content published in digital media related to the ad I watched. |
2,66 |
1,169 |
0,88 |
0,977 |
0,047 |
20,702 |
< .001 |
2. I write a comment about the ad I watched. |
2,73 |
1,192 |
0,86 |
0,983 |
0,049 |
20,249 |
< .001 |
3. I write comments on the content published in digital media related to the ad I watched. |
2,63 |
1,146 |
0,87 |
0,950 |
0,047 |
20,398 |
< .001 |
4. I click the share button for the ad I watched. |
2,87 |
1,220 |
0,87 |
1,038 |
0,049 |
21,272 |
< .001 |
5. The ad I watched prompted me to look for additional information about the product/service or brand in the ad. |
2,94 |
1,171 |
0,76 |
0,895 |
0,049 |
18,084 |
< .001 |
6. I like the content published in digital media related to the ad I watched. |
3,12 |
1,142 |
0,88 |
1,006 |
0,045 |
22,547 |
< .001 |
7. I click on the content published in digital media related to the ad I watched. |
3,16 |
1,123 |
0,84 |
0,943 |
0,045 |
20,824 |
< .001 |
8. I tell others about the ad I watched. |
3,21 |
1,186 |
0,77 |
0,935 |
0,049 |
18,928 |
< .001 |
9. I defend the ad against those who criticize the ad I watched. |
3,01 |
1,160 |
0,78 |
0,931 |
0,048 |
19,436 |
< .001 |
10. I read/watch/listen to the content published in digital media related to the ad I watched. |
3,14 |
1,154 |
0,85 |
0,987 |
0,046 |
21,442 |
< .001 |
11. I click the like button for the ad I watched. |
3,47 |
1,183 |
0,77 |
0,935 |
0,049 |
19,010 |
< .001 |
Mental Processing |
|||||||
12. I liked the idea of the ad I watched. |
4,00 |
0,860 |
0,81 |
0,691 |
0,035 |
19,552 |
< .001 |
13. The ad I watched caught my attention. |
3,93 |
0,986 |
0,83 |
0,815 |
0,040 |
20,395 |
< .001 |
14. The idea of the ad I watched was smart. |
3,95 |
0,960 |
0,80 |
0,767 |
0,040 |
19,366 |
< .001 |
15. I found the ad I watched attractive. |
3,80 |
0,988 |
0,87 |
0,862 |
0,039 |
22,248 |
< .001 |
16. I liked the ad I watched. |
4,02 |
0,926 |
0,82 |
0,758 |
0,038 |
20,096 |
< .001 |
17. The content of the ad I watched made it attractive to me. |
3,65 |
1,052 |
0,81 |
0,847 |
0,043 |
19,581 |
< .001 |
18. I understood what was meant in the ad I watched. |
4,17 |
0,868 |
0,63 |
0,547 |
0,039 |
14,011 |
< .001 |
19. The ad I watched aroused interest in me. |
3,62 |
1,040 |
0,85 |
0,888 |
0,041 |
21,457 |
< .001 |
20.The ad I watched left a mark in my mind. |
3,70 |
1,036 |
0,83 |
0,863 |
0,042 |
20,640 |
< .001 |
21. The ad I watched made a positive impression on me. |
3,77 |
0,950 |
0,84 |
0,796 |
0,038 |
20,836 |
< .001 |
22. I was all ears while watching the ad. |
3,78 |
1,035 |
0,72 |
0,743 |
0,045 |
16,638 |
< .001 |
23.If I come across the ad, I watched somewhere else, I will immediately notice. |
3,99 |
0,939 |
0,68 |
0,639 |
0,041 |
15,487 |
< .001 |
24.I also felt the emotion in the ad I watched. |
3,59 |
1,089 |
0,78 |
0,847 |
0,045 |
18,626 |
< .001 |
8.3. Convergent and discriminant validity assessment
To determine the validity of the EA scale, the standardized factor loadings suggested by Hair et al., (2019) were examined, Average Variance Extract (AVE) values were calculated and the correlation values between similar scales were compared.
It has been determined that the standardized factor loadings of the items in the scale vary between .63 and .88, and that these values are sufficient for convergent validity (Hair, Black, Babin & Anderson, 2019). (See Table 4 for standardized factor loadings). As a result of the AVE calculation, it has been determined that the scale met the requirement that AVE values of the factors (AVEBIfactor = .65; AVEMPfactor = .60) should be above .50 (Hair et al., 2019), and that another piece of evidence is presented for convergent validity.
In a comparison of correlation values between similar scales within the study, a similar scale that measures AE, which is expected to have a positive relationship (Bang, Kim & Choi, 2018), and the advertisement avoidance intention scale that measures the opposite structure is expected to have a negative relationship (Van den Broeck, Poels & Walrave, 2018) and an irritation scale (Thota & Biswas, 2009), was used. The correlation values between the scales show a highly positive relationship (r = .821) between the EA scale and the similar scale, and a highly negative relationship (r =. -639) between the EA scale and the Avoidance Intention scale. Thus, these correlations provide evidence that the EA scale meets convergent validity.
Apart from the convergent validity, it was observed that the square of the correlation coefficient between the BI and the MP factors was .56, and that the AVE value of each factor was higher than this value (AVEBIfactor = 0,65 > 0,56; AVEMPfactor = 60 > 0,56). It was also determined that the EA scale provided discriminant validity. Demonstrating the validity of the EA scale means that the scale measures the construct of advertising engagement, in other words it measures what it purports to measure. Another essential feature of a measuring tool is its reliability. The next step in the study provides the results of the reliability test.
9. Study 4. Scale reliability assessment
9.1. Data, data analysis, and findings
To test the reliability of the scale, the test-retest method was primarily used, in which 52 participants were sufficient (Kartal & Barakçı, 2018). The test-retest was applied to the same participants twenty days after the first application (Peter, 1979). As a result of the correlation analysis made based on the data obtained, it was found that there was a high level of correlation between the test and the retest (r = .95, p < .01).
Apart from the test-retest, the reliability coefficients of the scale were also calculated based on the data obtained in study 3 (N = 408). As a result of the calculation, it was determined that the reliability values of the scale (α = .968; CR = .979) were at a good level (Hair et al., 2019; Nunnally & Bernstein, 1994). As a result of all of the analyses, it was revealed that the EA scale, which has a 24-item and 2-factor structure, is valid and reliable. Therefore, this study provides scholars with a scale for measuring the multidimensional structure of EA.
10. Discussion and conclusion
This study aims to develop a measurement tool of an individual’s level of engagement to advertisement. In accordance with this aim, we conceptualize advertising engagement and develop a 24-item scale called ‘Engagement Towards Advertisement’ (EA) Scale, which includes two factors: behavioral intention and mental processing. The reliability coefficients of the factors of the scale vary between .95 and .97, the standardized factor loads of the items of the scale vary between .63 and .88, and the AVE values vary between .60 and .65. Besides the x2/df value of the scale was found to be 3.80, CFI value was .93, TLI value was .92, NNFI value was .92, IFI value was .90, RMSEA value was 0.08 and SRMR value was 0.06. Overall, the results have shown that the EA scale is valid and reliable.
To reach this conclusion, this study first established the conceptual framework for engagement and attempted to explain the AE phenomenon. The scarcity of scientific studies on AE required the examination of different areas within the study. In particular, the conceptual definitions in Table 1, show that engagement is defined in different ways specific to the field. From this point of view, it can be said that engagement gains various meanings according to the field of study in which it is included, or that the meaning of the concept expands. In such cases, it is thought that evaluating the concept of engagement in the context of the field of study will reduce any semantic confusion. In this study, engagement has been addressed specifically in the field of advertising, and a measurement tool has been developed based on this.
Although there is no consensus on the meaning of engagement in the literature, there is a general belief that there are dimensions of cognition, emotion, and behavior within this structure (e.g., Bowden, 2009; Brodie et al., 2013; Vivek et al., 2012). However, when previous studies are examined, it can be seen that the focus is mainly on behavior (Achterberg et al., 2003; Jaakkola & Alexander, 2014; Resnick, 2001; Van Doorn et al., 2010; Verhoef et al., 2010). The advances in communication technologies and the easy observation of digital behavior with the algorithms developed by various social media platforms may have led to this situation. For this reason, engagement can generally be viewed as ‘repetitive interactions’ (Chaffey, 2007) or ‘digital behavior’ (Gavilanes et al., 2018). It may seem logical for various practitioners, such as digital media applicators to approach the concept in this way. This is because the important thing in professional business life is that a campaign or communication work becomes reportable with objective measurements. For this reason, behavior such as clicking, sharing, or writing comments can be important engagement indicators in reporting. However, although there is such a reality in the professional business world, it should not be overlooked that AE is a structure that has an intellectual and emotional depth beyond digital interaction. From this perspective, we also emphasized the other dimensions of the construct. In doing so, we aimed to determine the factors of the EA structure through a heuristic approach. We found out that AE includes two factors -Behavioral Intent and Mental Processing. The Behavioral Intent factor was not unexpected, but we found out that participants don’t evaluate their cognitive and emotional reactions differently. Therefore, we named the second factor as Mental Processing. After all, we claimed throughout the study that the concept that best expresses AE is the process of occupying the mind. The results of the analysis also confirmed our claim. As Peter and Olson (2010) stated there is a relationship between emotional and cognitive systems. Therefore, we should not independently evaluate the cognitive levels and emotional states of individuals when they with an ad.
Also, the medium where the advertisement is broadcast constitutes an important point in observing cognitive, emotional, or behavioral responses to advertising. While behavioral responses, such as clicking, sharing, or commenting on advertisements broadcast on digital channels, can be given instantly, this is not the case with conventional channels. At the same time, these responses to advertisements in the conventional media are different from digital behavior, such as explaining the advertisement to someone or following the advertisement’s direction. Observing such behavior appears to be a problem compared to digital media. Therefore, while the emphasis is placed on behavioral responses in digital media, cognitive or emotional responses of engagement are emphasized in conventional media (Akarsu & Sever, 2019). Such a situation allows for more specific AE definitions specific to the medium in which the advertisement is broadcast. For example, engaging in advertising in digital environments essentially corresponds to behavior such as clicking, sharing, writing comments, or preparing content (Islam & Rahman, 2016; Yoon et al., 2018), while engaging in advertising in conventional media corresponds to cognitive and/or emotional reactions, such as paying attention, being caught (Ziliak, 2011), noticing or liking. To develop a scale to measure the multidimensional construct of EA, we sought to define EA without media limitations. Accordingly, we defined EA as the process by which a person who is exposed to the ad stimulus, cognitively, emotionally, and/or behaviorally.
We think that there may be different definitions of engagement on the medium. In addition, we think more study is needed to define engagement in the advertising context. However, we argue that there is a need for various measurement tools that can measure AE. This is because measurement tools will contribute to the elimination of the ambiguities of AE by enabling different and empirical research studies. For this reason, we present the scale we have developed to researchers in the hope that it will be of use in conducting different studies.
11. Limitations and suggestions for future research
First of all, the expressions on the scale in this study were designed for advertising films. Different results may occur in studies performed in different types of advertisements, such as printed or radio advertisements. Therefore, adapting the EA scale to different media will contribute to the field. In addition to this, it is thought that studies that reveal the relationship between individuals' engagement in advertisements and the medium in which the advertisement is broadcast, and that includes comparisons between channels, will contribute significantly to the field.
There may be a relationship between advertising engagement and the media, and many other variables may be related to engagement in advertising. For example, advertising content, branding, or personal characteristics may have potential effects on AE. For this reason, various studies could be carried out to present the relationship/effect between variables. The studies that are likely to be conducted to determine the variables associated with AE will also contribute to the emergence of various model proposals for AE. We believe that there is a great need for studies that reveal the antecedents and consequences of EA. In this way, we believe that the structure of EA can be revealed.
12. Acknowledgements
Funding: This article is adapted from Haluk Akarsu’s doctoral dissertation. This doctoral thesis was supported by Scientific Research Projects of Anadolu University [project no: 1805E104]
13. Bibliography
Achterberg, W., Pot, A. M., Kerkstra, A., Ooms, M., Muller, M., & Ribbe, M. (2003). The effect of depression on social engagement in newly admitted Dutch nursing home residents. The Gerontologist, 43(2), 213–218. 10.1093/geront/43.2.213
Akarsu, H., & Sever, N. S. (2019). Ad Engagement Concept in Turkey: An assessment of the Academy and expert perspectives [Special issue]. Journal of Erciyes Communication, 1, 203–224. 10.17680/erciyesiletisim.484861
Algesheimer, R., Dholakia, U. M., & Andreas, H. (2005). The social influence of brand community: Evidence from European car clubs. Journal of Marketing, 69(3), 19–34. 10.1509/jmkg.69.3.19.66363
Bang, H., Kim, J., & Choi, D. (2018). Exploring the effects of ad-task relevance and ad salience on ad avoidance: The moderating role of internet use motivation. Computers in Human Behavior, 89, 70–78. 10.1016/j.chb.2018.07.020
Blockthrough. (2020). Growth of the blocked web. 2020 pagefair AdBlock report. Retrieved from https://f.hubspotusercontent10.net/hubfs/4682915/Adblock%20Reports/Blockthrough%20Report%202020.pdf
Bollen, K. A. (1990). Overall fit in covariance structure models: Two types of sample size effects. Psychological Bulletin, 107(2), 256–259. 10.1037/0033-2909.107.2.256
Bowden, J. L. H. (2009). The process of customer engagement: A conceptual framework. Journal of Marketing Theory and Practice, 17(1), 63–74. 10.2753/MTP1069-6679170105
Brodie, R. J., Hollebeek, L. D., Jurić, B., & Ilić, A. (2011). Customer engagement: Conceptual domain, fundamental propositions, and implications for research. Journal of Service Research, 14(3), 252–271. 10.1177/1094670511411703
Brodie, R. J., Ilic, A., Jurić, B., & Hollebeek, L. (2013). Consumer engagement in a virtual brand community: An exploratory analysis. Journal of Business Research, 66(1), 105–114. 10.1016/j.jbusres.2011.07.029
Calder, B. J., Malthouse, E. C., & Schaedel, U. (2009). An experimental study of the relationship between online engagement and advertising effectiveness. Journal of Interactive Marketing, 23(4), 321–331. 10.1016/j.intmar.2009.07.002
Chaffey, D. (2007, April 29). Customer engagement interview with Richard Sedley of cScape. Retrieved from https://www.smartinsights.com/customer-engagement/customer-engagement-strategy/customer-engagement-interview-with-richard-sedley-of-cscape/
DeVellis, R. F. (2017). Scale development: Theory and applications. (4th Edition). USA: SAGE Publications Inc.
Dwivedi, A. (2015). A higher-order model of consumer brand engagement and its impact on loyalty intentions. Journal of Retailing and Consumer Services, 24, 100–109. 10.1016/j.jretconser.2015.02.007
Fredricks, J.A., Blumenfeld, P.C. and Paris, A.H. (2004). School engagement: Potential of the concept, state of the evidence. Review of Educational Research, 74 (1), 59–109.
Gambetti, R. C., & Graffigna, G. (2010). The concept of engagement: A systematic analysis of the ongoing marketing debate. International Journal of Market Research, 52(6), 801–826. 10.2501/S147078531020166
Gavilanes, J. M., Flatten, T. C., & Brettel, M. (2018). Content strategies for digital consumer engagement in social networks: Why advertising is an antecedent of engagement. Journal of Advertising, 47(1), 4–23. 10.1080/00913367.2017.1405751
George, D., & Mallery, P. (2016). IBM SPSS statistics 23 step by step: A simple guide and reference. (14th ed.). New York: Routledge.
Hair J. F., Black W. C., Babin, B. G., & Anderson, R. E. (2019). Multivariate Data Analysis. (8th ed.). United Kingdom: Cengage Learning EMEA.
Havas Group (2017) Meaningful Brands Report. Retrieved from https://www.havasmedia.de/media/mb17_brochure_print_ready_final-min.pdf
Haven, B. (2007, August 8). Marketing’s new key metric: engagement. Retrieved from http://snproject.pbworks.com/f/NewMetric_Engagement.pdf
Heath, R. (2007). How do you predict advertising attention and engagement? [Working paper]. Retrieved from https://researchportal.bath.ac.uk/en/publications/how-do-we-predict-advertising-attention-and-engagement
Higgins, E. T., & Scholer, A. A. (2009). Engaging the consumer: The science and art of the value creation process. Journal of Consumer Psychology, 19(2), 100–114. 10.1016/j.jcps.2009.02.002
Hollebeek, L. D. (2011). Exploring customer brand engagement: Definition and themes. Journal of Strategic Marketing, 19(7), 555–573. 10.1080/0965254X.2011.599493
Hollebeek, L. D, Glynn, M. S., & Brodie, R. J. (2014). Consumer brand engagement in social media: Conceptualization, scale development and validation. Journal of Interactive Marketing, 28(2), 149–165. 10.1016/j.intmar.2013.12.002
IAB. (2014). Defining and measuring digital ad engagement in a cross-platform world. Retrieved from https://www.iab.com/wp-content/uploads/2015/05/Ad_Engagement_Spectrum2014_FINAL2-5-2014-EB.pdf
Islam, J. U., & Rahman, Z. (2016). Linking customer engagement to trust and word-of-mouth on Facebook brand communities: An empirical study. Journal of Internet Commerce, 15(1), 40–58. 10.1080/15332861.2015.1124008
Jaakkola, E., & Alexander, M. (2014). The role of customer engagement behavior in value co-creation: A service system perspective. Journal of Service Research, 17(3), 247–261. 10.1177/1094670514529187
Kartal, M. & Bardakçı, S. (2018). SPSS ve AMOS uygulamalı örneklerle güvenilirlik ve geçerlilik analizleri. [Reliability and validity analysis with SPSS and AMOS applied examples]. Ankara: Akademisyen Publisher.
Kim, J., Ahn, S. J., Kwon, E. S., & Reid, L. N. (2017). TV advertising engagement as a state of immersion and presence. Journal of Business Research, 76, 67–76. 10.1016/j.jbusres.2017.03.001
Magna. (2021). Global Advertising Market Reaches New Heights and Exceeds Pre-Covid Levels. Retrieved from https://magnaglobal.com/global-advertising-market-reaches-new-heights-and-exceeds-pre-covid-levels/
Nunnally, J. C., & Bernstein, I. H. (1994). Psychometric Theory. (3rd ed.). USA: McGRAW-Hill, Inc.
Pallant, J. (2005). SPSS Survival Manual: A step by step guide to data analysis using SPSS for Windows (Version 12). Sydney: Allen & Unwin.
Peter, J. P. (1979). Reliability: A review of psychometric basics and recent marketing practices. Journal of Marketing Research, 16(1), 6–17.
Peter J., & Olson, J. C. (2010). Consumer behavior & marketing strategy. (9th ed.) New York: McGraw-Hill Irwin, Inc.
Phillips, B. J., & McQuarrie, E. F. (2010). Narrative and persuasion in fashion advertising. Journal of Consumer Research, 37(3), 368–392. 10.1086/653087
Resnick, E. (2001). Defining engagement. Journal of International Affairs, 54(2), 551–566.
Schaufeli, W. B., Bakker, A. B., & van Rhenen, W. (2009). How changes in job demands and resources predict burnout, work engagement, and sickness absenteeism. Journal of Organizational Behavior, 30(7), 893–917. 10.1002/job.595
Sprott, D., Czellar, S., & Spangenberg, E. (2009). The importance of a general measure of brand engagement on market behavior: Development and validation of a scale. Journal of Marketing Research, 46(1), 92–104. 10.1509/jmkr.46.1.92
Tabachnick, B. G. and Fidell, L. S. (2013). Using multivariate statistics. (6th Edition). Boston: Pearson Education, Inc.
Thota, S. C., & Biswas, A. (2009). I want to buy the advertised product only! An examination of the effects of additional product offers on consumer irritation in a cross-promotion context. Journal of Advertising, 38(1), 123–136. 10.2753/JOA0091-3367380108
Usluel, Y. K., & Vural, F. K. (2009). Adaptation of cognitive absorption scale to Turkish. Ankara University Journal of Faculty of Edıcational Sciences, 42(2), 77–92.
Van den Broeck, E., Poels, K., & Walrave, M. (2018). An experimental study on the effect of ad placement, product involvement and motives on Facebook ad avoidance. Telematics and Informatics, 35(2), 470–479. 10.1016/j.tele.2018.01.006
Van Doorn, J., Lemon, K. N., Mittal, V., Nass, S., Pick, D., Pirner, P., & Verhoef, P.C. (2010). Customer engagement behavior: Theoretical foundations and research directions. Journal of Service Research, 13(3), 253–266. 10.1177/1094670510375599
Veneziano L, & Hooper, J. (1997). A method for quantifying content validity of health-related questionnaires. American Journal of Health Behavior, 21(1), 67–70.
Verhoef, P. C., Reinartz, W. J., & Krafft, M. (2010). Customer engagement as a new perspective in customer management. Journal of Service Research, 13(3), 247–252. 10.1177/1094670510375461
Vivek, S. D., Beatty, S. E., Dalela, V., & Morgan, R. M. (2014). A generalized multidimensional scale for measuring customer engagement. Journal of Marketing Theory and Practice, 22(4), 401–420. 10.2753/MTP1069-6679220404
Vivek, S. D., Beatty, S. E., & Morgan, R. M. (2012). Customer engagement: Exploring customer relationships beyond purchase. Journal of Marketing Theory and Practice, 20(2), 122–146. 10.2753/MTP1069-6679200201
Wang, A. (2006). Advertising engagement: A driver of message involvement on message effects. Journal of Advertising Research, 46(4), 355–368. 10.2501/S0021849906060429
Yoon, G., Li, C., Ji, Y., North, M., Hong, C., & Liu, J. (2018). Attracting comments: Digital engagement metrics on Facebook and financial performance. Journal of Advertising, 47(1), 24–37. 10.1080/00913367.2017.1405753
We Are Social, & Hootsuite. (2022). Digital 2022 Global Overview Report. Retrieved from https://www.hootsuite.com/resources/digital-trends
Ziliak, J. (2011). Advertising Engagement: Giving Creative Credit Where Credit is Due. In: ComScore. Retrieved from https://www.comscore.com/ita/Insights/Blog/Advertising-Engagement-Giving-Creative-Credit-Where-Credit-is-Due