
Regular Issue, Vol. 10 N. 2 (2021), 165-182
eISSN: 2255-2863
DOI: https://doi.org/10.14201/ADCAIJ2021102165182
|
ADCAIJ: Advances in Distributed Computing and Artificial Intelligence Journal
Regular Issue, Vol. 10 N. 2 (2021), 165-182 eISSN: 2255-2863 DOI: https://doi.org/10.14201/ADCAIJ2021102165182 |
Hybrid Measurement of the similarity value based on a Genetic Algorithm to improve prediction in a collaborative filtering recommendation system
Swaleha Zubaira, Muaadh Abdo Al Sabrib
a Associate Professor, Department of Computer Science, Aligarh Muslim University, Aligarh, India
b Research Scholar, Department of Computer Science, Aligarh Muslim University, Aligarh, India
Correspondence at: swalehaowais123@gmail.com, muaadhabdo2016@gmail.com
ABSTRACT
Recently, a recommendation system (RS) has been widely used in several disciplines, like education, economics, scientific researches and other related fields. Based on the user interface, preferences and constraints the personalized RS has been rated as the most effective method. Collaborative filtering (CF) is one of the primary applications that researchers use for the prediction of the accuracy rating and recommendation of objects. In this filtering method nearest neighbour is identified to a recommendation system. The existing similarity measures use only the co-rated items ratings while calculating the similarities between a pair of users or items. For example, the two standard methods used to measure similarities are cosine similarity (CS) and pearson correlation similarity (PCS). In the present study, we have proposed a model to improve the prediction accuracy of RS using the merge output of CS with PCS based on a Genetic Algorithm (GA). The results show superior features of GA and its ability to achieve more correct predictions as compared to both CS and PCS when used alone.
KEYWORDS
Recommendation System, Collaborative Filtering, Similarity Measurement, Accuracy Prediction, Genetic Algorithm
1. Introduction
Due to the popularity of modern web-based applications and increased online purchasing, recommendation systems play a crucial role in the rating of implied platforms (YouTube, Netflix, and Amazon). A recommendation system is a software tool and method which collect information from users' like for a set of objects and predict the best-desired options. Recommendation System gathers preferences from users to develop a computational task that is either articulated directly, e.g., product ratings or inferred by analyzing user behaviour (Lerato et al., 2015). The Recommendation System (RS) can be categorized into several techniques like collaborative filtering RS, graph-based RS, content-based RS, demographic RS, knowledge-based RS, and hybrid RS (Lerato et al., 2015; Ricci et al., 2011).
Collaborative Filtering is a widely used approach that provides recommendations to the user. The NN Algorithm first attempts to regulate the k neighbourhood, it aggregates users based on their ratings and finally forecasts based on the aggregated information and is having a huge amount of popularity (Badriyah et al., 2018; Lerato et al., 2015).
The central assumption behind this approach is that if two users in the past shared the same preferences, in the future, they would also have similar tastes. There are two kinds of recommendation systems for collaborative filtering, i.e., the first is memory-based methods, and the second is model-based methods. Commonly, Memory-Based CF can be divided into two classes namely user-based CF and item-based CF. user-based CF is done in two steps; classify related users based on similar user choices and recommend new objects to an active user based on the rating provided by associated users on the items not rated by the active user. Item-based CF is designed in two steps; compute the item's similarity based on the preferences of the item and list the top similar items by the active user to the non-rated items and recommend those. Whereas, Model-based CF gathers different users in the training dataset into a small number of groups based on their rating patterns and trains a model for predicting new ratings to recommend those items to the user (Kilani et al., 2018; Mohanty et al., 2020; Kane, 2018).
The graph-based technique primarily focuses on graph construction. The graph can be created by a network of users that depends on different social networks. The developed graph represents items and users as nodes, while the correlation between items and users are considered for edging. A random thread or other related algorithms can be used to measure the similarity between items and users. In comparison with CF, CB uses only one or two types of sources (Işik, 2018; Alhijawi 2017).
On the other hand, content-based filtering, one of the most popular methods of recommendation, is based on similarities between contents of two recommedations regarding an item. It creates a user interest profile based on the user-rated objects (Badriyah et al., 2018). The profile represents user interest adopted to recommend new exciting objects. The recommendation process ultimately involves the matching of the user profile attributes against an object's attributes. The result is a judgement of relevance that reflects the user's level of interest in the specific object. The system can be used to filter search results by determining whether or not a user is interested in a particular web page. It also prevents it from being displayed in the negative case. The method can benefit independent users as in these the active user ratings are used to create their profile that can also suggest new items that have not yet been rated by any other user. Recommenders based on content have no approach inherent in discovering anything unexpected. (Kane, 2018; Badriyah et al., 2018; Lerato et al., 2015; Gao and Li, 2008).
An amalgamation of both collaborative and content-based filtering techniques can be used to generate recommendations in the hybrid approach. Both the methods complement each other makes the recommendation systems more effective in comparison to the other existing recommendation methods. (Walek and Fojtik, 2020, Zubair et al., 2019).
The demographic recommendation system can be designed to categorize the user on the basis of their characteristic features. For example, Grundy recommendation system (Rich, 1979) recommends books based on the basis of personal information collected through interactive dialogues. Demographic Methods, like collaborative models, target ' user-to-user correlations, while using different information individually. This system may not need a history of user ratings of the type required by Content-Based and Collaborative Methods (Pandey and Rajpoot, 2016; Lerato et al., 2015).
Knowledge-Based recommendation classifies items based on inferences about a user's interests and preferences. It could describe all recommendation methods as doing some kind of inference. Knowledge-Based
Methods are characterized in that they have functional expertise: to distinguish how a particular user meets a specific item need, and can, therefore, clarify the relationship between a need and a recommendation. The user profile can be any knowledge construction that supports the inference. (Subbotin et al., 2018; Lerato et al., 2015; Gao and Li, 2008).
2. Related Work
A recommendation system is a tool through which designers predict consumer's preferences in a huge list of suggested items. However, several services today give suggestions instantaneously, as they use Artificial Intelligence to evaluate user experiences and identify visually suitable items that attract every individual. AI not only can boast of rapid recommendation it also successfully adapt to the requirements and preferences of each customer. (Lerato et al., 2015; Alhijawi and Kilani, 2016; Duma and Twala, 2019).
The genetic algorithm most prominent and widely used for problem-solving belong to evolutionary computation. GA provides high-quality solutions for different problems such as searching, learning, and optimization by imitating the process of natural selection and reproduction. The GA consists of several techniques that have been used in evolution theory are the following principles: Genotype, population, Fitness function, Selection, Crossover, Mutation. (Wirsansky, 2020; Sheppard, 2017; Chambers, 2001).
The Genotype means the solution is represented by a chromosome representing a set of genes. For example, a chromosome can be represented as a binary string or decimal number and binary coded, where each bit represents a single gene.
The population is included a set of candidate solutions for the problem, which start represents the first generation and evolves overtime when the current generation is replaced by a new one. (Wirsansky, 2020; Sheppard, 2017; Chambers, 2001).
The fitness function is defined as a target function that seeks to choose the best solution at every iteration of the algorithm and be represented in the next generation. As well as, the quality of solutions is height, the fitness values increase, and the process can stop if that solution is satisfactory fitness value.
A selection process is used after measuring the fitness of each individual inside the population, it is used to decide which of the individuals in the population will take to reproduce based on the fitness score. (Wirsansky, 2020; Sheppard, 2017; Chambers, 2001).
The operation of crossover means from the current generation, we will select the best two parents to create a new generation applying interchanged (crossed over), or recombination.
The mutation method is particularly useful to add new value into the chromosomes, the main purpose to use it to refresh the population and encourage search in unknown areas of the solution space. (Wirsansky, 2020; Sheppard, 2017; Chambers, 2001).
GA can be used in different disciplines, for example, data science, machine learning, cognitive technology, mobile robot, etc. In the literature, there are many applications in the real world such as the Traveling Salesman Problem is one of the most popular math and computer science problems, it is never guaranteed that the solution given is the highest, it's just near. But the GA has been efficiently used by several salesbased companies as it is time-saving and economical.
More recent evidence (Walker and Messom, 2002) shows, that genetic algorithms are used to build learning robots that act like human beings and perform tasks like making our food, washing, etc. (Walker and Messom, 2002).
Man, K. concluded that to make the design cycle process fast and economical, engineering design has focused heavily on computer modelling and simulation based on GA. (Man et al., 1996).
Protopopova and Kulik (2020) applied GA to create an intelligent information system for teaching a student to optimize tasks. where they provide that the GA is a simple and intuitive technology in solving applied problems. (Hariyadi et al., 2020)
In recent years there has been considered that the GA has been utilized with RS in three aspects: clustering, hybrid models and using the GA without expecting the extra information provided by the hybrid model (Alhijawi, 2017; Hassan and Hamada, 2018).
There are two main modules; namely the explicit recommender and implicit recommender-based attributes. In the first module, the weight of a learner's implicit or latent attributes is considered in a manner such as in the genetic algorithm as chromosomes. Then the algorithm optimizes the weights according to historical ranking. The generated recommendation is then generated to optimize the weight vector's implicit attributes that represent the opinion of learners by using the Nearest Neighbour Algorithm (NNA) (Radwan et al., 2008).
Recently, a genetic algorithm for efficient CF RS clustering to increase the output proposal's accuracy had been introduced. In this algorithm, a random population was generated at the beginning that was improved at each iteration with the help of GA. (Mohammadpour et al., 2019).
Subsequently, a genetic-based matrix-factorization RS to make recommendations for the active user. The researchers are developing a new genetic-based CF RS, which hybridizes the neighbour and latent factor models to forecast items for the active user. The researchers concluded that the users and items are connected as a whole (Kilani et al., 2018).
Another group of researchers proposed a new model on the related semantics by which the characteristics of a recommended product can be defined to characterize the relationship process. Here also, the weight of the related attribute was acquired through Genetic Algorithms (Fong et al., 2008).
The low accuracy of recommendation has remained a common problem in the CF method. Then to solve this problem, they combined both association rule mining techniques based on CF for discovering the similarity of users and items, GA to evaluate the performance of association rules (Neysiani, et al., 2019).
SimGen does not use any traditional similarity functions such as Pearson Correlation and Cosine-based similarity between vectors. It produces an initial random value of similarity between every two users based on the GA. The anticipated method trains the data to calculate the fitness in each generation. It also helps in generating the test data to check the similarity from the. prediction errors (Alhijawi, 2017).
3. Proposed Method
In the proposed method, the users prefer a system that delivers more accurate predictions and helps in the generation of algorithms that yields better predictive accuracy. The proposed collaborative filtering technique involves two strategies that help in the prediction of item rating for an active user. The first strategy is to find the nearest neighbour to a recommendation system (a rank-based measure focusing only on selected top-N items), The second stage involves prediction rating (Predicting the user's rating of nonrated items). Therefore, the proposed hybrid method involving CS, PCS based on GA to overcome existing similarity problems. The outline of the proposed model involves five main phases as shown in figure 1.
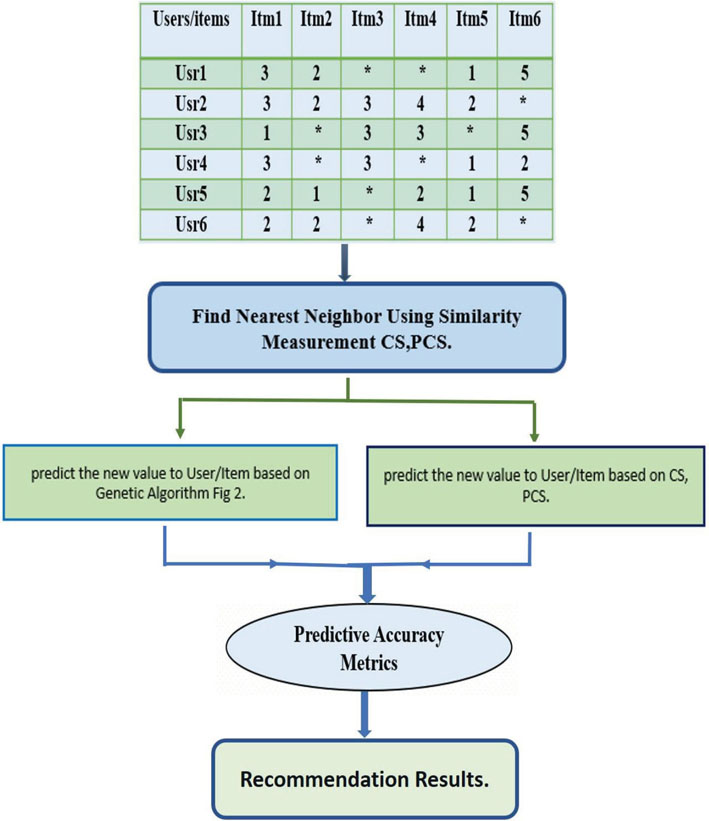
Figure 1: Proposed Model
3.1. Phase 1: Data Collection
The first step in the generation of a recommendation system involves collection of the relevant data. The contents of the data generally deals with the attributes of the specific items and also about the intertest of the users about specific items of the interest. Several techniques have been exploited to garner data pertaining to specific attributes of the items on one hand and interest of the users on the other. Usually, two kinds of feedback informationis sought by the users in an specifc system: explicit (ratings or likes) and implicit (activity documented by monitoring the user). A user can give explicit feedback in the form of a specific notations like number of stars, smileys, hats, or any other symbol illustrating how much the user prefers a product. Usually, the range is between 1 and 5. In this study we have used a ready explicit dataset to be represented (user-item matrix). (Isinkaye et al., 2015).
3.2. Phase 2: Find Nearest Neighbour
The quantity of nearest neighbours to be selected and the parameters used for this choice can also significantly impact the performance of the recommender system. The neighbours objects are usually selected in two steps: a global filtering phase in which only the candidates most likely are saved, and a predictive step that selects the best candidates for this forecast (Lerato et al., 2015; Badriyah et al., 2018; Kilani et al., 2018; Pandey and Rajpoot, 2016).
Neighbours in the predictions is a list of filter neighbours for each user or object. It is performed with the k-nearest-neighbours. i.e., the k neighbours whose weight similarity is of the highest magnitude. (Bobadilla et al., 2011)
The first step in this process is to determine the neighbours of the active user by using correlation coefficient metrics to provide the most accurate recommendation, for instance:
3.2.1. Pearson Correlation Similarity
It is a popular measurement used only to determine the correlation between users and objects, with each result showing a value between + 1 to -1. Where + 1 is a strong positive correlation, and -1 is a negative correlation, 0 indicates no relationship and is therefore often referred to as a zero-order correlation. Hence, the following formula is used
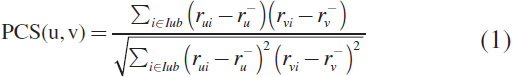
where u is the user u , v is the user v , Iuv is the list of items rated by users u and v , rui is the rating of u on item i , rvi is the rating of v on item i , <equation> is the average of the rating provided by user u , <equation> is the average of the rating provided by user v .
The critical limitation of this method is that it does not consider the personal effect of web services on similarity measurements. It doesn't also give an exact result if a particular user has scored only one parameter or if the same users have a similar score (Lerato et al., 2015; Alhijawi, 2017; Zubair et al., 2019).
3.2.2. Cosine Similarity
Cosine Similarity is most commonly used in CF to calculate the distance between two-dimensional angles using cosine angle, here we show user1 for the first dimension and user2 for the second dimension. The CS equation is:
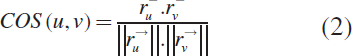
The main drawback of cosine similarity is that the difference in the ratings given to the items between the different users is not taken for the estimation. (Lerato et al., 2015; Zubair et al., 2019).
3.3. Phase 3: Deployment of a genetic algorithm
A genetic algorithm was introduced by John Holland in the early 1960s. It operates with the concept of fitness evaluation of a chromosome. (Jia et al., 2014; Gao and Li, 2008).
As mentioned already the main goal of the study was to improve CF performance by using GA. Through creating a new model that contributes to the enhancement similarity metric by merge the output of CS with PCS and adding new virtual user ratings to the rating matrix as shown in fig 2.
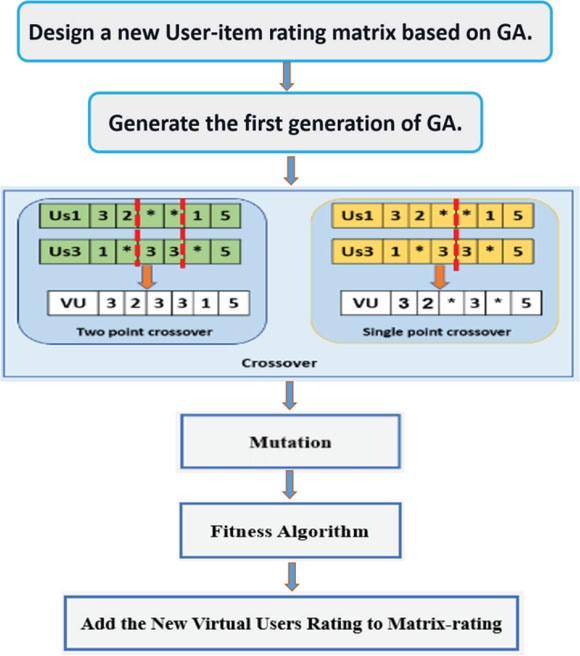
Figure 2: Deployment of a genetic algorithm
3.3.1 Initial population
The initialization process of the proposed model was straightforward. We built a chromosome population where every chromosome represents a gene set. We represented each user like chromosome as a collection of a gene(rating-value), and each gene represents a specific range [1 to 5]. The structure of the chromosome had been depicted in figure 3.
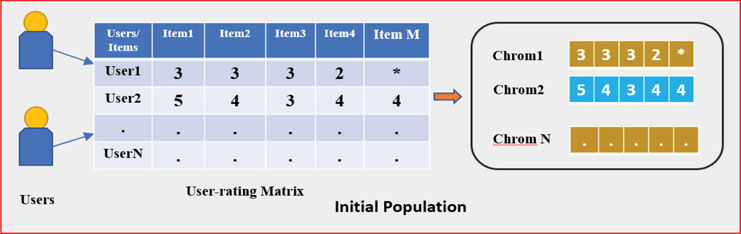
Figure 3: Initialation and Structure of Chromosome
3.3.2. Selection
Selection is the method of finding the best individuals formatting (First generation) so that the offspring are created better than the previous population.
3.3.3. Crossover
The crossover is a combination technique of the individual chromosomes that creates a new chromosome. The purpose of the crossover operation was to get the best solution. As figure 4 indicates, we selected a pair of individual chromosomes (Parents) for mating. The crossover involved a singlepoint and two-point sites that effectively connect the various segments with those on their corresponding chromosome.
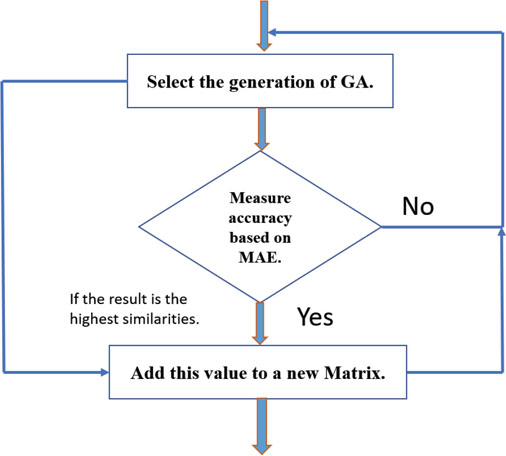
Figure 4: Fitness evaluation
3.3.4. Mutation
We used mutation as the operator in the as developed GA. It relates to the modification of the gene values of a solution with some probability. The changing in the gene of chromosomes gives different value. If the old chromosome doesn't possess the gene (rating value), they are reduced in the selection step. Then mutation seeks to recover missing data and also in exploring a range of data. We applied two steps in our proposed system.
First, checking for all the chromosomes if there any cell (gene) with no rating value. Second, fill this missing value randomly with values ranging from 1 to 5.
/* Find the non-rating items from list */;
Index Items=0;
For each item i e CHROM do
If i = * then
i = Generate_Randome_number (from 1 to 5);
i+=1;
end;
end;
3.3.5. Fitness evaluation
A genetic algorithm's fitness method was used to suggest the maximum similarities generated by the function. In the as developed genetic algorithm, the fitness function will be the Mean Absolute Error (MAE) as described in Eq (3).
3.3.6 Termination
The genetic algorithm ends when an individual has a fitness value below a constant value is M (best solution) in the population.
3.4 Phase 4: Predictive accuracy
Predictive accuracy metrics are essential for evaluating non-binary ratings and are suitable for situations where the precise prediction of all item ratings is of high importance. Two of the most popular metrics used to measure CF's accuracy are mean absolute error (MAE), and root means squared error (RMSE). (Lerato et al., 2015; Zubair et al., 2019).
3.4.1 Mean Absolute Error (MAE)
Mean absolute error calculates the average absolute deviation from the object's actual rating of the predicted product. It's just the difference
We summarize these errors in our test set across all N ratings and divide them by N to obtain the average or mean absolute error in the ratings. (Lerato et al., 2015; Zubair et al., 2019; Kim and Ahn, 2008). Let N be the set of items in the test set ri predicts a rating for the item i, ri̅ actual rating for item i.
3.4.2 Root Mean Square Error (RMSE)
It's a more popular metric for a few reasons, but one is penalized because you're far off more when you're predicting ratings, and you're less penalized when you're close.
Let N be the set of items in the test set ri predicts a rating for the item i, ri̅ actual rating for item i. (Lerato et al., 2015; Jalili et al., 2018; Zubair et al., 2019)
Some studies have discussed that these metrics do not measure the recommender's satisfaction of the users. In contrast, others have argued that the users' fulfilment may not be the ultimate goal in some cases to use a recommender.
3.5. Phase 5: Recommendation Results.
The last phase focuses on the nature of the specific outcome in terms of recommendations or predictions garnered about the specific object of interest. The recommendation can be proposed upon successful conclusion of the analysis.
4. Experiment
The experiments aim to improve the CF recommendation system. We applied four steps, including:
Table 1: 20 Users based on the Nearest Neighbor Algorithm
|
M1 |
M2 |
M3 |
M4 |
M5 |
M6 |
M7 |
M8 |
M9 |
M10 |
M11 |
M12 |
M13 |
M14 |
M15 |
M16 |
M17 |
M18 |
M19 |
M20 |
U1 |
4 |
2 |
1 |
|
5 |
1 |
2 |
|
4 |
4 |
3 |
1 |
|
5 |
1 |
1 |
2 |
2 |
4 |
3 |
U2 |
4 |
2 |
|
5 |
4 |
4 |
4 |
3 |
2 |
|
|
|
3 |
|
|
3 |
4 |
4 |
1 |
2 |
U3 |
2 |
3 |
3 |
2 |
2 |
5 |
5 |
3 |
|
2 |
3 |
2 |
2 |
1 |
4 |
|
2 |
2 |
3 |
3 |
U4 |
4 |
2 |
1 |
|
5 |
1 |
2 |
|
4 |
4 |
3 |
1 |
|
|
1 |
1 |
2 |
2 |
4 |
3 |
U5 |
4 |
2 |
1 |
|
5 |
1 |
2 |
|
4 |
4 |
3 |
1 |
|
5 |
1 |
1 |
2 |
2 |
4 |
|
U6 |
4 |
2 |
1 |
2 |
|
1 |
2 |
|
4 |
4 |
3 |
1 |
|
5 |
1 |
1 |
2 |
2 |
|
3 |
U7 |
4 |
2 |
1 |
|
5 |
1 |
2 |
|
4 |
4 |
3 |
1 |
|
5 |
1 |
1 |
2 |
2 |
4 |
3 |
U8 |
4 |
2 |
1 |
|
5 |
1 |
2 |
|
4 |
4 |
3 |
1 |
|
5 |
1 |
1 |
2 |
2 |
4 |
3 |
U9 |
4 |
1 |
5 |
1 |
4 |
|
|
5 |
|
1 |
|
2 |
1 |
2 |
|
5 |
4 |
|
1 |
2 |
U10 |
4 |
1 |
3 |
5 |
3 |
4 |
4 |
3 |
1 |
4 |
|
2 |
3 |
|
4 |
3 |
|
4 |
|
2 |
U11 |
5 |
2 |
|
5 |
4 |
2 |
4 |
3 |
1 |
|
5 |
|
3 |
4 |
|
1 |
4 |
2 |
1 |
2 |
U12 |
4 |
1 |
3 |
1 |
|
2 |
4 |
3 |
|
5 |
5 |
2 |
1 |
2 |
3 |
5 |
4 |
4 |
1 |
|
U13 |
5 |
2 |
|
5 |
5 |
2 |
2 |
|
1 |
2 |
5 |
|
3 |
4 |
|
1 |
4 |
2 |
2 |
2 |
U14 |
5 |
|
4 |
|
1 |
|
|
5 |
1 |
2 |
1 |
2 |
|
|
3 |
5 |
1 |
2 |
2 |
1 |
U15 |
4 |
|
3 |
|
4 |
|
4 |
3 |
|
|
5 |
|
|
2 |
|
|
4 |
|
1 |
2 |
U16 |
4 |
1 |
|
1 |
|
|
1 |
3 |
4 |
1 |
1 |
2 |
4 |
2 |
2 |
|
4 |
|
1 |
|
U17 |
1 |
1 |
5 |
5 |
4 |
|
4 |
|
2 |
3 |
2 |
2 |
3 |
1 |
5 |
3 |
2 |
5 |
2 |
1 |
U18 |
|
2 |
|
1 |
|
2 |
1 |
3 |
|
4 |
|
|
3 |
|
1 |
3 |
|
1 |
5 |
|
U19 |
1 |
5 |
1 |
4 |
1 |
|
|
1 |
5 |
1 |
|
2 |
1 |
5 |
4 |
|
1 |
|
5 |
2 |
U20 |
5 |
|
|
4 |
1 |
|
|
|
2 |
|
1 |
|
|
2 |
|
|
2 |
|
|
1 |
4.1. Step 1:
Find the nearest neighbor to the active user based on PC, CS that will be the first generation in GA, it can observe that from table one. To design the study using the data set provided in the Movie Lens, the data set mentioned in this paper was analyzed using Python libraries on the Spyder platform of the Anaconda Navigator.
We selected 20 terms based on the nearest neighbor algorithm as the experimental dataset, which contains 20 users and 20 movies from the rating dataset.
4.2. Step 2:
Predict the rating value of all users based on numerical measurement correlation, which finds how similar users or items; higher when value near to 1, as shown in table 2 and table 3.
Table 2: Result of Pearson Correlation Similarity Measurement.
|
U2 |
U3 |
U4 |
U5 |
U6 |
U7 |
U8 |
U9 |
U10 |
U11 |
U12 |
U13 |
U14 |
U15 |
U16 |
U17 |
U18 |
U19 |
U20 |
U1 |
-0.2433 |
-0.5644 |
1 |
1 |
1 |
1 |
1 |
-0.3238 |
-0.0988 |
-0.31142 |
-0.0028 |
-0.45999 |
-0.3794 |
-0.04355 |
-0.00996 |
-0.4155 |
-0.39551 |
-0.12684 |
-0.046 |
U2 |
|
-0.0942 |
-0.2433 |
-0.2346 |
-0.3122 |
-0.2433 |
-0.2433 |
-0.32858 |
-0.94295 |
-0.75338 |
-0.3497 |
-0.61278 |
-0.17858 |
-0.40195 |
-0.09425 |
-0.17858 |
-0.40195 |
-0.09425 |
-0.64131 |
U3 |
|
|
-0.4586 |
-0.5701 |
-0.5681 |
-0.5644 |
-0.5644 |
-0.15127 |
-0.10284 |
-0.3513 |
-0.03044 |
-0.5616 |
-0.26312 |
-0.0203 |
-0.2442 |
-0.29009 |
-0.1576 |
-0.1419 |
-0.2731 |
U4 |
|
|
|
1 |
1 |
1 |
1 |
-0.2816 |
-0.0998 |
0.23986 |
0.16168 |
0.40874 |
-0.3794 |
0.16757 |
0.03809 |
-0.3298 |
0.62218 |
-0.0342 |
-0.0158 |
U5 |
|
|
|
|
1 |
1 |
1 |
-0.3253 |
-0.0695 |
0.31875 |
-0.0028 |
0.46547 |
-0.3765 |
0.06385 |
0.00996 |
-0.4174 |
0.38857 |
0.12787 |
-0.0381 |
U6 |
|
|
|
|
|
1 |
1 |
-0.3552 |
-0.1236 |
0.30071 |
0.17949 |
0.28005 |
-0.2876 |
0.13746 |
0.14215 |
-0.5648 |
0.3133 |
0.16759 |
0.11974 |
U7 |
|
|
|
|
|
|
1 |
-0.3238 |
-0.0998 |
0.31142 |
-0.0028 |
0.45999 |
-0.3794 |
0.04355 |
0.00996 |
-0.4115 |
0.39551 |
0.12684 |
-0.046 |
U8 |
|
|
|
|
|
|
|
-0.3238 |
-0.0998 |
0.31142 |
-0.0028 |
0.45999 |
-0.3794 |
0.04355 |
0.00996 |
-0.4115 |
0.39551 |
0.12684 |
-0.046 |
U9 |
|
|
|
|
|
|
|
|
0.05132 |
0.09363 |
0.61394 |
0.18541 |
0.60487 |
0.63954 |
0.66494 |
0.22197 |
-0.0931 |
-0.5947 |
0.21084 |
U10 |
|
|
|
|
|
|
|
|
|
0.6355 |
0.29826 |
0.46307 |
0.42107 |
0.31247 |
-0.2042 |
0.6472 |
-0.0401 |
-0.3366 |
0.41552 |
U11 |
|
|
|
|
|
|
|
|
|
|
0.19217 |
0.90625 |
-0.0075 |
0.24495 |
-0.0676 |
0.11771 |
-0.1381 |
-0.4569 |
0.29604 |
U12 |
|
|
|
|
|
|
|
|
|
|
|
-0.035 |
0.02672 |
1 |
0.0619 |
0.08965 |
0.0903 |
-0.6285 |
0.34493 |
U13 |
|
|
|
|
|
|
|
|
|
|
|
|
-0.0796 |
0.06917 |
0.07563 |
0.03365 |
0.01911 |
-0.3727 |
0.03282 |
U14 |
|
|
|
|
|
|
|
|
|
|
|
|
|
0.0944 |
0.28173 |
0.17599 |
0.1656 |
-0.3026 |
0.5567 |
U15 |
|
|
|
|
|
|
|
|
|
|
|
|
|
|
0.0619 |
0.16273 |
0.0421 |
-0.6392 |
0.30327 |
U16 |
|
|
|
|
|
|
|
|
|
|
|
|
|
|
|
-0.1588 |
0.03863 |
-0.4229 |
-0.0313 |
U17 |
|
|
|
|
|
|
|
|
|
|
|
|
|
|
|
|
-0.5312 |
-0.1758 |
0.33878 |
U18 |
|
|
|
|
|
|
|
|
|
|
|
|
|
|
|
|
|
-0.3522 |
-0.0287 |
U19 |
|
|
|
|
|
|
|
|
|
|
|
|
|
|
|
|
|
|
-0.3815 |
Table 3: Result of Cosine Similarity Measurement.
|
U2 |
U3 |
U4 |
U5 |
U6 |
U7 |
U8 |
U9 |
U10 |
U11 |
U12 |
U13 |
U14 |
U15 |
U16 |
U17 |
U18 |
U19 |
U20 |
U1 |
0.0326 |
0.00694 |
1 |
0.33333 |
0.025 |
11 |
1 |
0.00417 |
0.00019 |
0.00556 |
0.00556 |
0.06667 |
0.01 |
0.00521 |
0.00278 |
0.06667 |
1.5E-05 |
0.02083 |
0.00195 |
U2 |
|
0.00347 |
0 |
0.00019 |
0.00046 |
0.00037 |
0.00037 |
0.00039 |
0.00029 |
0.05 |
6.9E-05 |
0.00833 |
4.34E-05 |
1.2E-05 |
0.00087 |
0.00028 |
0.00098 |
0.00013 |
0.00014 |
U3 |
|
|
0.00694 |
0.00231 |
0.00231 |
0.00694 |
0.00694 |
0.001 |
0.05556 |
0.00417 |
0.00667 |
0.00278 |
5.56E-05 |
0.0001 |
0.00139 |
0.00326 |
0.00231 |
0.002 |
3.9E-06 |
U4 |
|
|
|
0.06667 |
0.005 |
0.2 |
0.2 |
0.00208 |
0.00093 |
0.00139 |
0.00056 |
0.01667 |
0.05 |
0.0026 |
0.00139 |
0.06667 |
7.7E-05 |
0.00417 |
0.00098 |
U5 |
|
|
|
|
0.00833 |
0.33333 |
0.33333 |
0.00208 |
9.3E-05 |
0.00278 |
0.05 |
0.00167 |
0.01 |
0.0026 |
0.00833 |
0.06667 |
4.6E-05 |
0.01042 |
0.00195 |
U6 |
|
|
|
|
|
0.025 |
0.025 |
0.00104 |
0.00123 |
0.00069 |
0.08333 |
0.03333 |
0.0025 |
0.00065 |
0.01399 |
0.04167 |
7.7E-06 |
0.01667 |
0.03125 |
U7 |
|
|
|
|
|
|
1 |
0.00417 |
0.00019 |
0.00556 |
0.01667 |
0.06667 |
0.01 |
0.00521 |
0.00278 |
0.06667 |
1.5E-05 |
0.02083 |
0.00195 |
U8 |
|
|
|
|
|
|
|
0.00417 |
0.00019 |
0.00556 |
0.01667 |
0.06667 |
0.01 |
0.00521 |
0.00278 |
0.06667 |
1.5E-05 |
0.02083 |
0.00195 |
U9 |
|
|
|
|
|
|
|
|
0.00049 |
0.00125 |
0.00026 |
0.0005 |
0.083333 |
0.005 |
0.00042 |
0.0005 |
0.0002 |
0.01 |
0.002 |
U10 |
|
|
|
|
|
|
|
|
|
0.00013 |
0.00417 |
8.7E-05 |
0.002083 |
1.1E-05 |
0.00014 |
0.01042 |
0.00139 |
0.00021 |
1.5E-05 |
U11 |
|
|
|
|
|
|
|
|
|
|
0.00139 |
0.16667 |
2.17E-05 |
0.00278 |
0.00521 |
0.00111 |
7.8E-05 |
0.00156 |
0.00347 |
U12 |
|
|
|
|
|
|
|
|
|
|
|
0.00185 |
0.0625 |
0.0001 |
0.00208 |
0.02083 |
0.00104 |
0.00013 |
1.2E-05 |
U13 |
|
|
|
|
|
|
|
|
|
|
|
|
1.74E-05 |
0.00046 |
0.00139 |
0.01 |
8.3E-05 |
0.00313 |
0.00521 |
U14 |
|
|
|
|
|
|
|
|
|
|
|
|
|
0.00104 |
0.00313 |
0.00333 |
0.00208 |
0.001 |
2.6E-05 |
U15 |
|
|
|
|
|
|
|
|
|
|
|
|
|
|
0.00043 |
2.5E-05 |
1.8E-06 |
6.3E-05 |
0.00347 |
U16 |
|
|
|
|
|
|
|
|
|
|
|
|
|
|
|
0.00111 |
0.00065 |
0.5 |
0.01389 |
U17 |
|
|
|
|
|
|
|
|
|
|
|
|
|
|
|
|
0.00052 |
0.00833 |
1.9E-05 |
U18 |
|
|
|
|
|
|
|
|
|
|
|
|
|
|
|
|
|
0.00167 |
1.2E-05 |
U19 |
|
|
|
|
|
|
|
|
|
|
|
|
|
|
|
|
|
|
0.005 |
4.3. Step 3:
Through our proposed method, we determined the best nearest neighbour matching for the active user in each test set. It was based on calculating the similarity between each user and the user sets with the highest similarity values. Next, we developed a new virtual environment that was based on the results of the highest similar values to generate the first generation. The purpose of the study ought to met if the next item to be visited by the active user is the same as the recommended one.
4.4. Step 4:
Apply GA, is a set of parents (First generation) are chosen to produce a new matrix rating by applying crossover and mutation operators. Each produced child will be evaluated in terms of the measure CF's accuracies are MAE and RMSE. All children that have the highest correlation value will add to the new generations. Then, a new generation matrix will be transferred to the next generation which repeats these steps for a predefined number of generations, M. The best individual is selected to be the last predicted rating filtering value.
5. Results and Discussion
The data of the study suggest that a developed algorithm outperforms the traditional metrics in terms of quality, prediction accuracy, and performance etc. The proposed RS was capable of producing a recommendation that holds a great deal of promise in terms of recommendations. The findings of our proposed genetic algorithm were found to be distinguished from those obtained on collaborative filtering RS using traditional metrics: cosine Similarity, Pearson correlation Similarity. These specific metrics have been used to compare our genetic algorithm results with those derived from those metrics. The genetic algorithm had been widely used in the past as well, however, GA needs extra time because the first generation isn't usually the best. Every time the genetic algorithm runs, it provides a similarity to the fitness function, calculate the fitness value of each generation by using MAE and get the most suitable solution to estimate the prediction of specific user rated items for each user. As illustrated in figure 5 show us the MAE of CS, PC, Genetic Algorithm One-Point Crossover (GA OPC), Genetic Algorithm Tow-Point Crossover (GA TPC). Figure 5 (a) presents the outcomes obtained mean absolute error in cosine similarity reached its best value at U20=1.5 and worst at U7, U17= 4 while MAE reached its best value at 0.
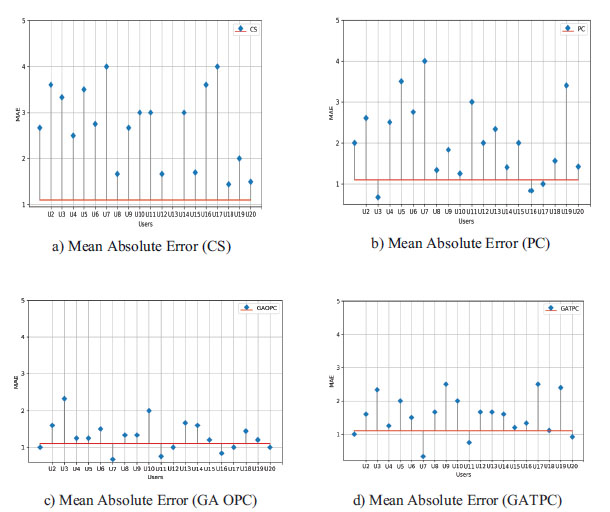
Fig 5: Display the results based on mean absolute error value between similarity measure (CS, PCS) and GA.
The alternate method employed in the present study was used to decide the execution of GA steps. This focused on the three-solution quality; the initial selected was Genetic Algorithm first Generation that is regarded as the recommendation list. We concluded that results in a negative outcome because the majority of MAE value was more prominent than one, for example, U3=2.5, U10=2 shown in the fig.6.a.
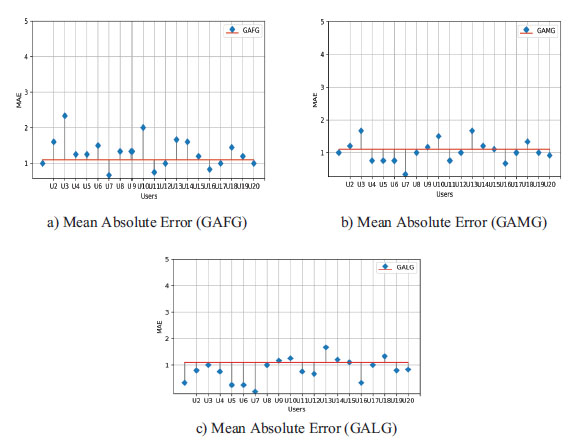
Fig 6: The result showing mean absolute error value between Genetic algorithm in three states: First-generation, Second-generation and Last-generation.
The results of the middle generation shown in the fig.6.b; however, it is better than all previous measures like the U3=1.7, U10=1.5. But the result is not good enough, and Fig. 6.c shows that last generation analysis relying on the new similarity measure's can explicitly overcome the disadvantages of the popular similarity measures.
In table 4, we compared the average, maximum and minimum values deduced from different models. The low average rating of MAE in a given recommended list indicates that the model prefers good recommendation. In other words, it suggests that the as-proposed model offers better improvement in the accuracy of recommendations.
Table 4: Summary of Similarity Measurement
Mean Absolute Error |
|||
|
Maximum |
Minimum |
Average |
COS |
4.000 |
1.444 |
2.783 |
PCS |
4.000 |
0.667 |
2.103 |
GAFG |
2.500 |
0.333 |
1.566 |
GAMG |
1.667 |
0.333 |
1.038 |
GALG |
1.667 |
0.000 |
0.824 |
6. Conclusion and Future work
In the present study, we have introduced a novel GA based hybrid model for the rating of objects. In the as-proposed RS model, we amalgamated the functions of both cosine and Pearson correlation similarity measures. We have found that the as-proposed GA model is better in performance and accuracy as compared to various existing similarity methods. We infer that the functioning of the as-proposed RS can be improved by including rating as recommended by the active users, rather than taking into account all users and diverse items.
Future research endeavours should rely on empowering the current techniques to improve the quality and relative accuracy of recommendations using a variety of assorted tools, such as Hadoop and Spark. We envisage that the employment of deep learning techniques may help in reducing the time spent in making recommendations. Further, we also endorse that the reliability as well as consistency of the predictions can be increased many folds by involving large-sized datasets in the study. Not on the positive side, the proposed model is not suitable for resolution of the cold start problem. Finally, we conclude that GA based hybrid model is suitable for making reliable and precise predictions.
7. References
Alhijawi, B. J. M. (2017). The Use of the Genetic Algorithms in the Recommender Systems (Doctoral dissertation, Hashemite University).
Alhijawi, B., & Kilani, Y. (2016, June). Using genetic algorithms for measuring the similarity values between users in collaborative filtering recommender systems. In 2016 IEEE/ACIS 15th International Conference on Computer and Information Science (ICIS) (pp. 1–6). IEEE.
Badriyah, T., Azvy, S., Yuwono, W., & Syarif, I. (2018, March). Recommendation system for property search using content-based filtering method. In 2018 International Conference on Information and Communications Technology (ICOIACT) (pp. 25–29). IEEE.
Bobadilla, J., Ortega, F., Hernando, A., & Alcalá, J. (2011). Improving collaborative filtering recommender system results and performance using genetic algorithms. Knowledge-based systems, 24(8), 1310–1316.
Chambers, L. (2001). The Practical Handbook of genetic algorithms Applications. Chapman & Hall. CRC Printed in the United States of America.
Duma, M., & Twala, B. (2019). Sparseness reduction in collaborative filtering using a nearest neighbour artificial immune system with genetic algorithms. Expert Systems with Applications, 132, 110–125.
Fong, S., Ho, Y., & Hang, Y. (2008, September). Using genetic algorithm for hybrid modes of collaborative filtering in online recommenders. In 2008 Eighth International Conference on Hybrid Intelligent Systems (pp. 174–179). IEEE.
Gao, L., & Li, C. (2008, October). Hybrid personalized recommended model based on genetic algorithm. In 2008 4th International Conference on Wireless Communications, Networking and Mobile Computing (pp. 1–4). IEEE.
Hariyadi, P. M., Nguyen, P. T., Iswanto, I., & Sudrajat, D. (2020). Traveling salesman problem solution using genetic algorithm. Journal of Critical Reviews, 7(1), 56–61.
Hassan, M., & Hamada, M. (2018). Genetic algorithm approaches for improving prediction accuracy of multi-criteria recommender systems. International Journal of Computational Intelligence Systems, 11(1), 146–162.
Işik, G. T. Z. (2018). A Hybrid Movie Recommendation System Using Graph-Based Approach. International Journal of Computing, 7(2), 29–37.
Isinkaye, F. O., Folajimi, Y. O., & Ojokoh, B. A. (2015). Recommendation systems: Principles, methods and evaluation. Egyptian Informatics Journal, 16(3), 261–273.
Jalili, M., Ahmadian, S., Izadi, M., Moradi, P., & Salehi, M. (2018). Evaluating collaborative filtering recommender algorithms: a survey. IEEE access, 6, 74003–74024.
Jia, Y. B., Ding, Q. Q., Liu, D. L., Zhang, J. F., & Zhang, Y. L. (2014). Collaborative filtering recommendation technology based on genetic algorithm. In applied mechanics and materials (Vol. 599, pp. 1446–1452). Trans Tech Publications Ltd.
Kane, F. (2018). Building Recommender Systems with Machine Learning and AI: Help people discover new products and content with deep learning, neural networks, and machine learning recommendations. Independently published.
Kilani, Y., Otoom, A. F., Alsarhan, A., & Almaayah, M. (2018). A genetic algorithms-based hybrid recommender system of matrix factorization and neighborhood-based techniques. Journal of Computational Science, 28, 78–93.
Kim, K. J., & Ahn, H. (2008). A recommender system using GA K-means clustering in an online shopping market. Expert systems with applications, 34(2), 1200–1209.
Lerato, M., Esan, O. A., Ebunoluwa, A. D., Ngwira, S. M., & Zuva, T. (2015, December). A survey of recommender system feedback techniques, comparison and evaluation metrics. In 2015 International Conference on Computing, Communication and Security (ICCCS) (pp. 1–4). IEEE.
Man, K. F., Tang, K. S., & Kwong, S. (1996). Genetic algorithms: concepts and applications [in engineering design]. IEEE transactions on Industrial Electronics, 43(5), 519–534.
Mohammadpour, T., Bidgoli, A. M., Enayatifar, R., & Javadi, H. H. S. (2019). Efficient clustering in collaborative filtering recommender system: Hybrid method based on genetic algorithm and gravitational emulation local search algorithm. Genomics, 111(6), 1902–1912.
Mohanty, S., Chatterjee, J., Jain, S., Elngar, A., & Gupta, P. (2020). Recommender System with Machine Learning and Artificial Intelligence. Wiley-Scrivener.
Neysiani, B. S., Soltani, N., Mofidi, R., & Nadimi-Shahraki, M. H. (2019). Improve performance of association rule-based collaborative filtering recommendation systems using genetic algorithm. Int. J. Inf Technol. Comput. Sci, 2, 48–55.
Pandey, A. K., & Rajpoot, D. S. (2016, December). Resolving cold start problem in recommendation system using demographic approach. In 2016 International Conference on Signal Processing and Communication (ICSC) (pp. 213–218). IEEE.
Protopopova, J., & Kulik, S. (2020). Educational Intelligent System Using Genetic Algorithm. Procedía Computer Science, 169, 168–172.
Radwan, A. A., Latef, B. A. A., Ali, A. M. A., & Sadek, O. A. (2008). Using genetic algorithm to improve information retrieval systems. World Academy of Science, Engineering and Technology, 17, 1021–1027.
Ricci, F., Rokach, L., & Shapira, B. (2011). Introduction to recommender systems handbook. In Recommender systems handbook (pp. 1–35). Springer, Boston, MA.
Rich, E. (1979). User modelling via stereotypes. Cognitive science, 3(4), 329-354.
Sheppard, C. (2017). Genetic algorithms with python. Smashwords Edition.
Subbotin, S., Gladkova, O., & Parkhomenko, A. (2018, September). Knowledge-based recommendation system for embedded systems platform-oriented design. In 2018 IEEE 13th International Scientific and Technical Conference on Computer Sciences and Information Technologies (CSIT) (Vol. 1, pp. 368–373). IEEE.
Walek, B., & Fojtik, V. (2020). A hybrid recommender system for recommending relevant movies using an expert system. Expert Systems with Applications, 158, 113–452.
Walker, M., & Messom, C. H. (2002, January). A comparison of genetic programming and genetic algorithms for auto-tuning mobile robot motion control. In Proceedings First IEEE International Workshop on Electronic Design, Test and Applications' 2002 (pp. 507–509). IEEE.
Wirsansky, E. (2020). Hands-On Genetic Algorithms with Python. Packt Publishing.
Zubair, S., Al Sabri, M., & Khan, A. (2019). Correlation Among Similarity Measurements for Collaborative Filtering Techniques: An Improved Similarity Metric.