ADCAIJ: Advances in Distributed Computing and Artificial Intelligence Journal
Regular Issue, Vol. 14 (2025), e32956
eISSN: 2255-2863
DOI: https://doi.org/10.14201/adcaij.32956
Integrating Gamification with Demand-Responsive Transportation: An Approach to User-Driven Optimisation
Pasqual Martía, Jaume Jordána, Bogdan Okreša Ðurić, Vicente Juliana,b, and Markus Schattenc
a Valencian Research Institute for Artificial Intelligence (VRAIN), Universitat Politècnica de València, Valencia, Spain
b Valencian Graduate School and Research Network of Artificial Intelligence, Universitat Politècnica de València, Valencia, Spain
c Artificial Intelligence Laboratory, University of Zagreb Faculty of Organization and Informatics, University of Zagreb, Zagreb, Croatia
✉ pasmargi@vrain.upv.es, jjordan@dsic.upv.es, dokresa@foi.unizg.hr, vjulian@upv.es, markus.schatten@foi.unizg.hr
ABSTRACT
The successful implementation of demand-responsive transportation services is often hindered due to difficulties associated with economic viability. With the aim of reducing service operational costs and environmental impact, this paper proposes an architecture that enables user-driven optimisation through the modification of their travel preferences. Specifically, the paper presents two modules which, integrated with a demand-responsive system, enable vehicle route optimisation, thus saving on costs derived from travelled kilometres and vehicle maintenance. On the one hand, the request modification module computes feasible modifications of the origin or destination stops in a customer travel request, changing them to neighbouring stops such that the transportation routes are simplified. On the other hand, a gamification module is implemented to motivate the customer’s acceptance of their request modification. Such a motivation is achieved by offering a personalised reward coupled with each modification, computed taking into account user preferences. Upon the acceptance of a modification, the user receives the reward, which may represent social or monetary benefits within the gamified demand-responsive service. The current research formalises both modules and tests their optimisation potential through the development of a case study in transportation scenarios with variable fleet sizes and demand intensities. The results indicate that the implementation of request modifications can save up to 5 % of a fleet’s operational costs if the right conditions are met. Moreover, when the flexibility of the request modification module is increased, savings may increase, however, at the cost of the customer’s preferred travel parameters. Thus, a balance between optimisation potential and user satisfaction must be sought.
KEYWORDS
demand-responsive transportation; gamification; optimisation; sustainability
1. Introduction
Demand-responsive transportation (DRT) is being investigated as an emerging paradigm to deliver personalised yet shared transport services. By offering flexible routes and stops, these systems adapt their operations according to user demand. DRT has demonstrated the potential to provide cost-efficient transport solutions, particularly in areas where conventional public transport services are impractical. However, the effective implementation of such systems is frequently challenging, as their economic sustainability is significantly affected by government subsidies and user engagement. Consequently, many operators deploy DRT services with constrained resources. This limitation often results in smaller vehicle fleets, which may diminish service quality and necessitate the rejection of certain travel requests due to the inability to accommodate them. A promising approach to mitigate this issue involves influencing user behaviour to encourage service usage patterns that reduce operational costs. In this context, we explore the application of gamification techniques.
Gamification is understood as the incorporation of game-like concepts, methods, and mechanisms into non-gaming environments. This approach has recently gained traction in diverse fields, where it has proven to be effective in improving user motivation, engagement, and interaction. Within the domain of mobility, gamification is typically employed to incentivise behavioural changes that yield benefits for users, service providers, or environmental sustainability. In the specific case of DRT, gamification is identified as a potential tool for promoting user demands that facilitate more cost-efficient service delivery.
DRT services are often hard to sustain economically. Their use is more demanding than traditional mass transportation options, although they are more tailored to users’ needs. Nevertheless, a user accustomed to classical transportation systems must go through an adaptation process, which, in many cases, impedes the transfer of clients to the new service. Gamification techniques have proven useful in motivating user interaction with the service itself. In addition, the employed techniques can influence a certain behaviour, boosting participation in an event or favouring more sustainable consciousness, for instance. In the scope of this paper, gamification is employed to complement an optimisation algorithm that requires the participation of the system customers. As a secondary objective, the application of gamification techniques can be expected to increase user loyalty and, in general, improve the economic profitability of the service.
Our research goal is the development of optimisation methods that reduce the operational costs of DRT systems with a twofold objective: ease the economic sustainability of the service and reduce its environmental impact. Specifically, in this paper, we propose the integration of gamification within a DRT service as a means of motivating customers to agree to service optimisation suggestions. In dynamic DRT, the routes of the vehicles are determined by customer demands. An improvement of these routes, consequently, may require the modification of customer demand. Our approach is composed of two subsystems or modules. On the one hand, a customer request modification module which, given the planned itineraries of a DRT fleet, calculates beneficial changes in the origin/destination stops selected by customers. These changes, if applied, simplify transport routes, thus reducing operational costs and bolstering sustainability. On the other hand, there is a gamification module, which keeps a profile of each customer and offers rewards upon the acceptance of request modifications, thus encouraging implementation. These modules, integrated within a DRT system, enable local, user-driven optimisation of its solutions (i.e. the vehicles’ routes), with users exchanging their preferred stops in favour of rewards and a faster service that reduces environmental pollution.
Considering current literature, the paper’s contributions to the state of the art are as follows:
- Practical implementation of a demand-responsive scheduling algorithm prepared to run experiments over real-world transportation scenarios.
- Novel proposal and formulation of user-driven optimisation for transportation systems through an incentivised modification of their travel preferences, validated through a case study.
- Gamification system formalisation for its integration in a transportation application.
- Demand-responsive transportation system architecture with integrated gamified module that facilitates the optimisation of vehicle routes, contributing to improved passenger times and to reduced environmental impact.
The rest of the paper is organised as follows: Section 2 comments on relevant literature within the realms of DRT’s implementation and gamification for transportation. Section 3 describes DRT, exemplifies our proposal and overviews the system architecture. Sections 4 and 5 formalise the problem and provide in-depth descriptions of the two parts of our optimisation approach: the request modification module and the gamification module, respectively. Section 6 illustrates the potential of our system to reduce operational costs through a simulation of a DRT service. Finally, Section 7 discusses the contributions of the paper and the limitations of the chosen techniques, presenting future lines of research.
This article is an extension of the research «Gamification system for improved demand-responsive transportation», presented at the 22nd International Conference on Practical Applications of Agents and Multiagent Systems (PAAMS 2024).
2. Related Work
Demand-responsive transportation (DRT) appeared during the last century as a means of transporting people with special needs and connecting isolated populations with medical services. Nowadays, thanks to the commodities of network and smartphone technologies, it is being explored as a means of providing user-tailored, yet shared, mobility. However, commercial ventures of DRT services are prone to failure (Enoch et al., 2006), so much so that the study of their economic viability has become a research field in its own right. In fact, current research points towards high operational costs and low customer acceptance as the main sources of failure (Currie and Fournier, 2020). Particularly, the adoption rate of the service is crucial for its success (Anburuvel et al., 2022); unfortunately, the operator’s service design is often misaligned with the expectations of potential users (Schasché et al., 2022), further impeding the creation of a wide customer base. Recent advances in IoT-based vision techniques are also contributing to improvements in transportation services and safety (Qader Kheder and Aree Ali, 2023).
DRT is studied within the fields of computing and artificial intelligence, aiming to optimise its design and operation. For that, both the desires of transportation providers (economic viability) and service customers (reliability, quality) must be integrated, also considering the environmental impact of the final system. Agent-base modelling, coupled with multi-agent systems, is often used to reproduce and evaluate DRT services against other transportation choices (Inturri et al., 2021; Calabrò et al., 2022). These systems allow to reproduce a specific working area and test various deployments over it. Recent research proves the adequacy of DRT for small-sized cities or areas with low transportation demand (Calabrò et al., 2023).
Another optimisation approach is to boost the dynamism of DRT services. For that, machine learning (ML) and data aggregation techniques are explored. Established transportation companies, such as Padam mobility, invest in ML-guided optimisation of their services, exploiting both traditional (Zigrand et al., 2021) and deep-learning techniques (Zigrand et al., 2023). Their work is focused on demand-prediction—a crucial part of a DRT system. Similar ML-based prediction approaches have been combined with multi-agent simulations to enhance public transportation services (Martí et al., 2024a). These techniques generally require quality data to train their models. Researchers employ data-mining techniques to improve operational efficiency (Alahmadi and Alzahrani, 2023), and data aggregation, including mobile data, to deploy tailored transportation services (Melo et al., 2024).
The explored DRT literature has been summarised in Table 1. From among the many options available for studying DRT optimisation, we employ a mathematical model of the service, coupled with heuristic algorithms that deal with demand scheduling in real time (Martí et al., 2024b). More specifically, the present research deals with reducing service operational costs. This process often requires service quality cuts that may come at the expense of losing customer trust. Because of that, we combine the proposal with gamification techniques.
Table 1. Demand-responsive research classification
Topic |
Key findings / techniques |
Research articles |
Demand-responsive economic viability |
High operational costs |
|
Low customer demand |
||
Design not aligned with customer’s expectations |
||
Demand-responsive optimisation |
Machine learning |
|
Agent-based strategies |
||
Heuristic algorithms |
||
Demand-responsive modelling |
Multi-agent simulation |
|
Mathematical |
Gamification can be defined as the application of game-related concepts to non-game contexts (Deterding et al., 2011; Matallaoui et al., 2017). The concepts mentioned in this definition can be classified based on different methods. However, the most prominent one is to divide them into four fundamental elements of game design: story, aesthetics, mechanics, and technology (Schell, 2019; Fullerton, 2024). Using the different elements of game design, gamification brings fun, entertainment, and pleasure to contexts outside of gaming. For the purposes of this paper, we focus on serious gamified systems, whose main goal is not fun but learning. This form of gamified system aims to increase user motivation, engagement, and retention rate.
Various gamified systems have been observed to be used in a number of application domains and with varied goals. While some application domains are more heavily researched and more common, such as education, other fields still lack research on the possible use and influence of gamified systems. To name a few specific examples, elements of gamification have been applied to telemedicine (Schatten et al., 2021), mobility following hospital discharge (Greysen et al., 2021), science education (Kalogiannakis et al., 2021), corporate training (Iacono et al., 2020), policymaking (Spanellis et al., 2023), improving user experience (Hsu and Chen, 2018), improving driver behaviour (Helvaci et al., 2018), eliciting eco-driving behaviour in drivers (Günther et al., 2020; Zinke-Wehlmann and Friedrich, 2019), and smart and sustainable mobility (Okreša Ðurić, 2022; Cardoso et al., 2019). Within the topic of on-demand mobility systems, the researches by König et al. (2019) and Drakoulis et al. (2018) were analysed.
Drakoulis et al. (2018) proposed a gamified demand-responsive public transport system to enhance user engagement and service efficiency. Their serious gaming framework aims to encourage correct system use and broader adoption, rewarding users for wanted behaviour through virtual and real-world incentives. The authors develop four game types where users’ progress depends on real-world transport decisions. This study shows that gamification increases engagement and fosters participation as intended, yet the long-term impact on users’ behaviour remains uncertain. The importance of well-designed reward structures is highlighted, and further research into scalable transport interventions based on serious games is suggested. König et al. (2019) investigate the use of a serious game to introduce mobility-on-demand systems (MODS) to prospective users. The authors developed B.u.S., a digital role-playing game where players act as transport planners, managing MODS to understand their flexibility and benefits. The study with high school students shows that the game improves knowledge retention and fosters a more favourable perception of MODS, especially regarding their usefulness for individuals and transportation companies. However, the game does not significantly impact actual patterns of use. The authors conclude that gamified approaches are effective for raising awareness and shaping attitudes but insufficient to drive behavioural adoption. They emphasize the need for real-world integration and long-term engagement in gamified transport solutions.
Gamification has been observed to increase users’ motivation to engage with the gamified system (Zeybek and Saygı, 2023; Dehghanzadeh et al., 2023; Ruiz-Navas et al., 2024). A stronger effect of this phenomenon has been observed in the context of personalising gamified systems. Building a system that follows the one-size- does-not-fit-all approach, therefore putting the user in the centre of the interaction, has been shown to have a positive influence on user motivation (Rodrigues et al., 2020). Various research reports present results of observations in the domains known as customised gamification or tailored gamification (Klock et al., 2020), adaptive gamification, and personalised gamification (Ertan Şevk and Arkün Kocadere, 2024). A common conclusion is that gamification adapted to the user can be used to increase the user’s motivation to engage with the gamified system. However, it does not warrant an increase in learning outcomes when the observed application domain is education or other similar behavioural changes in other domains (Xiao and Hew, 2024).
Several personalisation approaches have been published in recent literature. However, the two used most often (Phosanarack et al., 2025) are the Five Factor Model (FFM) or the Big Five Model of personality (McCrae and Costa Jr., 1989) and the Player Types model (Bartle, 1996). The former is a widely accepted framework for understanding human personality. It identifies five broad traits that are stable over the course of a person’s life and that shape individual differences: openness to experience (curiosity and creativity), conscientiousness (organization and dependability), extraversion (sociability and energy), agreeableness (compassion and cooperation), and neuroticism (emotional instability and anxiety). These traits, measured on a continuum, provide a comprehensive structure for analysing personality across cultures and contexts. The FFM has been extensively applied in psychology, workplace behaviour, and social sciences, demonstrating strong predictive validity for life outcomes such as job performance, relationships, and mental health. Each of the personality traits present in the FFM can be described in more nuances using a set of facets of traits (Cummings and Sanders, 2019). For example, the trait of extraversion can be described using the following set of facets, i.e. more specific descriptions of what a person is like: gregarious, warm, assertive, active, excitement-seeking, and positive emotionality.
The gamification state-of-the-art has been classified in Table 2, summarising their field of application, goals, and the implemented techniques. For the scope of this study, a selection of gamification techniques has been proposed by the authors in (Okreša Ðurić et al., 2023). In this paper, we develop a gamified system formalisation following the Big Five Model of personality, and discuss its integration with a DRT system. Such an integration aims to motivate user-driven optimisation of the service operation, thus receding operational costs. In addition, it has the added benefit of boosting user engagement significantly. By rewarding users for making travel choices that align with system optimization, gamification encourages behaviours that enhance system performance and sustainability. This concise approach harnesses the motivational power of game-like elements to promote a collaborative and efficient use of transportation resources. The following section will present our proposal in detail, outlining how this innovative approach can be implemented to achieve these benefits.
Table 2. Classification of cited gamification research according to field of application, research aim, and employed techniques
3. Methodology
In this paper we present an approach aimed at optimising the operation of dynamic demand-responsive transportation systems. Specifically, we aim to reduce operational costs while, as a by-product, we increase engagement and build customer loyalty. To do so, our approach complements the transportation system with a periodic local optimisation algorithm that finds modifications in customer’s origin/destination stops so that transport routes are shortened and thus less costly. To motivate users to accept such modifications, we integrate a gamification system, built over the demand-responsive service. Users are offered rewards for the modification of their trip. In turn, these rewards can be exchanged for social or monetary benefits within the gamification system. All in all, our approach motivates customers to accept minor inconveniences on their trips for the benefit of the service provider while being compensated with different types of rewards according to their preferences.
In the following subsections, we describe the basic notions underlying the functioning of the dynamic demand-responsive transportation service and the parameters of its solutions. Then, we illustrate how such solutions can be optimised through request modification supported by gamification strategies.
3.1. Dynamic Demand-responsive Services
In the present research, we build upon an established, fully-dynamic and demand-responsive system, such as the one presented by Martí et al. (2024b). This system offers transportation services between a series of stops, but does not feature predefined routes for vehicles to follow. Instead, the route of a vehicle is computed in real time, in accordance with the user demand at any given time. Thus, to compute solutions for a demand-responsive service, it is necessary to implement scheduling and routing algorithms that work together to swiftly compute the route of the fleet. In this paper, we assume such algorithms are already implemented and focus, instead, on optimising their solutions.
Figure 1 presents the architecture of the established DRT system. Each transportation problem instance is defined by a demand set R, containing customer travel requests, and a vehicle fleet V of a given number of homogeneous vehicles which will service the demand. The service planning module runs the necessary algorithms to match each customer requests to a fleet vehicle, building each vehicle’s route and schedule in the process. The solution set L comprises the itineraries of the fleet vehicles. Each itinerary is a list of the stops a vehicle will visit during the operation, ordered by time, and specifying the arrival and departure times for each stop. Each of the stops, in turn, corresponds to a pickup or drop-off of at least one customer whose request has been assigned to the vehicle.
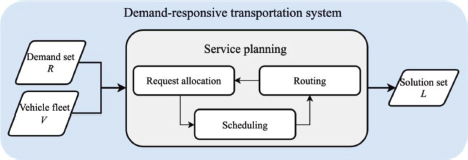
Figure 1. Architecture of the initial demand-responsive service
The assignment of a customer request to a vehicle is guided by a system-wide objective function and constrained by physical restrictions and minimum quality requirements. First, the objective function seeks to minimise the costs incurred from the operation. Regarding the constraints, on the one hand, a vehicle’s capacity limits the number of customers that can travel concurrently inside it. On the other, we define maximum waiting and travelling times associated with each customer requests. A request is assigned to a vehicle only if all restrictions are preserved both for the issuing customer and every other customer already assigned to the vehicle; otherwise, the request is rejected.
Instance solutions are evaluated in terms of service quality and operational costs. For the purposes of this research, service quality refers to the number of accepted requests relative to the total number of travel petitions. The percentage of rejected requests is also taken into account to assess the adequacy of a given fleet with a specific demand intensity. Operational costs indicate the costs derived from fleet operation while serving customers. These are related to vehicle usage and total travelled kilometres. Thus, for a transportation provider, the ideal solution is that which minimises travelled kilometres while accepting as many requests as possible. With this paper, we aim to improve the described demand-responsive solutions to further cut operational costs, with the added benefit of reducing its environmental impact.
3.2. Request Modification Through Gamification
The goal of our methodology is the reduction of the operational costs of demand-responsive fleets. The source of these costs is varied and usually difficult to accurately estimate. Direct operational costs of transportation services generally comprise the salaries of employees and the purchase and maintenance of vehicles. The scope of this research covers the operational costs arising from vehicle travelled distances. Travel causes vehicle wear, thus increasing the necessity of maintenance. In addition, longer distances also incur longer travel times, which in turn affects passenger experience as well as the overall efficiency of the service. By reducing the length of vehicle trips we also simplify vehicle itineraries, thus favouring the probability of new customers being serviced. Overall, a reduction in the travel distance brings the following benefits to a demand-responsive service:
3.2.1. Reduced vehicle wear
3.2.2. Shorter customer waiting and travel times
3.2.3. Increased idle time for vehicles, increasing the likelihood of scheduling new requests in real time
3.2.4. Lower environmental impact
As an ancillary benefit, optimised itineraries enhance the service’s sustainability. DRT is already a sustainable transportation option with respect to motorised individual vehicles and taxi-like services, when the appropriate conditions are met (Martí et al., 2025). However, further refinement of the vehicle routes contributes to shorter trips, more efficient operation, and thus lower environmental impact.
To achieve reduction in cost, our approach searches for feasible modifications to customer requests. These modifications involve exchanging the origin and/or destination stops originally specified by the customer in their travel petition. The goal of the exchange is to simplify vehicle itineraries. This may be accomplished by grouping demand at fewer stops or avoiding costly detours, for instance. This process leads to a direct reduction in the fleet’s travel costs and thus the system’s operational costs.
Figure 2 conveys an effective example of the simplification of vehicle routes through the implementation of request modifications. The first stage is shown in the image on the left, representing a series of transportation stops (yellow dots), each with a number written above it to indicate the number of requests that originate/end there. Blue arrows represent the planned route of the transport servicing these stops, with the cost of each segment shown as blue numbers inside brackets.
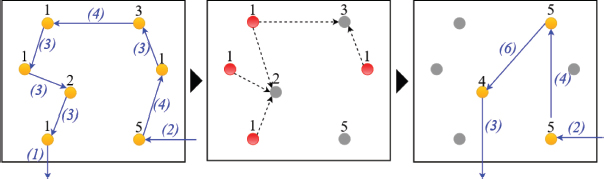
Figure 2. Example of travel cost reduction through modification of stop requests
The total cost of this route, thus, is of 23du (distance units). Considering this scenario, the system identifies requests for which stops may be changed to reduce the travel distance. As seen in the second image in Fig2., the selected stops are represented by red dots in the second stage, where the dashed arrows indicate the proposed modification of the customer’s request. Therefore, some of the customers are asked to change their desired origin or destination stop to a neighbouring one. For the sake of the example, we assume all customers accept such a modification, leading to the third stage. The last image shows how the grouping of demand through request modification has simplified the planned transport route, which now visits only 3 of the initial 7 stops, reducing the time taken to serve its assigned requests as well as lowering the travel cost to 15du.
As demonstrated by the example, the customer requests that can be spatially grouped must comply with a number of requirements. All requests must be assigned to the same vehicle. Moreover, grouped requests must be spatially compatible: have nearby origin or destination stops. Finally, the requests must also be temporally compatible: the passengers issuing them travel in overlapping time intervals. Our local optimisation algorithm considers these conditions to evaluate the feasibility of sending a modification proposal for the customer’s request.
On a different note, the example also evidences the implications of accepting a modification of the request—changes in the origin or destination stop affect the customer’s pickup or arrival time, which must be taken into account by the system to avoid proposing modifications that violate the request’s temporal constraints. In addition, the customer must be willing to accept such time changes. However, the greater impact comes from the difference in location between the original stop (desired by the customer) and the proposed stop (preferred by the system). In the case of an origin stop modification, the customer must travel to the new stop by their own means. Conversely, when the destination stop is modified, the customer may have to leave the vehicle further away from their intended final destination. In any case, the optimisation of a transport route is achieved by sacrificing the preferences of its users. It is for this reason that we combine our proposal with a gamification system, the aim of which is to encourage the acceptance of modifications by the users of the transport system.
3.3. System Architecture
Having described the architecture of the demand-responsive service (Sec. 3.1) and the methodology to optimise its solutions through gamified request modification (Sec. 3.2), we present the complete system architecture, which can be visualised in Figure 3.
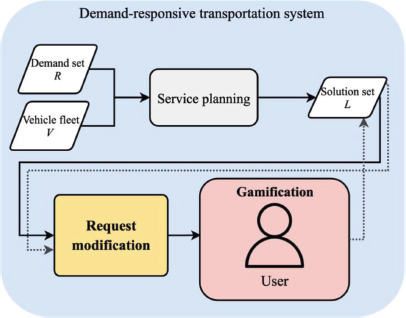
Figure 3. System architecture, integrating the request modification and gamification modules within the demand- responsive transportation system
The system architecture includes the request modification and the gamification modules, that complement the service planning module shown in Figure 1.
As commented in the previous section, the request modification procedure assesses the set of vehicle itineraries L, computed upon solving a DRT scenario, and computes spatial request modifications that would reduce the operational cost of the solution, if applied. A request modification involves changing the preferred origin or destination stop of a customer to an alternative one that simplifies the planned vehicle itineraries. Given the potential inconvenience, we included gamification mechanisms that increase the likelihood of modification acceptance among customers.
The gamification module manages the interactions of customers with the request modification subsystem. It offers rewards to motivate the acceptance of the proposed request modifications. These rewards may represent different benefits, according to the preferences of each user. To achieve this, the module integrates game mechanisms into the transportation service and keeps a user profile of each customer. The user profile is updated as the customer interacts with the service and adjusts their preferences within the model. In turn, the user’s preferences may be influenced by the rewards that are offered to them in exchange for accepting a modification of their original request. Overall, user interaction with the module is used to learn about user preferences, fine-tuning the computation of individualised rewards to maximise the rate of modification acceptance.
Regarding the flow of information within the system, the information defining a DRT scenario is input to the service planning module, as shown in Figure 3. This module obtains a set of potential vehicle itineraries. Then, the request modification module computes beneficial and feasible modifications and chooses the one to be offered to a user. The chosen modification is processed by the gamification module, which associates it with a reward and finally offers it to the corresponding user. The acceptance of the modification by the user involves an update of the solution within the system and thus must be taken into account by the request modification module too.
In the following sections, we specify and formalise our proposal. Section 4 describes the request modification module, its operation, and its integration within the demand-responsive service. Then, Section 5 illustrates the transportation service’s application and defines the gamification mechanisms embedded in it. Our proposal is fully defined by the integration of the gamification and demand-grouping processes, which together characterise the proposed system architecture.
4. Request Modification Module
The request modification module has the aim of computing spatial modifications over a customer’s request to simplify service operation. A modified request may avoid a costly vehicle detour or dispatch, thus lowering the operational costs of serving the original request.
This procedure pinpoints requests susceptible to alteration, referred to as eligible requests. Complemented by the gamification module (Sec. 5), the system quantifies the possible gains from a given eligible request and proposes to its issuing customer a stop modification linked to a reward. Should the customer deem the reward satisfactory, they will consent to the spatial adjustment, thereby modifying their request and consequently contributing to the DRT system’s optimisation.
Subsequently, we provide a formal definition of the problem, delineating the representation of DRT components and the subprocesses utilized in the calculation of request modifications.
4.1. Definitions
For the purposes of this research, we introduce our own definitions of the DRT system elements that compose a problem instance and its solution, described in Table 3. The set of stops S defines the area serviced by the transportation system. As commented in Sec. 3.1, a particular problem instance is defined by its demand R and vehicle V sets. A solution is computed by initialising and updating the itinerary set L, which contains the planned operation of each vehicle. Demand is serviced by assigning requests to itineraries, guided by a system-wide optimisation function that ensures global costs are minimised. The set of itineraries obtained at the end of the scheduling of all demand is referred to as the solution set, as it describes the operation of the DRT service that solves the present demand.
Table 3. Definitions of the problem formalisation
Sets |
S = {s1, s2,..., s|S|} Set of stops for the transportation service. Each individual stop si(x, y) describes its geographic coordinates (x, y). |
R = {r1, r2,..., r|R|} Set of travel requests, each representing a service customer. A request ri(so, sd, tpu) comprises an origin stop so, a destination stop sd, and a pickup time tpu, with origin and destination being different stops within S: |
. |
V = {v1, v2,..., v|V |} Set of fleet vehicles. Each vehicle defines its capacity and initial stop. |
L = {l1, l2,..., l|V |} Set of itineraries, each representing the route of a vehicle. Each itinerary is defined as li([(s1, t1), (s2, t2),..., (sn, tn)], Ri), being n the number of stops vi visits in its route. A stop visit includes its visiting time. The subset Ri ⊂ R contains the requests that have been assigned to itinerary li. Initially, an itinerary contains a single stop visit, corresponding with the initial stop of its vehicle, and an empty request subset: li([(sini, t = 0)], Ri = ∅) |
Functions |
travelDist(sj, sk) Distance a vehicle travels from stop sj to sk, expressed in kilometres. walkingDist(sj, sk) Distance a customer walks from stop sj to sk, expressed in kilometres. travelCost(vi, sj, sk) Cost incurred by vi travelling from stop sj to stop sk, in cost units. |
cost(L) Cost of the set of itineraries I, which corresponds with the cost of the solution. |
min(cost(L)) System-wide objective function.
The cost of a problem instance solution is thus indicated by the operational costs derived from completing every allocated request. We model this cost according to the distance travelled by the vehicle. The travel cost is computed from the vehicles’ itineraries and is proportional to the distance covered visiting all their stops. Given a vehicle vi with itinerary li = [(s1, t1), (s2, t2),..., (sn, tn)], its travelCost is computed by adding the travelled distance between every two consecutive stops. With this modelling, we aim to optimise the routes of all used vehicles.
As the last element, we must define request modifications. A request modification represents a modification of the original request ri. A modification defines an alternative origin or destination
stop, and a cost reduction δc with respect to ri. Finally, each modification includes the parameter w, which indicates the walking distance between the original and the alternative stops. Therefore, before a customer accepts a modification, they will be made aware of the changes in the walking distance.
4.2. Process Development
The request modification module processes the itinerary set L of a transportation scenario and obtains a set of feasible spatial modifications. Next, we detail the operations that are necessary to achieve such a set. A visual representation of these operations can be seen in Figure 4.
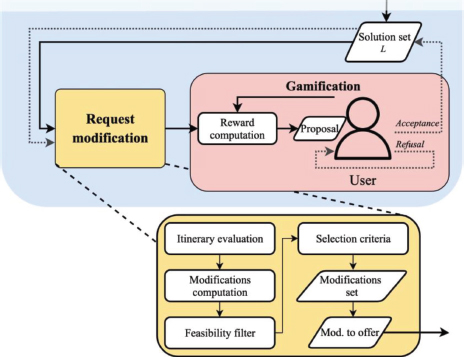
Figure 4. Detail of the request modification and gamification modules’ operations
Itinerary evaluation. Each itinerary in the solution set is traversed, assigning each stop visit within the vehicle’s route its associated cost increment. The cost of a visit to stop sj is defined as the cost of travelling from its previous stop in the itinerary sj-1 to sj plus that of travelling from sj to its successive stop in the itinerary sj+1:
With this formulation, we have an indication of the cost incurred by each stop visit, being able to pinpoint those that involve a costly detour in the vehicle’s route.
Modification computation. Once each stop visit within an itinerary is evaluated, the system assesses the modifications of the costlier stops. Each stop within an itinerary corresponds to the pickup or drop off of a customer, and thus, to a customer request. A costly stop sj is selected, and the request it corresponds to, ri(so, sd, tpu) | sj = so ∨ sj = sd, is extracted from R. Then, we assess if sj represents the origin or the destination stop of ri. In accordance, the system creates an origin stop modification or a destination stop modification.
Once a request and one of its stops have been chosen for modification, the following operations require the definition of a maximum walking distance. Such a parameter restricts the stops of S which are eligible to replace sj in ri. Let us define the relationship among neighbouring stops. Two stops sj and s' are considered neighbouring stops if the walking distance among them is within the maximum walking distance; that is, walkingDist(sj, s') < maximum_walking_distance. Thus, the system pre-emptively creates the modification of sj request to a neighbouring stop. Then, those modifications are evaluated to estimate their cost reduction, if any. Let s' be a candidate stop to replace sj. The estimation of the cost incurred by the modification of sj to s' is computed as follows:
Then, the cost reduction δc of the modification is computed as . If the cost reduction is at least of a given threshold, the modification is understood as beneficial, and thus it is formalised: with .
Feasibility filter. To assess the validity of a created modification, the process tests its feasibility against the problem constraints. For that, a copy of the itinerary where the original request was assigned is created. The original request is then unassigned from the copied itinerary; that is, the request’s origin and destination stops are removed from the vehicles’ route. This removal entails a recalculation of the itinerary times, obtaining a consistent itinerary without the original request. Then, the system assesses the assignment of the modified request to the very same itinerary, inserting its trip in the route. If the heuristic insertion algorithm deems such an insertion possible, the modified request is marked as feasible. Those modifications which are deemed unfeasible are discarded by the system.
Selection criteria. Finally, once a list of feasible and advantageous modifications has been obtained, the module sorts the list according to a given criterion. This step affects the order in which modifications are offered to customers through the gamification module. Take into consideration that a single request may have more than one beneficial modification. However, only one modification can be applied to a request. For this reason, the system requires a criterion according to which it can choose the most appropriate modification of request for the user, from among many potential options. Currently, three criteria may be considered:
1) Maximum cost reduction, 2) Minimum walking distance, 3) «Cost Reduction to Walking» ratio.
The first criterion, as its name indicates, prioritises those request modifications whose estimated cost reduction is higher. Thus, for every modifiable request, its modifications are sorted according to cost reductions, in descending order. As for the second criterion, the customer’s walking effort is minimised, prioritising request modifications that entail a shorter walking distance to stops. Finally, the third criterion establishes a ratio between cost reduction of the modification and the walking effort it requires from the user. A high ratio indicates an elevated cost reduction relative to the walking distance required by the modification.
At the end of the request modification computation, the system has created a sorted set of feasible and advantageous request modifications, ready to be offered to the user. From such a set, the first modification is popped and sent to the gamification module, which is in charge of computing its associated rewards, taking into account the customer’s profile.
4.3. System Update
Once the initial set of request modifications has been computed, the system iteratively chooses a modification and offers it to the corresponding user. Once a request modification is selected for offer, it is removed from the modifications set. The way a user responds to the offer guides the updates on the computed solution and request modification sets. If the modification is accepted, it will produce changes in the solution set; particularly within the itinerary of the vehicle to which the original request was assigned. On the contrary, if the modification is rejected, the system will simply discard it.
Let us consider request ri(so, sd, tpu), assigned to itinerary lj of vehicle vj. Let be an origin stop modification for request ri. Upon the acceptance of ∆ri, the system updates the solution set (dotted arrows in Figure 4). Specifically, the visit to stop sowithin lj is changed to a visit to . After that, the visiting time of and all subsequent stop visits are adjusted.
The changes in an itinerary are propagated to the request modification module. After changing an itinerary, the modifications previously computed for its requests must be reassessed. Following the example above, upon the acceptance of ∆ri, any other existing modification of request ri is discarded, as its user has already accepted one. Then, the previously computed modifications for requests of itinerary lj may now be unfeasible and, moreover, their cost reduction may have changed. Because of that, the request modification procedure needs to be executed again exclusively over unmodified requests of the modified itinerary, thus obtaining a new set of valid modifications.
The gamification system also obtains feedback on the user’s decision regarding a specific tuple of request modification and reward, affecting both internal user preferences and future reward computations for that user. These processes are detailed in Sec. 5.2.
5. Gamification Module
In previous sections, we described the optimisation algorithm proposed to cut operational costs in DRT systems. Such a method, based on the modification of the origin and/or destination stops of a trip, requires the corresponding customers to give up their travel preferences in favour of an optimised service. This aspect of our approach may be uncomfortable for some of the users of the transportation service. Nonetheless, users can choose to accept or decline request modifications, which means that their decision is key for cost reduction. To palliate potential negative feelings and motivate users to accept modifications, we propose the integration of a gamification system in the transportation service application.
The main goal of utilising gamification in the context of this work is thus to elicit a positive response from users when they are sent a request to modify their initial transportation preferences. Therefore, the focus is on affecting the motivation of the user and swaying their behaviour towards the optimal choice for the system. This differs to an extent when compared to the goals of some of the examples presented for various application domains given in Sec. 2. However, gamification methods are used in the context of this work to foster user engagement with the DRT system as well, i.e. to increase the desire of the user to engage with the developed system and use the services it provides.
5.1. Game Mechanisms
Fundamental game mechanics are an obvious choice for building a gamified system. Points, badges, and leaderboards are game design elements that are used most often in the context of gamified systems. The roster of the game design elements often used in gamified systems is further expanded upon by challenges, feedback, levels, narrative, signposting, and time limits (Phosanarack et al., 2025). The three aforementioned elements, points, badges, and leaderboards, are not as popular when adaptive gamification is the aimed approach (Klock et al., 2020).
The element of accruing points is converted in this context into collecting virtual currency units. Users are awarded points (in the form of virtual currency) for behaving in a way that is beneficial for the system, i.e., for accepting the modifications of their travel requests and complying with the suggestions of the optimisation system driving the DRT. For example, should a user accept the modification proposed to them by the system and do so within a specific time slot, they are awarded 5 units of the applicable virtual currency. This currency is a way of showing the company’s appreciation to the user for accepting the optimisation suggestion and for behaving in a way that promotes sustainable and environmentally friendly behaviour in the DRT context. The accumulated virtual currency can be, following specific exchange mechanics and the devised mercantile systems, exchanged for various other elements of the gamified system described below.
Based on the user’s engagement and interaction with the proposed system, users become eligible for receiving different kinds of badges that grow in levels based on the frequency of their behaviour benefitting the system,
i.e. based on how often they endeavour into behaviour that promotes sustainable and environmentally friendly conduct. For example, should a user accept two modifications that lead to an optimised transport route twice in a row, they would be given a level 1 badge that celebrates the beginning of their effort and supportive journey towards a better DRT system. After accruing five such accepted modifications, the user would receive the same badge but upgraded to the next level, i.e. level 2. Users are given the option to display these badges publicly, thus commemorating and promoting their achievements.
Since competition is a strong driver in human motivation and goal setting, leaderboards are envisioned as a mechanic that drives a change in users’ behaviour through different forms of social pressure. Leaderboards customised to various critical elements of the system, provide a means of measuring one’s standing and performance in comparison to a subset of other users of the system. Leaderboards can be designed in various ways to cater to different personalities and needs. For instance, a system may have a leaderboard showing the total amount of virtual currency units earned, while another may display rankings based on the amount of CO2 saved thanks to users accepting request modifications. These different interpretations of leaderboard results are intended to engage users with varying preferences and motivations.
Visual clues, especially those visible publicly, provide a strong means of motivating users who can be described using some of the facets described briefly in Sec. 2. User representation within the in-game world is often implemented in an aesthetically pleasing way, using a player avatar—a piece of graphic representing the user in the in-game world. An avatar is usually publicly available, wherefore it is a good way of showcasing accrued achievements or similar elements to the public that can see it. For example, a person may be more likely to choose a custom avatar to represent them in the world. Since such a person is driven by visual aesthetic elements and dependent on social acceptance, they are expected to aim to utilise those reward methods within the gamified system that will satisfy their personality traits and facets.
5.2. User Interaction
We assume the DRT system is coupled with a smartphone or web application, which provides its users with a platform to register and update their information, check the service stops’ locations, and issue travel requests. The gamified interaction with the system is optional but users would be encouraged to use it, beginning with an avatar customisation as soon as they register as new customers. Through their user profile view, users will have access to the other implemented game mechanisms, being able to track their virtual currency, visualise any earned badges or access the leaderboards. The social aspects of the gamification system include being able to see the positioning of other users in the leaderboards, their badges and their avatar. In turn, the user may choose to share their own avatar aspect and statistics.
The interaction of the user with the transportation application is captured by the gamification module to model their preferences. A user’s preferences indicate the gamification elements which better motivate the user to positively interact with the app. The most straight-forward example of a positive interaction would be the acceptance of a request modification. This modelling aims to present an individualised experience to the users, particularly adjusting their rewards towards gamified mechanisms that they enjoy most. Thus, a user who participates in the social aspects of the app, may be offered avatar customisation rewards more often. In contrast, users primarily motivated by economic rewards would be offered more virtual currency upon acceptance of the modification. The intrinsic value of a reward within the gamification system is computed considering the expected cost reduction of the modification and the user’s effort in changing one of their preferred stops.
The app presents a marketplace where there are certain benefits that can be exchanged for virtual currency. These benefits can be social (such as avatar customisation elements) or give certain advantages in the use of the system. Within the latter group, we included priority scheduling of a travel booking and trip discounts. The prices (in terms of virtual currency) of these advantages are carefully adjusted to ensure that the users who benefit from them are the more generous ones in terms of reward acceptance. With these types of monetary rewards, users who are not as interested in the social aspects of the gamification system still have a goal that motivates them to accept modifications.
Finally, there are threshold limits for the request modification offering mechanism. The main goal of our proposal is to further optimise a DRT service. The users of the service are the basis of the economic sustainability of the system and thus must be respected. The request modification and gamification modules must be employed in such a way so as not to evoke negative feelings towards the service. Because of that, we allow the users to define aspects which may not be modified or to set limits, such as a maximum distance between their desired stop and the offered alternative. Users may also define a maximum number of request modifications to be offered for a trip, to avoid annoyance. Finally, with user comfort and tranquillity in mind, request modifications are not offered if the pickup time is within a short period of time, which would otherwise produce an undesirable sense of urgency.
5.3. Formalisation
The following formalisation is suggested to facilitate the implementation of the gamified system described above. The main goal of this approach is to formalise and relate various elements influencing how a gamified system is affected, thus easing its implementation. The result of such a process is to ultimately enable gamification developers to simulate the modelled system, such as the one described in this paper.
To create a system that can be simulated, both gamification elements and users must be considered. It is described in Sec. 2 that oftentimes, users of gamified systems are observed in the context of personality traits and facets. Adaptable gamification is based on those defining features of humans as well. Therefore, the following formalisation is based on relating gamification elements with personality traits. The goal of this approach is to enable the modelling of virtual intelligent agents as entities that can be described using human personality traits. Based on these features, agents are expected to react, decide, and behave when they encounter and interact with a gamification technique, i.e. when the implemented system must determine the impact a specific gamification technique would have on an individual agent.
Let us observe a set
Γ = {virtual currency, badges, leaderboard, avatar}
comprising all the gamification elements γ of a gamified system, where ∀γ: γ ∈ Γ. In addition, let us observe a set of personality traits
Ψ = {openness to experience, conscientiousness, extraversion, agreeableness, and neuroticism}
comprising all the personality traits ψ, where ∀ψ: ψ ∈ Ψ. Finally, let us consider Φ as a set of all facets ϕ used to describe personality traits. Let us suggest that every personality trait ψ can be described using a tuple of values for each of the related facets ϕ, i.e.
Let us group all the autonomous virtual agents of a gamified system in the set Ω. Every autonomous virtual agent ω will be described herein using a vector consisting of values related to all the facets ϕ describing all the personality traits ψ of an agent. Therefore:
Gamification elements γ can be related to specific personality traits ψ and facets ϕ, as shown in published literature. Therefore, let us describe gamification elements using a similar vector showcasing how much a gamification element is planned to cater to each facet of a personality trait. The goal of this approach is to allow the calculation of similarities and influences between gamification elements and personality traits, i.e. to enable a formal depiction of which instance of a gamification element is designed for which group of users based on their personality traits. Therefore, a gamification element is proposed to be described using the same vector as an agent, i.e.
Finally, to mark how much each gamification element γ is aligned with each agent ω, it is possible to calculate the distance between the two vectors:
The closer they are, the stronger the influence of the proposed gamification element is over the agent, and vice versa. Based on a plethora of published research, factors other than personality traits influence the effects of gamification on people. Therefore, introducing another concept is beneficial. It is proposed here to include another factor that represents the influence of factors outside the set Φ, i.e. we extend the definition of an agent with factor χ, turning the definition of an agent into a tuple of χ and the vector of personality traits:
5.4. System Instantiation Example
To illustrate the functioning of the gamification module, this section develops an instantiation of its elements, following the formalisation presented in Sec. 5.3. For that, we present a straightforward representation of two different users, their travel requests, and how the system computes a personalised reward to motivate their acceptance of request modifications. Among the instantiated elements, we must give value to the vectors that represent the relationship between user preferences and gamification elements with the 5 chosen personality traits. For the sake of simplicity, instead of representing a tuple of facets for every personality trait (as described in the formalisation), the example is developed with a single value indicating the overall weight of all facets.
Each gamification element γ ∈ Γ is defined by a vector indicating how much it caters to different personality facets Ψ (openness to experience, conscientiousness, extraversion, agreeableness, and neuroticism). Let us assume the following instantiation of the four game element vectors:
Then, we instantiate two DRT service customers, Alice and Bob, each represented by their personality trait vector and external influence factor χ within the gamification module. These profiles represent different user behaviours in response to gamification elements. Upon their registration as service customers, Alice and Bob have their profiles initialised with empty preference vectors and an external influence factor of 0:
Let us assume a difference among the customer’s personalities. Alice is an extroverted user who enjoys social recognition and competition. She is highly motivated by public rewards such as leaderboards and avatars. Given Alice’s preference for social elements, gamification mechanisms such as leaderboards (γleaderboard) and avatar customization (γavatar) are expected to have a high influence on her engagement with the system. Bob, on the other hand, is a conscientious user who values efficiency and structured incentives over social interaction. He prefers gamification elements that provide structured rewards, such as virtual currency. For Bob, point-based rewards (γvirtual_currency) and structured goal achievements (γbadges) are expected to be the most effective gamification elements.
As Alice and Bob interact with the service, their profiles are refined. Let us assume that after a certain number of interactions, their profiles are updated as follows. The resulting preference vector values indicate the degree of openness to experience, conscientiousness, extraversion, agreeableness, and neuroticism, respectively, of each customer.
Then, upon the calculation of a reward for Alice or Bob, the system would compute the distance of their preferences and the game mechanisms, as illustrated in Table 4.
Table 4. Euclidean distances between user preferences and gamification elements
0.56 |
0.39 |
0.33 |
0.36 |
|
0.17 |
0.22 |
0.59 |
0.56 |
The calculated personality vectors indicate that Alice would engage more with visually and socially stimulating gamification mechanics, while Bob would respond better to structured and goal-oriented rewards. This differentiation allows the gamification system to adapt its strategies to maximize both user engagement and the acceptance of the proposed request modifications.
To follow the example, let us now instantiate a small-scale DRT service to which Alice and Bob will send requests, following the formalisation in Sec. 4.1:
- Stops: S = {s1(0, 0), s2(2, 3), s3(5, 1), s4(3, 2), s5(7, 4)}
- Requests: R = {rAlice(s2, s3, tpu = 5), rBob(s4, s5, tpu = 8)}
- Vehicles: V = {v1, v2}, both starting from s1
To serve Alice and Bob’s request, the system computes the vehicle itineraries as follows, with each vehicle serving one of the requests.
- Itineraries: L = {l1, l2}
– l1 = [(s1, t = 0), (s2, t = 5), (s3, t = 10)], R1 = {rAlice}
– l2 = [(s1, t = 0), (s4, t = 8), (s5, t = 12)], R2 = {rBob}
Subsequently, the request modification module identifies two feasible modifications that would optimise vehicle routing.
The modification for rAlice proposes the exchange of destination stop for s5, Bob’s destination stop, with a walking effort of 3.6 du (distance units) and an estimated cost saving δc of 4 du. Analogously, the modification for rBob proposes the exchange of destination stop for s3, Alice’s destination stop, with a walking effort of 3.6 du and an δc of 4.5 du. If any of the two modifications were to be implemented, rAlice and rBob could be assigned to the same vehicle, thus reducing the fleet’s operational cost. Of the two modifications, the module would first offer the one that achieves a higher cost reduction; in this case, ∆rBob.
The gamification system receives ∆rBob, a modification of Bob’s request, and must associate it with a reward that could maximise the possibilities of Bob accepting the change. In addition, the reward shall be proportional to the estimated δc. Seeing the relationship among Bob’s preferences and game techniques, as indicated by Table 4, the offered reward could feature 10 currency points (∼ 2 points per reduced du). If the right conditions were met, the system could also remind Bob of how the acceptance of the modification would increase his progress towards a specific batch (i.e., «Optimal customer» batch, obtained by accepting 10 modifications).
In contrast, if ∆rAlice was offered to Alice, its associated reward could be a customisation item for her avatar (i.e., sunglasses), and an increase of her position within a specific leaderboard (i.e., «Sustainable customer» leaderboard).
With this example, we have shown how the gamification module works together with the request modification process to maximise the likelihood of customers accepting modifications, thus optimising the DRT system.
6. Experimental Results
The presented system has the potential to reduce the operational expenses of demand-responsive services by motivating their users to accept slight modifications on their travel preferences. In this section, we illustrate the scope of our proposal by developing a case study. In it, the operation of a demand-responsive service implementing the request modification module is simulated, enabling us to evaluate potential operational cost savings in different scenarios. Aiming to facilitate the reproducibility of our work, the code and input data employed for the subsequent experimentation has been uploaded to a public GitHub repository1.
In the sections that follow, we describe the case study and the simulated transportation scenarios. Then, we assess the results the request modification algorithm yields.
6.1. Service Orchestration
Aiming to validate the request modification module, a case study has been developed, reproducing a demand-responsive transportation service over a real-world area. This has been possible thanks to the implementation of the demand-responsive transportation service planning module, which is prepared to solve problem instances whose road network, stops and customer demand are extracted from actual cities. For the purposes of this paper, the city of Valencia, Spain, and its surrounding metropolitan area and towns were chosen as a scenario. Currently, interurban transportation in the chosen area is serviced by a low-periodicity public bus service. In addition, a few towns are reached by the underground system of the city of Valencia, which is a hybrid between an urban underground and interurban train. The periodicity of such a service on stops outside the city, however, is relatively low. With these features, the individual private vehicle is still the most used option, causing regular traffic congestion in peak commuting hours in every access to the city of Valencia. Because of the observed characteristics, we believe that this area has the potential to be improved with a demand-responsive system.
Problem instances have been created departing from the existing public interurban bus service of the Comunitat Valencia. Such a service counts with a GTFS format specification describing its lines, stops and timetables (https://dadesobertes.gva.es/va/dataset/tra-hyr-atmv-horaris-i-rutes, accessed on April 25th, 2025). The original dataset describes a transportation system that spans along the whole region, defining 250 different trips, performed over 393 possible routes, totalling 2000 unique stops. To focus the case study over the desired areas, the set of stops was filtered, keeping only those within our area of interest. The final collection of stops can be visualised in Figure 5 and contains 482 unique points. Besides filtering the stops, we discarded the rest of GTFS information, as we do not want to constraint transportation in the simulated demand-responsive system to predefined lines. Instead, we reproduce a fully flexible system, where transportation can be provided between any two stops. Thus, instead of lines, we precomputed the routes connecting every pair of different stops making use of the Open Source Routing Machine (https://project-osrm.org/, accessed on April 25th, 2025), a routing engine that provides vehicle routes between pairs of geographic coordinates. The set of transportation stops and the precalculated routes conform the service orchestration, defining the area where transportation is provided. The reproduced demand-responsive system was thus fully flexible, stop-based, and on-demand, requiring users to emit travel requests.
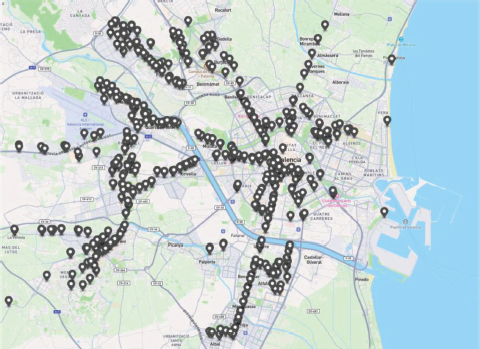
Figure 5. Stops layout of the simulated demand-responsive service
Having set the service orchestration, we define different problem instances specifying a certain intensity of demand, and a specific fleet of transports to serve it. Demand intensity is expressed in transportation request introduced into the system each hour. On the other hand, a fleet is characterised by its number of transports. Following, we detail the demand generation, and the tested fleet sized.
We tested demand intensities ranging from 10 to 100 requests per hour, which are uniformly distributed along the simulation time and appear dynamically. Each individual request defines the trip of 1 to 5 passengers. The number of passengers is selected by a probability vector that favours trips with less passengers: [(1, 0.5), (2, 0.2), (3, 0.15), (4, 0.1), (5, 0.05)], where (X, Y), X = number of passengers, Y = probability of selecting X. In addition, each request defines a trip between two different service stops, whose distance must be of at least 1km.
Regarding transport fleets, we tested sizes of 10, 15, and 20 vehicles. Each vehicle represents a van with capacity for up to 8 concurrent passengers. All problem instances simulated 6 hours of demand-responsive transportation operation. Vehicles begin their execution 1 hour before the start of the service. They are initially located uniformly divided between the northernmost, easternmost, southernmost, and westernmost stops of the scenario. As transportation requests appear, the service planning module is executed to assign it to a vehicle, thus updating its initially empty itinerary.
Combining all tested demand intensities and fleet sizes, we obtained 30 unique problem instances. The tested combinations of demand-intensity and fleet size entail scenarios that range from an underused service (fleet size ≪ demand-intensity) to a saturated service (fleet size ≫ demand-intensity), allowing us to study the impact of the request modification algorithm in all these situations.
The logic of the demand-responsive service is supported by the system presented in Martí et al. (2024b), which assigns, in real-time, incoming travel requests to the vehicle itinerary that ensures the lowest possible global operational cost increment, while preserving the constraints of all already assigned trips. When a request cannot be assigned without breaking its constraints, the system rejects the customer. All scenarios are solved and evaluated according to their operational costs, providing the baseline for the experimentation.
6.2. Assessment
The 30 transportation problem instances created as described in Sec. 6.1 were solved with the scheduling algorithm integrated in the Service Planning module of the system architecture (presented in the authors’ previous research (Martí et al., 2024b)). Table 5 collects the results of each instance. Instances are described as ⟨total requests⟩r-⟨fleet vehicles⟩v. For each instance, the baseline results are presented in the second and third columns, indicating the number and percentage of scheduled requests (out of the total), and the total operational costs, expressed in travelled kilometres, derived from completing such requests.
We tested the request modification procedure for each instance’s solution. The maximum walking distance for all scenarios was set to 1 km, to avoid the proposal of modifications that exceed a reasonable effort threshold for the customer. This parameter, as it can be understood, limits the potential operational cost savings. To illustrate the operations described in Sec. 4.2, Table 5 indicates the number of feasible computed modifications (# F mod.) and the number of requests that can be modified (# F req.). As for the method’s optimisation potential, we show the amount of operational costs that may be saved if all feasible modifications were applied (Max. save (%)). Then, the penultimate column (F save (%)) shows the operational cost savings if all modifiable requests were modified by their best possible modification (the one that maximises cost savings), which represents a realistic savings estimation. Finally, the last column (Avg. save/req.) shows the average cost reduction each modified request caused (obtained dividing the values in F save by # F req.).
Table 5. Results summary of the request modification procedure in all solved transportation scenarios. Symbol # indicates «number of». The Letter F stands for «Feasible»
# |
Instance |
Sched. (%) |
Cost |
# F mod. |
# F req. |
Max. save (%) |
F save (%) |
Avg. save/req. |
1 |
60r-10v |
60 (100.0) |
729 |
178 |
26 |
188 (25.8) |
39 (5.4) |
1.5 |
2 |
60r-15v |
60 (100.0) |
753 |
173 |
26 |
180 (24.0) |
43 (5.7) |
1.7 |
3 |
60r-20v |
60 (100.0) |
746 |
158 |
25 |
169 (22.7) |
39 (5.3) |
1.6 |
4 |
120r-10v |
120 (100.0) |
1423 |
254 |
34 |
222 (15.6) |
53 (3.7) |
1.6 |
5 |
120r-15v |
120 (100.0) |
1487 |
203 |
28 |
206 (13.8) |
39 (2.6) |
1.4 |
6 |
120r-20v |
120 (100.0) |
1446 |
220 |
26 |
231 (16.0) |
38 (2.6) |
1.5 |
7 |
180r-10v |
158 (87.8) |
1860 |
284 |
37 |
255 (13.7) |
54 (2.9) |
1.5 |
8 |
180r-15v |
180 (100.0) |
2129 |
265 |
33 |
214 (10.1) |
44 (2.1) |
1.3 |
9 |
180r-20v |
180 (100.0) |
2167 |
369 |
49 |
367 (16.9) |
78 (3.6) |
1.6 |
10 |
240r-10v |
176 (73.3) |
2157 |
218 |
31 |
221 (10.2) |
49 (2.3) |
1.6 |
11 |
240r-15v |
235 (97.9) |
2594 |
312 |
47 |
304 (11.7) |
67 (2.6) |
1.4 |
12 |
240r-20v |
240 (100.0) |
2507 |
343 |
52 |
323 (12.9) |
75 (3.0) |
1.4 |
13 |
300r-10v |
191 (63.7) |
2056 |
121 |
26 |
125 (6.1) |
43 (2.1) |
1.7 |
14 |
300r-15v |
261 (87.0) |
2919 |
129 |
30 |
124 (4.2) |
36 (1.2) |
1.2 |
15 |
300r-20v |
291 (97.0) |
3095 |
260 |
45 |
218 (7.0) |
61 (2.0) |
1.4 |
16 |
360r-10v |
187 (51.9) |
2034 |
138 |
22 |
139 (6.9) |
34 (1.7) |
1.5 |
17 |
360r-15v |
281 (78.1) |
2936 |
192 |
38 |
158 (5.4) |
44 (1.5) |
1.2 |
18 |
360r-20v |
346 (96.1) |
3629 |
334 |
49 |
298 (8.2) |
63 (1.7) |
1.3 |
19 |
420r-10v |
207 (49.3) |
2119 |
185 |
28 |
157 (7.4) |
39 (1.8) |
1.4 |
20 |
420r-15v |
305 (72.6) |
3061 |
244 |
37 |
193 (6.3) |
47 (1.5) |
1.3 |
21 |
420r-20v |
377 (89.8) |
3951 |
390 |
64 |
337 (8.5) |
87 (2.2) |
1.4 |
22 |
480r-10v |
205 (42.7) |
2056 |
116 |
18 |
109 (5.3) |
26 (1.3) |
1.4 |
23 |
480r-15v |
302 (62.9) |
3075 |
164 |
29 |
198 (6.4) |
54 (1.8) |
1.9 |
24 |
480r-20v |
402 (83.8) |
4014 |
294 |
47 |
256 (6.4) |
66 (1.6) |
1.4 |
25 |
540r-10v |
206 (38.1) |
2099 |
127 |
17 |
100 (4.8) |
21 (1.0) |
1.2 |
26 |
540r-15v |
309 (57.2) |
3113 |
266 |
35 |
234 (7.5) |
53 (1.7) |
1.5 |
27 |
540r-20v |
400 (74.1) |
4028 |
248 |
48 |
243 (6.0) |
69 (1.7) |
1.4 |
28 |
600r-10v |
221 (36.8) |
2123 |
92 |
16 |
90 (4.3) |
22 (1.0) |
1.4 |
29 |
600r-15v |
318 (53.0) |
3074 |
155 |
22 |
144 (4.7) |
30 (1.0) |
1.4 |
30 |
600r-20v |
411 (68.5) |
4007 |
263 |
49 |
238 (5.9) |
62 (1.6) |
1.3 |
To characterise the different types of scenarios we assessed, we must first discuss the results in terms of scheduled requests. From a general perspective, we can differentiate between scenarios that provided transportation to all customers (100 % scheduled requests), those which provided acceptable service (80-99 % scheduled requests) and, finally, those in which the service was saturated (<80 % scheduled requests). In the latter case, vehicles run without leeway, having an itinerary packed with customer trips for the whole 6 hours of simulation. For a fleet of 10 vehicles, the saturation, and thus the delay in completed requests, begins at 240 requests (40 requests per hour). For 15 vehicles, the tolerance is increased to around 300-360 requests. Finally, the largest tested fleet, with 20 vehicles, performs well until reaching 540 requests. At any rate, tested instances were purposely created to present this variety of results and thus allow us to study the behaviour of the request modification process in different service situations.
Focusing on the potential cost savings derived from the acceptance of request modifications, we can discuss several observable trends. Firstly, the savings in travelled kilometres seem more intense in those scenarios where the vehicle fleet runs unencumbered. Within these cases, the computed modifications have a higher overall impact in scenarios with low transportation demand, such as those featuring 60 total requests, reaching up to 5.7 % of the operational costs, as instance 60r-10v reflects in the table. These results are consistent with the requirements that make a modification implementable: transports have more leeway to modify their itineraries as customers accept requests, while keeping the constraints of the trip of every other already scheduled customer, thus not breaking any prior commitment. The results suggest that the introduction of a request modification procedure would be mostly exploited by low-demand DRT services, such as those present in rural settlements, which are better represented in table rows 1 to 6. Secondly, for saturated services, transports run more tightly, with less gap time, thus impeding the application of modifications. These cases feature reductions between 2.3 %, as in instance 240r-10v, and 1.0 %, as in instances 540r-10v, 600r-10v, and 600r-15v. Still, our estimations show that even in these cases, a decrease in operational cost can arise from request modifications, therefore supporting the exploration of this particular optimisation approach.
To justly comment on the results, we must note the influence that the maximum_walking_distance parameterhas on the computed modifications. For the results presented in Table 5, such a value was set to 1 km. We solved every problem instance again, setting the value to 2 km, developing the comparison of Table 6. There, one can easily compare how the average contribution to cost reduction of each applied request modification (Avg. s/r) varies according to the tested maximum walking distance. For 1 km, values range between 1.2 and 1.9 km saved per feasible request, whereas for the case of 2 km, the range increases from 2.3 to 3.3 km. The proposed approach requires service customers to give up a preferred stop in favour of one that simplifies vehicle routing, thus cutting operational costs. The magnitude of the customer effort is defined by such a parameter, which limits the distance between their preferred stop and the offered alternative. It can therefore be inferred that the more flexibility the service has in searching for neighbouring stops, the more can vehicle routes be optimised. However, that could also mean that the customer would be required to walk an excessively long distance, which could possibly lead to more frequent rejections and negative feelings towards the transportation service. Thus, the optimisation potential of our approach is limited yet noticeable in a global assessment of a transportation fleet.
Table 6. Comparison of average cost save per feasible request modification (Avg. s/r), computed for every instance with the parameter max_walking_dist set to 1 km and 2 km
Instance # |
1 |
2 |
3 |
4 |
5 |
6 |
7 |
8 |
9 |
10 |
11 |
12 |
13 |
14 |
15 |
Avg. s/r (1 km) |
1.5 |
1.7 |
1.6 |
1.6 |
1.4 |
1.5 |
1.5 |
1.3 |
1.6 |
1.6 |
1.4 |
1.4 |
1.7 |
1.2 |
1.4 |
Avg. s/r (2 km) |
2.8 |
3.0 |
3.1 |
3.1 |
2.9 |
2.9 |
2.8 |
2.9 |
3.1 |
3.2 |
2.4 |
2.6 |
3.3 |
2.6 |
2.4 |
Instance # |
16 |
17 |
18 |
19 |
20 |
21 |
22 |
23 |
24 |
25 |
26 |
27 |
28 |
29 |
30 |
Avg. s/r (1 km) |
1.5 |
1.2 |
1.3 |
1.4 |
1.3 |
1.4 |
1.4 |
1.9 |
1.4 |
1.2 |
1.5 |
1.4 |
1.4 |
1.4 |
1.3 |
Avg. s/r (2 km) |
3.0 |
2.7 |
2.5 |
2.4 |
2.3 |
2.9 |
2.6 |
2.6 |
2.5 |
2.3 |
2.8 |
2.5 |
3.1 |
2.9 |
2.4 |
Finally, we highlight the impact of our results by discussing the implications of operation cost reductions. The number of travelled kilometres of a transportation service directly impacts the expenses of the service, producing more vehicle wear, which leads to required maintenance. Moreover, an excess in requests for transport may also indicate worse service quality metrics, such as longer customer waiting and travelling times. Finally, regarding the environmental impact of the service, this value is proportional to greenhouse gas emissions and, in addition, may favour traffic congestion. One can gather, therefore, that a reduction in travelled kilometres entails better service for customers and more sustainable transportation. The simulated scenarios are evaluated over 6 hours of service and reached a reduction of up to a 5.7 % in costs. Even an improvement of such a humble size, if repeated for every service period, will accrue to an elevated impact. In addition, for the case of DRT, optimising routes and, consequently, the time to complete customer trips, provides the service with more leeway to schedule incoming real-time demand. In turn, this translates into a boost of the system benefits, as it can attain more customers and provide them with a more enjoyable experience.
7. Discussion
The proposed architecture warrants a discussion about the challenges that its implementation in a real-world scenario would incur. In the following, we present an analysis of these challenges from a conceptual and a technical viewpoint.
The concept of user-driven optimisation brings several challenges to a system. Ideally, optimisation would be centralised on the service provider, with them having full control of its effect. However, when a service is being provided to a series of customers, it can be beneficial to include them in the loop of the operation. The application field of this research is shared, on-demand transportation. As its name reflects, this problem involves many stakeholders who must be coordinated. Traditional transportation presents its customers with limited options, making them adapt to the offered services, easing the coordination of all involved parties. However, the principle of demand-responsive mobility is to somehow adapt its operation to the customer’s real-time needs, thus making it an ideal sandbox to develop collaborative strategies, such a user-driven optimisation.
The proposed approach is based on multi-agent communication paradigms. The service provider sends an offer (trip modification + reward) to one of the customers, who replies according to their goals and preferences. In turn, the reply of each agent has an effect over the operation of part of the system. Therefore, it can be seen how a concurrent communication of trip modifications poses difficulties. Each individual trip modification acceptance may modify vehicle itineraries in such a way that other offered modifications become unbeneficial. Precisely because of this issue, the description of the proposal and its validation has been done in this paper with an iterative communication with customers, offering modifications one by one, and waiting for the reply. When it comes to real-world demand-responsive systems, an iterative operation of the request modification module may be unfeasible according to the size of its service. A great number of customers motivates concurrent communication which, in turn, requires mechanisms to assess all replies and rearrange the itineraries in a way that is still beneficial for the operator. These mechanisms would include limiting user reply time, forming partial agreements between users, and gamification techniques that focus on motivating coalitions of users to accept compatible trip modifications. Anyhow, the inclusion of these techniques escalates the complexity of the system and thus warrants more research into distributed user-driven optimisation of transportation services.
From a technical point of view, the main challenge of the proposed approach comes from the real-time reactiveness of demand-responsive mobility. We have proposed the use of a smartphone application that serves as means of bidirectional user-service communication. Such communications must be managed through a swift and secure infrastructure, both to inform users of request modification and itinerary changes, and to receive and process user replies efficiently. We believe current technology can support these needs. On a different note, the real-time re-planification of vehicle itineraries can be solved efficiently thanks to the implemented scheduling algorithm. Such an algorithm, however, requires knowing the exact position of transports and users, which would be provided by geographic positioning services. Moreover, it requires an estimate of riding times between stops, which could be obtained thanks to platforms such as the Google Maps or other open-source alternatives. Finally, the service would need robustness mechanisms to deal with events that cause incomplete location or travel-time estimations.
In conclusion, the principal issues for the implementation of the proposed architecture are those that stem from adapting its operation to a concurrent design that deals with real-time offering of request modifications to various users. The future work will address many of these challenges to keep researching the suitability of this approach.
8. Conclusions
The recent interest in demand-responsive transportation systems has justified research into its successful implementation. This feat is particularly hard for services that feature low demand or limited resources, as is their economic sustainability. Our investigation focuses on practical solutions for the optimisation of DRT services, aiming to cut their operational costs and ease their operation under any constraints.
We present a methodology for user-driven optimisation of DRT vehicle itineraries by searching for modifications to customer trip requests that simplify fleet routing and reduce operational costs from travel distance. These trip modifications suggest alternative origin or destination stops for customers whose trips would otherwise cause costly detours. To encourage customer acceptance, we propose a gamification system that maintains user profiles to learn individual preferences and offers personalised rewards for accepted modifications.
Validating a gamification system requires human participants, making it an expensive aspect of research. In this paper, we have instead formalised the gamification module to ease implementation. To evaluate its potential contribution to DRT optimisation, we measured it by replicating the request modification process that gamification complements, using a case study based on interurban bus stops from an existing public transport system. While our results are limited by transportation simulation constraints, the evaluated scenarios reveal trends that can guide transportation providers’ decisions.
Our findings show that request modification-based optimisation is most effective for low-demand, flexible services, achieving up to a 5.7 % reduction in overall travel distance. For saturated services, the reduction ranges from 1.0 % to 2.3 % but remains significant, making our approach especially valuable for services with lower customer intensity. More broadly, it helps reduce the environmental impact of DRT fleets and improve overall trip quality.
In the future, we plan to provide a more comprehensive evaluation by studying how service layouts influence the chance of computing beneficial request modifications, as the current study design was adequate but could benefit from more careful stop placement. We also intend to implement an initial version of the gamification module and simulate different user profiles to assess game mechanics, formalising customer rewards through a virtual currency tied to the optimisation potential of each modification. These simulations will help refine our proposal for different DRT service configurations.
Funding
This work is partially supported by grant PID2021-123673 and PDC2022-133161-C32 funded by MCIN/AEI/https://doi.org/10.13039/501100011033 and by «ERDF A way of making Europe». Bogdan Okreša Ðuric is supported by the project MOBODL-2023-08-5618 funded by the European Union and the Croatian Science Foundation. Markus Schatten and Bogdan Okreša Ðuric are supported by the Croatian Science Foundation under the project number IP-2019-04-5824.
References
Alahmadi, R. N. A. & Alzahrani, A. (2023). The effect of data science on urban sustainability through the optimization of demand-responsive transportation. Journal of Umm Al-Qura University for Engineering and Architecture, 14(3), 172-187.
Anburuvel, A., Perera, W. & Randeniya, R. (2022). A demand responsive public transport for a spatially scattered population in a developing country. Case Studies on Transport Policy, 10(1), 187-197. ISSN 2213-624X.
Bartle, R. (1996). Hearts, Clubs, Diamonds, Spades: Players Who Suit Muds. Journal of MUD Research, 1(1).
Calabrò, G., Le Pira, M. L., Giuffrida, N., Inturri, G., Ignaccolo, M. & Correia, G. H. d. A. (2022). Fixed-Route vs. Demand-Responsive Transport Feeder Services: An Exploratory Study Using an Agent-Based Model. Journal of Advanced Transportation, 2022(1), e8382754. https://doi.org/10.1155/2022/8382754
Calabrò, G., Le Pira, M. L., Giuffrida, N., Inturri, G., Ignaccolo, M. & Correia, G. H. d. A. (2023). Designing demand responsive transport services in small-sized cities using an agent-based model. Transportation Research Procedia, 69, 759-766. ISSN 2352-1465. https://doi.org/10.1016/j.trpro.2023.02.233.
Cardoso, B., Ribeiro, M., Prandi, C. & Nunes, N. (2019). When Gamification Meets Sustainability: A Pervasive Approach to Foster Sustainable Mobility in Madeira. In 1st ACM Workshop on Emerging Smart Technologies and Infrastructures for Smart Mobility and Sustainability, pp. 3-8. ACM, Los Cabos, MX. ISBN 978-1-4503-6930-5. https://doi.org/10.1145/3349622.3355449
Cummings, J. A. & Sanders, L. (2019). Introduction to Psychology. University of Saskatchewan Open Press. ISBN 978-0-88880-637-6.
Currie, G. & Fournier, N. (2020). Why most DRT/Micro-Transits fail–What the survivors tell us about progress. Research in Transportation Economics, 83, e100895.
Dehghanzadeh, H., Farrokhnia, M., Dehghanzadeh, H., Taghipour, K. & Noroozi, O. (2023). Using Gamification to Support Learning in K-12 Education: A Systematic Literature Review. British Journal of Educational Technology, 1467-8535. ISSN 0007-1013. https://doi.org/10.1111/bjet.13335
Deterding, S., Dixon, D., Khaled, R. & Nacke, L. (2011). From Game Design Elements to Gamefulness: Defining «Gamification». In Proceedings of the 15th International Academic MindTrek Conference on Envisioning Future Media Environments, pp. 9-15. Association for Computing Machinery, Tampere, FI. ISBN 978-1-4503-0816-8. https://doi.org/10.1145/2181037.2181040
Drakoulis, R., Bellotti, F., Bakas, I., Berta, R., Paranthaman, P. K., Dange, G. R., Lytrivis, P., Pagle, K., De Gloria, A. & Amditis, A. (2018). A Gamified Flexible Transportation Service for On-Demand Public Transport. IEEE Transactions on Intelligent Transportation Systems, 19(3), 921-933. ISSN 1524-9050. https://doi.org/10.1109/TITS.2018.2791643
Enoch, M., Potter, S., Parkhurst, G. & Smith, M. (2006). Why do demand responsive transport systems fail? In Transportation Research Board 85th Annual Meeting. Washington DC, USA.
Ertan Sevk, K. & Arkün Kocadere, S. (2024). A Review on Personalization of Gamified Learning Environments. Kuramsal Eg˘itimbilim, 17(4), 873–896. ISSN 1308-1659. https://doi.org/10.30831/akukeg.14788
Fullerton, T. (2024). Game Design Workshop: A Playcentric Approach to Creating Innovative Games. A K Peters/CRC Press, Boca Raton, 5 edition. ISBN 978-1-00-346026-8. https://doi.org/10.1201/9781003460268
Greysen, S. R., Changolkar, S., Small, D. S., Reale, C., Rareshide, C. A. L., Mercede, A., Snider, C. K., Greysen, H. M., Trotta, R., Halpern, S. D. & Patel, M. S. (2021). Effect of Behaviorally Designed Gamification with a Social Support Partner to Increase Mobility After Hospital Discharge: A Randomized Clinical Trial. JAMA Network Open, 4(3). ISSN 2574-3805. https://doi.org/10.1001/jamanetworkopen.2021.0952
Günther, M., Kacperski, C. & Krems, J. F. (2020). Can Electric Vehicle Drivers Be Persuaded to Eco-Drive? A Field Study of Feedback, Gamification and Financial Rewards in Germany. Energy Research & Social Science, 63, e101407. ISSN 22146296. https://doi.org/10.1016/j.erss.2019.101407
Helvaci, S., Senova, A., Kar, G. & Gören, S. (2018). Improving Driver Behavior Using Gamification. In Younas, M., Awan, I., Ghinea, G. & Catalan Cid, M., editors, MobiWIS 2018: Mobile Web and Intelligent Information Systems, pp. 193-204. Springer International Publishing, Cham CH. ISBN 978-3-319-97163-6. https://doi.org/10.1007/978-3-319-97163-6_16
Hsu, C. L. & Chen, M. C. (2018). How Does Gamification Improve User Experience? An Empirical Investigation on the Antecedences and Consequences of User Experience and Its Mediating Role. Technological Forecasting and Social Change, 132, 118-129. ISSN 0040-1625. https://doi.org/10.1016/j.techfore.2018. 01.023
Iacono, S., Vallarino, M. & Vercelli, G. V. (2020). Gamification in Corporate Training to Enhance Engagement: An Approach. International Journal of Emerging Technologies in Learning (iJET), 15(17), 69. ISSN 1863-0383. https://doi.org/10.3991/ijet.v15i17.14207
Inturri, G., Giuffrida, N., Ignaccolo, M., Le Pira, M., Pluchino, A., Rapisarda, A. & D’Angelo, R. (2021). Taxi vs. demand responsive shared transport systems: An agent-based simulation approach. Transport Policy, 103, 116-126. ISSN 0967-070X. https://doi.org/10.1016/j.tranpol.2021.01.002
Kalogiannakis, M., Papadakis, S. & Zourmpakis, A. I. (2021). Gamification in Science Education. A Systematic Review of the Literature. Education Sciences, 11(1), 22. ISSN 2227-7102. https://doi.org/10.3390/educsci11010022.
Klock, A. C. T., Gasparini, I., Pimenta, M. S. & Hamari, J. (2020). Tailored Gamification: A Review of Literature. International Journal of Human-Computer Studies, 144, e102495. ISSN 10715819. https://doi.org/10.1016/j.ijhcs.2020.102495
König, A., Kowala, N., Wegener, J. & Grippenkoven, J. (2019). Introducing a Mobility on Demand System to Prospective Users with the Help of a Serious Game. Transportation Research Interdisciplinary Perspectives, 3. ISSN 2590-1982. https://doi.org/10.1016/j.trip.2019.100079
Martí, P., Ibáñez, A., Julian, V., Novais, P. & Jordán, J. (2024a). Bus Ridership Prediction and Scenario Analysis through ML and Multi-Agent Simulations. ADCAIJ: Advances in Distributed Computing and Artificial Intelligence Journal, 13(1), e31866. https://doi.org/10.14201/adcaij.31866
Martí, P., Jordán, J. & Julian, V. (2024b). A flexible approach for Demand-Responsive Public Transport in Rural Areas. Computer Science and Information Systems, 21(1), 245-267. https://doi.org/10.2298/CSIS230115074M
Martí, P., Jordán, J., Novais, P. & Julian, V. (2025). Sustainable Demand-Responsive Transportation: A Case Study in Rural Guimarães. In Julian, V., Camacho, D., Yin, H., Alberola, J. M., Nogueira, V. B., Novais, P. & Tallón-Ballesteros, A., editors, Intelligent Data Engineering and Automated Learning – IDEAL 2024, pp. 147-158. Springer Nature Switzerland, Cham. ISBN 978-3-031-77738-7.
Matallaoui, A., Hanner, N. & Zarnekow, R. (2017). Introduction to Gamification: Foundation and Underlying Theories. In Stieglitz, S., Lattemann, C., Robra-Bissantz, S., Zarnekow, R. & Brockmann, T., editors, Gamification: Using Game Elements in Serious Contexts, Progress in IS, pp. 3-18. Springer International Publishing, Cham, CH. ISBN 978-3-319-45555-6. https://doi.org/10.1007/978-3-319-45557-0
McCrae, R. R. & Costa Jr., P. T. (1989). Reinterpreting the Myers-Briggs Type Indicator from the Perspective of the Five-Factor Model of Personality. Journal of Personality, 57(1), 17–40. ISSN 1467-6494. https://doi.org/10.1111/j.1467-6494.1989.tb00759.x
Melo, S., Gomes, R., Abbasi, R. & Arantes, A. (2024). Demand-Responsive Transport for Urban Mobility: Integrating Mobile Data Analytics to Enhance Public Transportation Systems. Sustainability, 16(11). ISSN 2071-1050. https://doi.org/10.3390/su16114367
Okreša Ðuric, B. (2022). Gamification in Smart and Sustainable Mobility - A Review and Roadmap. In Vrcˇek, N., Guàrdia, L. & Grd, P., editors, Proceedings of the Central European Conference on Information and Intelligent Systems, pp. 9-16. Faculty of Organization and Informatics, Varaždin, HR.
Okreša Ðuric, B., Peharda, T. & Martí, P. (2023). Towards a Gamified System to Influence Behaviour of Users in the Context of Smart Mobility. In Vrcˇek, N., de Marcos Ortega, L. & Grd, P., editors, Proceedings of the Central European Conference on Information and Intelligent Systems, pp. 9-16. Faculty of Organization and Informatics, Dubrovnik HR.
Phosanarack, M., Avril, E., Lepreux, S., Wallard, L. & Kolski, C. (2025). User-Centered Personalized Gamification: An Umbrella Review. User Modeling and User-Adapted Interaction, 35(1), 3. ISSN 1573-1391. https://doi.org/10.1007/s11257-024-09423-z
Qader Kheder, M., & Aree Ali, M. (2023). IoT-Based Vision Techniques in Autonomous Driving: A Review. ADCAIJ: Advances in Distributed Computing and Artificial Intelligence Journal, 11(3), 367–394. Retrieved from https://revistas.usal.es/cinco/index.php/2255-2863/article/view/28821
Rodrigues, L., Toda, A. M., Palomino, P. T., Oliveira, W. & Isotani, S. (2020). Personalized Gamification: A Literature Review of Outcomes, Experiments, and Approaches. In Eighth International Conference on Technological Ecosystems for Enhancing Multiculturality, pp. 699-706. ACM, Salamanca Spain. ISBN 978-1-4503-8850-4. https://doi.org/10.1145/3434780.3436665
Ruiz-Navas, S., Ackaradejraungsri, P. & Dijk, S. (2024). Are There Literature Reviews About Gamification to Foster Inclusive Teaching? A Scoping Review of Gamification Literature Reviews. Frontiers in Education, 9, 1306298. ISSN 2504-284X. https://doi.org/10.3389/feduc.2024.1306298
Schasché, S. E., Sposato, R. G. & Hampl, N. (2022). The dilemma of demand-responsive transport services in rural areas: Conflicting expectations and weak user acceptance. Transport Policy, 126, 43–54.
Schatten, M., Okreša Ðurić, B. & Protrka, R. (2021). Conceptual Architecture of a Cognitive Agent for Telemedicine Based on Gamification. In Vrcˇek, N., Pergler, E. & Grd, P., editors, Proceedings of the Central European Conference on Information and Intelligent Systems, pp. 3. Faculty of Organization and Informatics, Varaždin, HR.
Schell, J. (2019). The Art of Game Design: A Book of Lenses. Taylor & Francis Group, Boca Raton, US-FL, 3 edition. ISBN 978-1-138-63209-7.
Spanellis, A., Mandhani, J., Aravena, C. & Upadhya, S. D. (2023). Eliciting Attitudes to Sustainable Transportation with Gamification. Research Report, Heriot-Watt University, Edinburgh UK.
Xiao, Y. & Hew, K. F. (2024). Personalised Gamification Enhances Student Participation but Produces Mixed Effects on Emotional and Cognitive Engagements: A Systematic Review. Interactive Learning Environments, 32(10), 7014–7040. ISSN 1049-4820. https://doi.org/10.1080/10494820.2023.2299977.
Zeybek, N. & Saygı, E. (2023). Gamification in Education: Why, Where, When, and How? —A Systematic Review. Games and Culture. ISSN 1555-4120, 1555-4139. https://doi.org/10.1177/15554120231158625
Zigrand, L., Alizadeh, P., Traversi, E. & Wolfler Calvo, R. (2021). Machine learning guided optimization for demand responsive transport systems. In Joint European Conference on Machine Learning and Knowledge Discovery in Databases, pp. 420–436. Springer.
Zigrand, L., Calvo, R. W., Traversi, E. & Alizadeh, P. (2023). Optimization-driven Demand Prediction Framework for Suburban Dynamic Demand-Responsive Transport Systems. In IJCAI, pp. 6335–6342.
Zinke-Wehlmann, C. & Friedrich, J. (2019). Commute Green! The Potential of Enterprise Social Networks for Ecological Mobility Concepts. In Camarinha-Matos, L. M., Afsarmanesh, H. & Antonelli, D., editors, Collaborative Networks and Digital Transformation, IFIP Advances in Information and Communication Technology 568, pp. 128–139. Springer International Publishing, Torino, IT. ISBN 978-3-030-28463-3. ISSN 1868-4238. https://doi.org/10.1007/978-3-030-28464-0_12
_______________________________