ADCAIJ: Advances in Distributed Computing and Artificial Intelligence Journal
Regular Issue, Vol. 13 (2024), e31640
eISSN: 2255-2863
DOI: https://doi.org/10.14201/adcaij.31640
An Ensemble Based Machine Learning Classification for Automated Glaucoma Detection
Digvijay J. Pawara, Yuvraj K. Kanseb and Suhas S. Patilc
a Research Scholar, Rayat Institute of Research and Development, Satara and Shivaji University, Kolhapur (M.S.), India
b Associate Professor, Dept. of Electronics Engineering, K.B.P. College of Engineering, Satara (M.S.), India
c Associate Professor and Head, Dept. of Electronics Engineering, K.B.P. College of Engineering, Satara (M.S.), India
ABSTRACT
Glaucoma is an irredeemable eye disease that causes sight degeneration and is the fourth leading cause of vision impairment as per the World Report on Vision 2019. Several techniques exist for the screening, detection, treatment, and rehabilitation of glaucoma. But still, they are not sufficient to have control over this disease to prevent further vision loss. Studies done on the prevalence of glaucoma have reported a high proportion of undiagnosed patients. Late diagnosis is related to an increased risk of glaucoma associated with visual disability. For the effective management or prevention of blindness, the importance of early diagnosis of glaucoma cannot be underestimated. This paper has proposed an approach for effectively extracting the key features of colour retinal fundus images and categorizing them as normal or glaucomatous. The novel approach of an ensemble machine learning technique has been implemented with an Automated Weightage Based Voting (AWBV) algorithm. This paper has been designed to evaluate the performance of Probabilistic Neural Networks (PNN), K-Nearest Neighbour (KNN), Support Vector Machines (SVM), Naïve Bayes (NB) and Logistic Regression (LR) as individual and ensemble classifiers. It includes the extraction of fused features from various retinal fundus image datasets. The proposed Combined Features Fused Classifier (CF2C) model has had a remarkable performance with the IEEE DataPort image dataset, achieving an ensembled prediction accuracy of 96.25 %, a sensitivity of 95.83 % and a specificity of 96.67 % which are better results than those of the five classifiers individually.
KEYWORDS
eye anatomy; early glaucoma; machine learning; ensemble classifier; Combined Features Fused Classifier
1. Introduction
Retinal imaging plays a vital part in a variety of applications such as disease detection and person identification. A variety of things can go wrong in any of the eye's structures, resulting in vision loss and blindness. Blindness and visual impairment were formerly handled outside the purview of Non-Communicable Diseases (NCDs). In view of the current significant epidemiological transition in the causation of blindness, a substantial reduction in pathogenic causes of blindness such as trachomatous blindness, measles, and vitamin A deficiencies; however, there is an increase in non-communicable causes such as uncorrected refractive error, cataract, diabetic retinopathy, glaucoma, and so on.
Glaucoma was most likely documented as a disease in the 17th century. This term was taken from the Greek term 'glaukЄoma', which means «cataract or opacity of the lens», which reflects a lack of understanding of the disease process at the time because cataracts and glaucoma had not separated (Saxena et al., 2013). Glaucoma has now regarded as a set of disorders with similar terminal features that impact the optic nerve. Glaucoma is an optic nerve disorder that causes blurred vision or blindness. The optic nerve is gradually injured, generally as a result of increased intraocular pressure (IOP), also known as Ocular Hyper-Tension (OHT).
As per the findings in the World Report on Vision 2019 by the World Health Organization (WHO) the prevalence of eye diseases is to increase significantly as the population ages. According to projections from the report, globally, by 2030 there will be 1.4 billion people with eye disorders over the age of 60, up from 962 million in 2017. While the number of people over the age of 80 and more will be expected to rise to 202 million by 2030 from 137 million in 2017. As a result of these demographic changes, the number of people with severe eye conditions that impair vision will significantly increase. The number of people affected by glaucoma is predicted to grow by 1.3 times, from 76 million in 2020 to 95.4 million in 2030 (World Health Organization 2019).
1.1. Machine Learning in Healthcare
Traditionally, optometrists and ophthalmologists have used roughly similar strategies to diagnose glaucoma. These techniques or strategies relied heavily on ophthalmologists' manual observations, resulting in nearly 80 % of glaucoma cases going undetected (Sarhan et al., 2019). Nowadays, experts employ a variety of tests to identify glaucoma. Perimetry, tonometry, gonioscopy, pachymetry and ophthalmoscopy are a few of them. A thorough eye exam, including dilated stereoscopic, gonioscopy, applanation tonometry, slit lamp, and evaluation of the optic disc, cup, and retina, is necessary to diagnose glaucoma eye disease, which is often done clinically.
Recent years have seen the development of machine learning (ML), which is a part of artificial intelligence (AI). ML has become a key element in many analytical and practical procedures, in the areas of life sciences and medicine. Classification is an essential part of clinical applications since it may be used to expressly identify particular diseases. Soon, the glaucoma diagnosis process and treatment will significantly rely on artificial intelligence. Across the different fields of healthcare, a model based on machine learning may help to improve clinical judgments or even update them (Ahuja, 2019).
1.2. Need for Ensemble Approach
Machine learning models are susceptible to biases and variances, two types of errors that impact their performance. Bias, in this sense, refers to the discrepancy between expected and observed values. This occurs when a model oversimplifies the data, neglecting its diversity. The result is a simple model that is unable to represent complex patterns of information. As a result, the model makes errors both in the testing phase, when it is assessed using fresh, untested data, and in the training phase, when it learns from the supplied data. In some cases, a model might seemingly perform well during training by following arbitrary information as if it were a valid data pattern. This results in low bias on the training data. But the model tends to underperform and show more variance when applied to test data. Higher variance indicates that the model is too sensitive to the specific details of the training data and fails to generalize effectively to new, unseen data. Achieving a balance between bias and variance is crucial for creating machine learning models that generalize well and perform reliably across various datasets.
The more efficient way to find the ideal balance between bias and variance in machine learning models is to use the ensemble classification approach. The ensemble technique improves overall performance by combining predictions from multiple models (Taj et. al., 2021). Since these models are typically diverse, there are differences among them in the ways they make mistakes. Ensemble can mitigate the limitations of individual models enabling it to successfully address concerns with bias and variation due to its diversity. To be more specific, ensemble approaches such as Gradient Boosting and Random Forests integrate the expertise of multiple models to get predictions that are more accurate and dependable. By merging the outputs of multiple models, the ensemble technique tends to minimize variance and reduce overfitting (Abdar et al., 2021).
2. Eye Anatomy
The human eye is an element of the visual system and plays an important part in defining the quality of life of an individual. The eye is a vital organ that reacts to light and serves functions such as vision, accommodation, colour perception, blinking, peripheral vision etc. Its components include the cornea, iris, pupil, lens, retina, macula, optic nerve, choroid, and vitreous, as shown in Figure1.
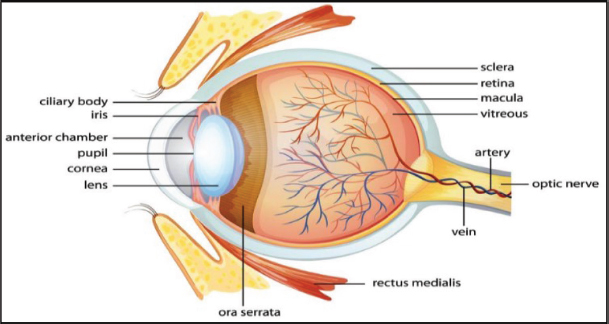
Figure 1. The human eye structure
The cornea, a smaller frontal unit that is clear and more curved, is connected to the sclera, a larger white unit. The eye is made up of three coatings:
i) Outermost layer - The cornea and sclera make up the outermost layer, known as the fibrous tunic.
ii) Middle layer - The choroid, ciliary body, and iris comprise the middle layer. It is sometimes referred to as the vascular tunic or the uvea.
iii) Innermost layer - The deepest layer is the retina, which receives circulation from the vessels of the choroid as well as the retinal vessels, both of which may be viewed using an ophthalmoscope.
The clear fluid within the eye is supplied by the ciliary body, which is a tiny, round structure situated beneath the iris or the coloured region of the eye.
The aqueous humor, or aqueous fluid, passes behind the eye and through the pupil, or central aperture in the centre of the iris. The fluid then enters the anterior chamber, which is defined as the space between the adjacent cornea and the front of the iris. The aqueous exits the eye via the drainage angle, which is formed within the anterior chamber. This angle and the sclera, which is the eye's white component, filter the aqueous before entering the network of veins outside the eye. Any disturbance in this flow, including injury to the eye, can result in structural abnormalities in the eye (Kolb, 2003). Abnormalities affect the functionalities of the specific components present in the eye, leading to an eye disorder.
2.1. Content-Based Image Recognition
Traditional image identification techniques are time-intensive and rely on keywords or labels. The performance of these techniques can vary when there are changes in the recognized object, especially with alterations in personal descriptions of the image. Personal descriptions of the image refer to subjective or individualized explanations or interpretations of the content depicted in a given image. To address many of the problems, the content-based image recognition system makes use of the contents of the original image. By utilising visual «features», such as colour, form, and intensity, content-based image recognition enables the description and identification of objects of interest as a collection of structural primitives. The different medical features that determine diseases such as the glaucoma, are also visible on the images (Salvi et al., 2021).
3. Related Work
Agarwal et al. (2015) proposed an automated, computer-assisted method that can quickly and effectively detect glaucoma. In addition to the Cup-to-Disc Ratio (CDR), the Rim-to-Disc Ratio (RDR) is another ocular parameter that can be taken into account to strengthen the system and increase the accuracy of glaucoma diagnosis. The fundus photos were further classified as non-glaucomatous or glaucomatous using the SVM classifier. When the experimental results were compared to ophthalmology results, it was discovered that the experimental results had a high accuracy of 90 %. Additionally, the suggested approach was quicker and required less calculation. Nonetheless, it limited the number of extracted features, which could have further improved the accuracy.
Salam et al. (2015) proposed that glaucoma progression could be halted if discovered at an early stage. Glaucoma has no early warning signs, and the only indicator of the disease's onset is a structural alteration in the eye. Machine learning is also commonly utilized to help ophthalmologists to detect glaucoma. By combining CDR with intensity data and hybrid textural, the proposed methodology offered a unique algorithm to identify glaucoma. The combination of hybrid and CDR features had increased the system's sensitivity to 1, accuracy to 0.92 and specificity to 0.88.
The method proposed in the paper of Juliansyah and Nugraha (2019) had a 91.25 % accuracy rate, accurately detecting the notched area of the ISNT in 73 shots from the DRISTHI-GS retinal image database; while failing to do so in eight other images due to insufficient brightness. The neuro-retinal rim is located between the optic cup and the optic disc. The neural retinal rim is divided into four sections: inferior, superior, nasal, and temporal (ISNT). The shape of the neuronal retinal rim can be used to identify glaucoma. According to the ISNT criteria, the areas in a normal image are arranged from largest to smallest. However, in glaucoma, the superior and inferior areas are typically attacked first, resulting in narrowing or notching and breaking the ISNT regulations.
A large number of deep learning (DL) models have been created for the accurate diagnosis of glaucoma. Saxena et al. (2020) presented the construction of the convolutional neural network (CNN) for accurate glaucoma detection based on deep learning. In this instance, the dropout technique was also applied to achieve the required performance in the glaucoma detection. The investigations made use of the SCES and ORIGA datasets. The analysis was run on both datasets and the accuracy results for the SCES and ORIGA datasets, respectively, were 0.822 and 0.882.
Joshua et al. (2020) proposed the evaluation of CDR, which is one of the regularly employed glaucoma detection techniques. The findings indicated that a threshold of 0.6 performs better than the conventional CDR threshold of 0.5 for the detection of glaucoma. Furthermore, because the CDR technique depends on threshold values, it is inefficient at detecting glaucoma in its early stages. To solve this problem, the authors suggested an approach that consisted of an XGB classifier which was highly accurate and performed better in the identification of early to moderate glaucoma.
Song et al. (2021) suggested that their proposed architecture was more efficient and straightforward than the majority of historical automatic glaucoma detection methods. The estimated accuracy was 0.97, specificity 0.98, and sensitivity 0.95, which served as proof of the architecture’s effectiveness. In the comparison of the adopted CNN model to deep CNNs, such as ResNet152 and Google Net, simplicity was demonstrated. Additionally, the resilience of the proposed approach was superior to all the previous archived work, as seen by the associated standard errors. To make it simple for others to replicate the findings, the proposed framework was illustrated in this research using understandable diagrams and precise mathematical notations.
Manassakorn et al. (2021) proposed that the defects in the retinal nerve fibre layer (RNFL), which are distinctive of the glaucoma neurodegenerative illness, are visible. On optic disc pictures, the authors used machine learning classifiers to distinguish between RNFLs that are defective (d-RNFL) and RNFLs that are intact (i-RNFL). The optic disc images were then automatically tagged with a semicircle to distinguish between d-RNFL and i-RNFL. The RGB intensities of the two profiles and additional colour spaces were gathered. 2,051 profiles were collected and applied to three classifiers namely SVM, KNN and ensemble RUS Boosted Trees, which gave accuracies of 81.8 %, 79.4 % and 79.2 %, respectively.
4. Proposed Methodology
4.1. Need for Automatic and Early Detection
Pressure inside the eye develops if the visual system is obstructed or not working properly, which in turn destroys the optic nerve. This leads to a gradual loss of eyesight in those with the most prevalent form of glaucoma.
Generally, optometrists and ophthalmologists utilized general comparative procedures with manual observations to analyse glaucoma. Currently, specialists utilize different tests to recognize glaucoma, but the question remains the same: how to detect it at a very early stage? Several glaucoma detection systems based on image processing attempt to identify structural elements in fundus images, such as Cup-To-Disc ratio (CDR), Optic Nerve Head (ONH), Neuro-Retinal Rim (NRR) area etc., as well as non-structural parameters such as intraocular pressure (IOP) and colour intensity. These indicators, however, are insufficient to detect early alterations in glaucoma.
Thus, it may be important to recognize and evaluate some additional characteristics. Following an extensive review of the state of the art on early glaucoma detection, it is observed that some features from retinal image plays important role in the identification of early glaucoma disease. It has been found that some characteristics, including the inferior-superior-nasal-temporal (ISNT), the cup and rim's colour and the retinal nerve fibre layer (RNFL), could be the risk indicators of early-stage glaucoma.
For early detection of glaucoma through the classification of fused features, the Combined Features Fused Classifier (CF2C) model is proposed in the present article. This model works with multiple features from the retinal fundus images. The selection has been carried out as outlined in Table 1 below, according to medical, intensity and shape features.
Table 1. Fused feature selection for the proposed system
Features |
Variables |
Medical |
CDR, ONH, ISNT Ratio, RNFL Thickness |
Intensity |
Rim Colour, Disc Colour, Cup Colour |
Shape |
NRR, Disc Area, Cup Area |
4.2. Ensemble Approach for Glaucoma Detection
The Automated Weightage Based Voting (AWBV) algorithm is proposed with a new voting method for ensembling the significance of each of the five machine learning classifiers. This algorithm works with both fused and individual features as well as ensemble machine-learning techniques, as described below and the same is depicted in Figure 2.
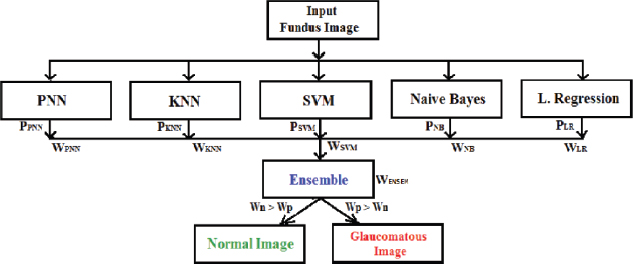
Figure 2. Proposed ensemble classification logic
• Get the individual accuracy weights of five classifiers as PNN, KNN, SVM, NB and LR. For example- PPNN is the probability of a PNN classifier and WPNN is the weight of a PNN classifier.
• Find the sum of the weightage of individual positivity and negativity.
• If the positivity weightage is more than the negativity weightage (Wp > Wn) then the input testing image is glaucomatous, otherwise it is normal.
The process flow of the proposed Combined Features Fused Classifier (CF2C) model is depicted in Figure 3.
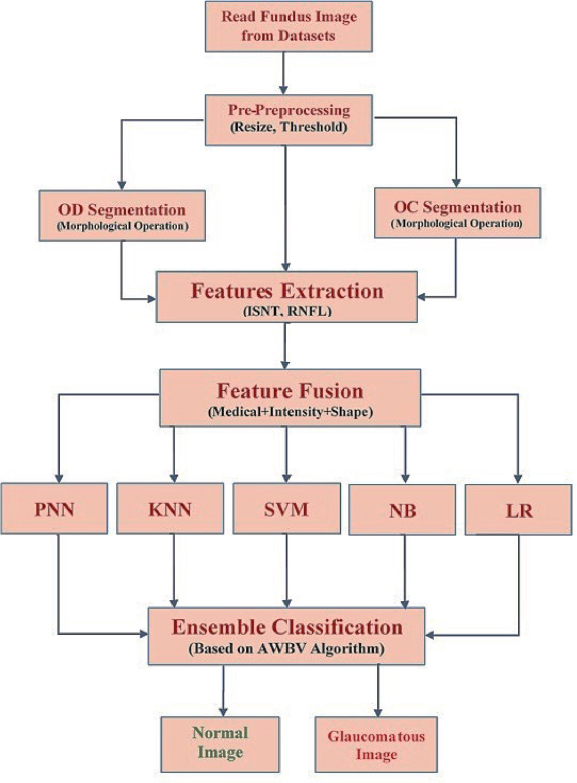
Figure 3. Proposed flowchart for automated glaucoma detection
5. Dataset Description
It is essential to have pictorial information to work with when assessing any eye condition. The retinal images can be recorded using a variety of imaging techniques such as Fundus, Optical Coherence Tomography (OCT), Ultrasound (US), and Heidelberg Retina Tomography (HRT) (Kostanyan T. & Wollstein G. 2015).
For the purpose of medical analysis, hospitals, universities, institutions, or individuals gather datasets of retinal images. Most retinal imaging databases are made publicly available for usage by researchers and ophthalmologists, although some databases are kept private. The optic papilla is highlighted in a variety of retinal photographs that can be found in public databases for glaucoma investigations. These databases are designed for use by automated systems, with the aim of addressing the challenges of clinical imaging, particularly in the automatic detection of glaucoma.
5.1. Drishti-GS Dataset
There are various resolutions of 31 fundus images from healthy eyes and 70 fundus photos from glaucoma-affected eyes; approximately, the resolution is of 2050 x 1750 pixels. The age range of the chosen participants was 40 to 80. There are two subsets in this database (Sivaswamy et al., 2014); a training subset and a testing subset. This dataset is apportioned into training and test image sets individually. The training set includes 50 images, with ground truth data on region boundary, segmentation soft map and cup-to-disc ratio for each image. On the other hand, the testing set contains 51 images and the ground truth for the test set is accessible just upon enlistment. Image size and resolution is 2896 x 1944 pixels and the .png uncompressed image format is used. The retinal image is captured from a fundus camera.
5.2. Kaggle Dataset
The Kaggle Dataset has been downloaded from the Kaggle website which is under the name «Glaucoma Detection - OCT Scans - Retinal Imaging» (Kaggle Dataset, 2022). This dataset contains images or OCT scans of the eye. It is available in the folder named as Fundus Train Val_Data. In it there is a subfolder called Fundus Scans Sorted, which in turn contains two folders named Train and Validation. The training images amount to a total of 520. From among the total, there are 386 glaucoma negative images and 134 glaucoma positive images. The validation folder contains 96 glaucoma-negative images and 34 glaucoma-positive images.
5.3. IEEE DataPort Dataset
The glaucoma data is available at the IEEE DataPort, named «1450 Fundus Images with 899 Glaucoma Data and 551 Normal Data». The dataset was submitted by Wheyming Tina Song. This glaucoma dataset contains fundus images and clinical information for both eyes of the same patient. As the name suggests, this dataset comprises a total of 1450 fundus images of which 899 are glaucoma images and 551 are normal. The descriptions of the data and the dates on which the related images were gathered are supplanted by 0, which is dark or black (Song, 2020).
The images from the mentioned dataset have been scrutinized as shown in Table 2 and pertinent images have been used for training and testing purposes for the proposed model, as depicted in Figure 4 below.
Table 2. Image datasets used for ensemble classification
Image Dataset |
Normal |
Glaucomatous |
Total Images |
Kaggle |
150 |
150 |
300 |
Drishti-GS |
28 |
73 |
101 |
IEEE DataPort |
260 |
308 |
568 |
Total |
438 |
531 |
969 |
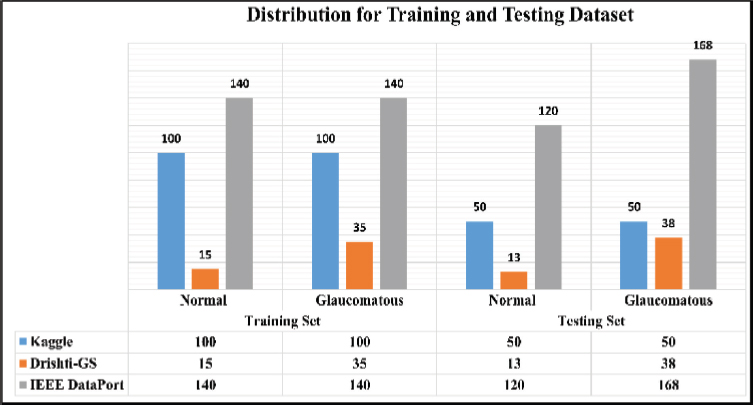
Figure 4. Distribution for training and testing dataset
6. Results and Discussion
6.1. Experimental Set-up
• Hardware Used: Intel Core i3, Intel Motherboard, 4GB RAM, 140GB SSD Hard Disk.
• Software Used: Windows 10 (64-bit), Matlab Tool.
6.2. Performance Measures
The performance analysis for the different image datasets and classifiers has been done with Accuracy, Sensitivity, Specificity, ROC Curve, True Positive (TP) Value, False Positive (FP) Value and with Confusion Matrix. These performance parameters have been measured by using the equations mentioned below.
where,
TP is for glaucomatous images that were accurately identified as glaucomatous.
FP is for normal images that were inaccurately identified as glaucomatous.
TN is for normal images that were accurately identified as normal.
FN is for glaucomatous images that were inaccurately identified as normal.
The proposed model has been evaluated using a test dataset after being trained using a MATLAB tool. Instead of simply depending on one classifier, we pursued the best option at each split. The unique ensemble approach allows for the inclusion of samples from several classifiers. Choosing which highlights to use and which to pose at each split is another important decision. This ensemble technique ensures more successful outcomes than single classifier implementations by making a final judgment after compiling the effects of each classifier that was utilized.
The analysis was done after having implemented the algorithm for each of the selected classifiers, namely, PNN, KNN, SVM, Naive Bayes and Logistic Regression. The accuracies of all the classifiers were ensembled with the AWBV algorithm and then the ensembled prediction performance was achieved for Drishti-GS, Kaggle and IEEE DataPort, as depicted in Figures 5, 6 and 7, respectively. The experimental results in Figure 8 compare the accuracy of individual and ensemble classifiers for each dataset. The performance of the ensemble classifier for the IEEE DataPort dataset is depicted in the Confusion Matrix in Figure 9 and in the Receiver Operating Characteristic (ROC) curve in Figure 10. Table 3 gives the performance analysis of the proposed ensemble classifier for three different datasets.
Table 3. Performance analysis of the proposed ensemble classifier for different datasets
Dataset Used |
Accuracy (%) |
Sensitivity (%) |
Specificity (%) |
TP Value (%) |
FP Value (%) |
Drishti-GS |
82.22 |
100.00 |
33.33 |
80.49 |
66.67 |
Kaggle |
78.00 |
100.00 |
56.00 |
69.44 |
44.00 |
IEEE DataPort |
96.25 |
95.83 |
96.67 |
96.64 |
3.33 |
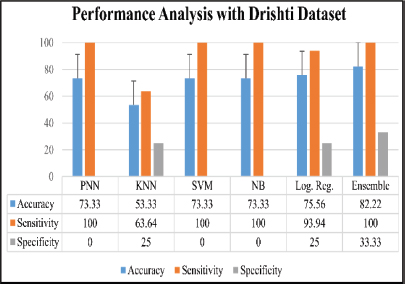
Figure 5. Performance analysis with Drishti-GS dataset
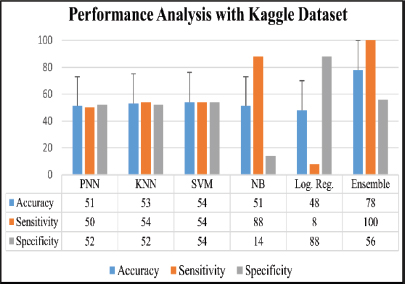
Figure 6: Performance analysis with Kaggle dataset.
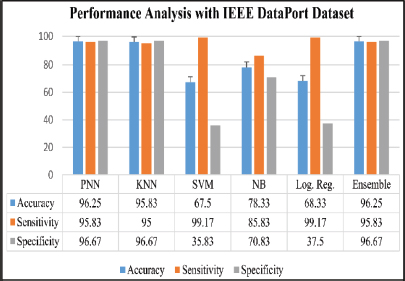
Figure 7. Performance analysis with IEEE DataPort Dataset
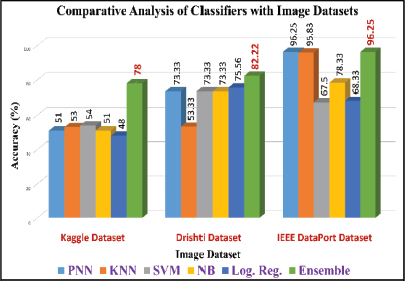
Figure 8. Comparative analysis of classifiers with three image datasets
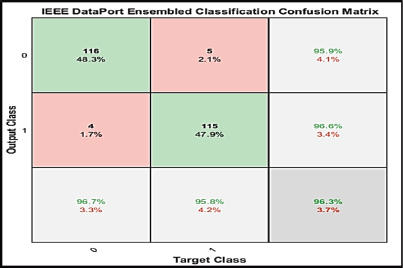
Figure 9. Confusion matrix of ensemble classifier with IEEE DataPort Dataset
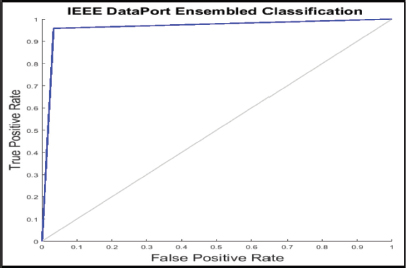
Figure 10. ROC curve for IEEE DataPort Dataset
The proposed Combined Features Fused Classifier (CF2C) model for automated glaucoma diagnosis utilizes a machine learning ensemble technique that would be useful to eye specialists at various phases of the eye care process, from preventative care to prognosis, accompanied by the use of appropriate treatment and medical guidance. The AWBV algorithm has worked best with the IEEE DataPort dataset, achieving an accuracy of 96.25 %, a sensitivity of 95.83 % and a specificity of 96.67 % for predicting fundus images as normal or glaucomatous.
7. Conclusion
The development as well as assessment of an ensemble classification strategy for automated glaucoma detection has been the primary focus of this research. We aimed to improve the accuracy and predictability of glaucoma screening, which would help in early identification and prompt treatment by exploiting the potential of ensemble learning approaches. Along with increased accuracy and specificity, the suggested ensemble approach has demonstrated robustness against changes in the quality of images.
It is crucial to note that while machine learning algorithms can help to detect glaucoma, they are not a substitute of a thorough eye exam conducted by a certified ophthalmologist. These algorithms are designed to help clinicians in making more precise diagnoses and productive decisions, overall, they provide support in the prevention and management of glaucoma.
The proposed system can be utilized by the practitioner to get a first opinion. This work contributes advances in each stage of image processing. Further advances are necessary in terms of the number of features to be extracted from retinal images, the number of image datasets used for training and testing, image pre-processing steps, optimized classification techniques, and/or the use of different image modalities for comparison of the performance of the system.
In conclusion, this research work contributes to the field of glaucoma detection by providing a reliable, non-invasive, and cost-effective solution that can aid in the early diagnosis and management of this sight-threatening disease. We hope that this work will pave the way for future advances in the field and, ultimately, improve the quality of life of people who are at risk of suffering from glaucoma.
References
Abdar, M., Pourpanah, F., Hussain, S., Rezazadegan, D., Liu, L., Ghavamzadeh, M., Fieguth, P., Cao, X., Khosravi, A., Acharya, U. R., Makarenkov, V., & Nahavandi, S. (2021). A Review of Uncertainty Quantification in Deep Learning: Techniques, Applications and Challenges. Information Fusion, 76, 243-297. ISSN 1566-2535.
Agarwal, A., Gulia, S., Chaudhary, S., Malay, K. D., Carlos, M. T., & Jesús, B. A. (2015). A Novel Approach to Detect Glaucoma in Retinal Fundus Images Using Cup-Disk and Rim-Disk Ratio. In 4th International Work Conference on Bio-inspired Intelligence (IWOBI), 139-144.
Ahuja, A. S. (2019). The Impact of Artificial Intelligence in Medicine on the Future Role of the Physician. Peer J, 7, e7702. https://doi.org/10.7717/peerj.7702
Joshua, A. O., Mabuza-Hocquet, G., & Nelwamondo, F. V. (2020). Assessment of the Cup-To-Disc Ratio Method for Glaucoma Detection. In 2020 IEEE International SAUPEC/RobMech/PRASA Conference, 1-5.
Juliansyah, A., & Nugraha, G. S. (2019). Segmentation of Neuro Retinal Rim Area using Histogram Feature-based for Glaucoma Detection in Retinal Fundus Image. In IEEE International Conference on Advanced Computer Science and Information Systems, 119-124.
Kaggle Dataset. (2022). Glaucoma Detection. Retrieved from https://www.kaggle.com/datasets/sshikamaru/glaucoma-detection.
Kolb, H. (2003). How the Retina Works. American Scientist, Sigma Xi, The Scientific Research Society, 91. Law Kumar Singh, H., Garg, H., & Pooja. (2020). Automated Glaucoma Type Identification Using Machine Learning or Deep Learning Techniques. In O. P. Verma et al. (Eds.), Advancement of Machine Intelligence in Interactive Medical Image Analysis, Algorithms for Intelligent Systems. Springer Nature Singapore Pte. Ltd., https://doi.org/10.1007/978-981-15-1100-4_12
Kostanyan, T., & Wollstein, G. (2015). Ophthalmic Imaging Tools to Detect Glaucoma Progression. Journal-Ophthalmic Imaging Tools to Detect Glaucoma Progression. 8(1), 37–42. https://doi.org/10.17925/usor.2015.8.1.37
Manassakorn, A., Khamwan, K., Owasirikul, D., Itthipanichpong, R., Sa-Ing, V., & Aue-thavekiat, S. (2021). Retinal Nerve Fiber Layer Defect Detection Using Machine Learning on Optic Disc Photograph. In 2021 IEEE EMBS International Conference on Biomedical and Health Informatics (BHI), 1-4.
Salam, A. A., Akram, M. U., Wazir, K., Anwar, S. M., & Majid, M. (2015). Autonomous Glaucoma Detection from Fundus Image Using Cup to Disc Ratio and Hybrid Features. In 2015 IEEE International Symposium on Signal Processing and Information Technology, 370-374.
Salvi, M., Acharya, U. R., Molinari, F., & Meiburger, K. M. (2021). The Impact of Pre- and Post-Image Processing Techniques on Deep Learning Frameworks: A Comprehensive Review for Digital Pathology Image Analysis. Computers in Biology and Medicine, 128, 104-129. https://doi.org/10.1016/j.compbiomed.2021.104129
Sarhan, A., Rokne, J., & Alhajj, R. (2019). Glaucoma Detection Using Image Processing Techniques: A Literature Review. Computerized Medical Imaging and Graphics, 78, 101657. https://doi.org/10.1016/j.compmedimag.2019.101657
Saxena, R., Singh, D., & Vashist, P. (2013). Glaucoma: An Emerging Peril. Indian Journal of Community Medicine, 38(3).
Saxena, A., Vyas, A., Parashar, L., & Singh, U. (2020). A Glaucoma Detection Using Convolutional Neural Network. In 2020 International Conference on Electronics and Sustainable Communication Systems, 815-820.
Sivaswamy, J., Krishnadas, S. R., Joshi, G. D., Ujjwal, M. J., & Tabish, S. (2014). Drishti-GS: Retinal Image Dataset for Optic Nerve Head (ONH) Segmentation. In 2014 IEEE 11th International Symposium on Biomedical Imaging, 53–56. https://doi.org/10.1109/isbi.2014.6867807
Song, W. (2020). 1450 fundus images with 899 glaucoma data and 551 normal data. IEEE DataPort.
Song, W. T., Lai, C., & Su, Y. Z. (2021). A Statistical Robust Glaucoma Detection Framework Combining RetiNex, CNN, and DOE Using Fundus Images. IEEE Access, 9, 103772-103783.
Taj, I. A., Sajid, M., & Karimov, K. S. (2021). An Ensemble Framework Based on Deep CNNs Architecture for Glaucoma Classification using Fundus Photography. Mathematical Bio-Sciences and Engineering, 18(5), 5321-5347.
World Health Organization. (2019). World report on vision. World Health Organization. License: CC BY-NC-SA 3.0 IGO. https://apps.who.int/iris/handle/10665/328717.