ADCAIJ: Advances in Distributed Computing and Artificial Intelligence Journal
Regular Issue, Vol. 14 (2025), e31609
eISSN: 2255-2863
DOI: https://doi.org/10.14201/adcaij.31609
Resource Analysis in Blockchain Transactions: An Opcode-Driven Multilayer Graph Approach
Inas Hasnaoui, Maria Zrikem, and Raja Elassali
Laboratory for Research in Intelligent and Durable Technologies (LarTID), National School of Applied Sciences, Cadi Ayyad University, Marrakech, 40 000, Morocco
inas.hasnaoui@ced.uca.ma, m.zrikem@uca.ma, r.elassali@uca.ma
ABSTRACT
Blockchain technology has experienced significant growth across various industries. However, challenges such as scalability, high transaction fees, and resource inefficiencies continue to limit its full potential. This paper presents a novel approach using a multilayer graph to model and analyze blockchain transactions, with a focus on resource consumption—specifically opcode execution and gas usage. By categorizing accounts into distinct layers—Externally Owned Accounts (EOAs), smart contracts, oracles, and cross-chain bridges—the graph-based model captures interactions across these account types. Through transaction trace analysis, we extract opcode usage and gas consumption, applying graph-theoretical metrics such as node scoring and edge weighting to identify critical nodes and resource-intensive transactions. Our findings provide new insights into resource-heavy behaviors, revealing optimization opportunities to reduce transaction costs and improve scalability. Additionally, the approach aids in anomaly detection and smart contract optimization, enhancing the cost-effectiveness and performance of blockchain systems.
KEYWORDS
blockchain; multilayer graph; EVM Opcode; EOA; smart contracts; oracles; cross-chain bridges; gas consumption
1. Introduction
Blockchain technology has emerged as a transformative force across various industries since the launch of Bitcoin (Nakamoto, 2018). Initially developed as a decentralized digital currency, Bitcoin introduced the world to distributed ledger technology. Ethereum further expanded on this innovation by introducing smart contracts, which are self-executing contracts that automate complex processes without intermediaries (Ethereum.org, ; Yue et al., 2021). These smart contracts form the foundation of decentralized applications (DApps), enabling blockchain to play a crucial role in industries such as finance, healthcare, and supply chain management(Antonopoulos and Wood, 2018; Wu et al., 2021; Wu, 2019). However, executing these contracts requires computational resources in the form of opcodes—low-level instructions processed by the Ethereum Virtual Machine (EVM). Each opcode execution consumes gas, the unit of measure for computational work, directly affecting transaction fees. Understanding how gas is consumed through opcode execution is essential to improving the cost- effectiveness and efficiency of blockchain systems.
One of the core challenges in scaling blockchain systems lies in finding a balance between scalability, security, and decentralization—often referred to as the blockchain trilemma (Kim et al., 2018). Ethereum, like many other blockchain platforms, struggles to scale without compromising security or decentralization. A significant contributor to this challenge is the high gas fees associated with smart contract transactions, which are influenced by the type and complexity of opcodes used. While some studies have examined gas costs and transaction throughput, there remains limited analysis on detailed resource consumption patterns, particularly at the opcode level. Furthermore, conventional analytical approaches often fail to capture the complexity of interactions and resource usage among different types of accounts. Given blockchain’s inherent peer-to-peer (P2P) nature (Cortes-Goicoechea and Bautista-Gomez, 2021), it lends itself well to graph-based analysis, yet the application of multilayer graphs to model these intricate relationships has been underexplored.
In response to these challenges, this paper introduces a novel approach that leverages graph theory to analyze Ethereum transactions, viewing the blockchain as a P2P network of interconnected accounts. To capture the full complexity of interactions, we propose a multilayer graph representation that categorizes different account types—Externally Owned Accounts (EOAs), smart contracts, oracles, and cross-chain bridges—into distinct layers. This approach enables a detailed analysis of transaction flows and resource utilization across various account types. By applying graph-theoretical metrics, such as node scoring and edge weighting, we can identify resource-heavy nodes, uncover critical transaction patterns, and reveal optimization opportunities. This approach not only enhances the understanding of resource dynamics in blockchain ecosystems but also provides a robust approach for anomaly detection and smart contract optimization.
The key contributions of this paper are:
•The development of a multilayer graph to model Ethereum transactions, categorizing accounts into distinct layers.
•A comprehensive analysis of resource consumption patterns across various account types.
•The application of graph-theoretical metrics to analyze opcode execution and gas usage.
•The use of graph-based analysis to enable anomaly detection in transaction behavior.
This paper is organized as follows: Section 2 reviews the related work on blockchain resource consumption, gas fees, and graph-based analysis techniques. Section 3 presents our proposed multilayer graph model, detailing how Ethereum accounts are categorized into distinct layers. Section 4 outlines the methodology used for data collection, transaction trace extraction, and graph construction. Section 5 provides a thorough results and analysis of resource usage and transaction patterns across different account types. Section 6 explores the broader implications of our approach. Finally, Section 7 concludes the paper by summarizing the key findings and discussing directions for future work to enhance this methodology.
2. Related Works
In recent years, blockchain analysis has gained significant attention, leading to advancements in transaction optimization, security, and network efficiency (Qiao et al., 2022). This section summarizes key studies in blockchain analysis, covering areas such as gas fees, opcode insights, graph-based visualization, network security, and fundamental structural analysis.
Gas fees analysis has been a focal point, as transaction costs directly impact blockchain usability and efficiency. Pérez et al. (2021) explored smart contract costs through parametric resource analysis, identifying resource-intensive contract components. Khan et al. (2021) conducted a thorough study on gas consumption in Ethereum transactions, elucidating factors that influence transaction fees. Expanding to Bitcoin, Azzolini et al. (2019) applied probabilistic logic programming to analyze transaction fee structures, offering insights into cost distribution patterns.
Opcode analysis, which examines the instructions driving smart contract execution, has proven valuable for optimizing transaction processes and identifying security risks. Bistarelli et al. (2019) conducted an in-depth opcode analysis of Ethereum smart contracts, focusing on how opcode patterns impact execution efficiency. Sui et al. (2023) advanced this research by developing an opcode-based vulnerability detection method to help identify security risks through opcode sequence analysis .
Graph-based visualization and analysis techniques provide powerful tools for exploring blockchain transaction structures and identifying atypical patterns. Kim et al. (2023) proposed a graph-learning approach to detect phishing accounts by analyzing heterogeneous transaction graphs, while Ofori-Boateng et al. (2021) applied topological anomaly detection methods to multilayer blockchain networks to flag potential attacks. Additionally, Jeyakumar et al. (2023) introduced a graph-based visualization technique that helps detect unusual transaction behaviors, aiding in fraud detection.
To facilitate a comprehensive understanding of the Ethereum blockchain’s structure, the Ethereum Yellow Paper (Wood, 2018) provides a foundational representation of block components and their interconnections within the protocol. This document outlines the building blocks and operational mechanisms underlying Ethereum, offering researchers and developers critical insights into the blockchain’s architecture and enabling analysis of its structural intricacies.
Network topology analysis and node interaction studies are further essential for assessing transaction propagation and network efficiency within Ethereum (Kiffer et al., 2018). By examining block and transaction attributes, researchers can reveal patterns that influence network performance (Wang et al., 2021). A deep understanding of Ethereum’s underlying peer-to-peer (P2P) network is thus pivotal for optimizing the network’s scalability and effectiveness.
Security analysis remains a critical focus area, especially given blockchain’s open transaction environment. Chen et al. (2020a) employed graph analysis techniques on the Ethereum network, identifying vulnerabilities and critical nodes essential for network resilience. Brunet et al. (2021) analyzed the ERC-721 ecosystem, focusing on NFT token interactions to understand their network dynamics. Similarly, Chen et al. (2020b) studied the ERC20 token ecosystem, providing insights into token interaction patterns and network structure.
Privacy concerns further compound blockchain security challenges, as the P2P nature of transactions risks leaking sensitive data. To address this, the concept of blockchain dark venues has emerged, where only miners can access transaction details, enhancing privacy in sensitive transactions (Capponi et al., 2022).
This diverse body of work, spanning from foundational Ethereum structure analysis to advanced graph-based detection techniques, underscores the multifaceted nature of blockchain optimization. In this context, our research uniquely integrates multilayer graph representations with opcode analysis to capture transaction relationships, node interactions, and resource utilization, thereby advancing the development of scalable, secure blockchain ecosystems (Ethereum, 2021).
3. Multilayer Graph Representation
To effectively analyze the resource consumption and interaction patterns within the Ethereum blockchain, we propose a multilayer graph-based approach. This representation provides a detailed, structured way to model the relationships between different types of accounts enabling a deeper understanding of transaction flows and resource utilization. By leveraging graph theory, we can explore the blockchain’s intricate peer-to-peer interactions, identify resource-heavy nodes, and optimize system performance.
3.1. Introduction to Multilayer Graph
Multilayer graphs, also known as multiplex or multi-relational graphs, are an extension of traditional graph models that allow for the representation of multiple types of interactions or relationships between nodes. Unlike single-layer graphs, where all nodes and edges belong to a single structure, multilayer graphs consist of different layers, with each layer representing a distinct type of connection or relationship. This approach is particularly useful for complex systems where entities interact in different ways across multiple contexts, such as social networks, biological systems, or transportation networks.
In the context of blockchain systems, a multilayer graph is well-suited to model the diverse types of accounts and interactions present within the network. Ethereum, for instance, features multiple account types, including Externally Owned Accounts (EOAs), smart contracts, oracles, and cross-chain bridges, each playing a unique role in the system. These accounts interact in various ways—through simple transfers, complex smart contract executions, or cross-chain transactions. A multilayer graph provides the means to capture and differentiate these interactions across distinct layers, making it easier to analyze transaction flows, resource consumption, and interdependencies within the network.
In this paper, we propose a multilayer graph model to represent Ethereum transactions, where each layer corresponds to a specific account type. By analyzing this multilayer structure, we can gain insights into how resources such as gas and opcode execution are distributed across the network, identify resource-intensive nodes, and detect patterns of interaction that can be optimized to improve scalability and efficiency.
3.2. Account Types
Ethereum accounts are divided into two main categories: Externally Owned Accounts (EOAs) and Smart Contracts (SCs), each serving a distinct purpose within the Ethereum ecosystem.
1.Externally Owned Accounts (EOAs): EOAs are accounts governed by private keys, typically representing individual users or entities. While EOAs do not contain executable code, they initiate transactions on the Ethereum blockchain, interacting with smart contracts and other EOAs. They function as the entry points for activities within the Ethereum network, such as sending tokens or invoking smart contracts.
2.Smart Contracts: Smart contracts are accounts on the Ethereum blockchain that contain executable code, enabling them to perform automated actions based on predefined conditions. Unlike EOAs, smart contracts operate autonomously once deployed, facilitating trustless interactions and forming the foundation of decentralized applications (DApps) (Tolmach et al., 2021).
Within the broader category of smart contracts, specialized types have emerged, each fulfilling unique roles within the Ethereum network. This paper categorizes the following key types:
•Oracles: Oracles are specialized smart contracts that serve as intermediaries between the blockchain and external data sources. Due to the blockchain’s inherent isolation from real-world data, oracles provide a bridge that enables smart contracts to access and incorporate external information, such as financial market data, weather conditions, or sports outcomes (Mammadzada et al., 2020). This external data is critical for DApps to make data-informed decisions autonomously. Extensive research has focused on profiling oracles and developing frameworks for seamlessly integrating them with blockchain-based applications (Almi’ani et al., 2023). By offering secure, real-time data inputs, oracles are fundamental to creating reliable, automated systems within blockchain ecosystems.
•Cross-Chain Bridges: Bridges are another critical subset of smart contracts, designed to facilitate interoperability across multiple blockchain networks. These specialized contracts enable asset transfers and data sharing between Ethereum and other blockchains, addressing the challenge of blockchain isolation (Belchior et al., 2023). Techniques for implementing bridges include cross-chain atomic swaps, relay networks, sidechains, and specialized interoperability protocols (Yuan et al., 2023). Given their role in establishing trust between distinct networks, bridges must prioritize robust security to prevent vulnerabilities and maintain the integrity of cross-chain interactions (Marstein et al., 2023). Bridges unlock significant potential for blockchain users and developers by connecting disparate platforms, enhancing the functionality and scalability of blockchain ecosystems.
•Normal Smart Contracts (SCs): These standard smart contracts perform various on-chain operations, from token transfers to contract interactions. Unlike oracles or bridges, general smart contracts lack any specialized function for interfacing with external data or other blockchain networks, making them suitable for a broad array of decentralized applications.
By categorizing account types, including these specialized smart contracts, our multilayer graph model provides a comprehensive approach for analyzing Ethereum network interactions. This classification also supports our study of resource consumption and transaction dynamics, focusing on how each account type contributes uniquely to Ethereum’s overall functionality and transaction flow.
3.3. Graph Structure
To model the interactions between these account types and track their resource consumption, we define a multilayer graph. This graph structure captures both the transaction flow between accounts and the computational resources consumed during these interactions.
The multilayer graph is represented as (G = (V, E, L)), where:
•(V) is the set of nodes, each representing an Ethereum account (EOA, smart contract, oracle, or bridge).
•(E) is the set of directed edges, representing transaction actions between accounts, where each edge is weighted based on the gas consumption during the transaction.
•(L) is the set of layers that categorize accounts based on their type, allowing for a layered representation of different account behaviors within the graph.
3.3.1. Layers
The multilayer graph organizes accounts into different layers based on their function within the Ethereum ecosystem. Each layer represents a specific account type, allowing for more targeted analysis of resource consumption and interaction patterns. The layer set L includes:
1.EOA Layer (Leoa): This layer consists of Externally Owned Accounts, which are controlled by private keys and primarily responsible for initiating transactions.
2.Smart Contract Layer (Lsc): This layer includes normal smart contracts that execute code in response to transaction requests. These smart contracts exclude specialized types such as oracles and bridges, focusing on general-purpose contracts.
3.Oracle Layer (Lo): Oracles are placed in this distinct layer. They interact with external data sources and supply critical off-chain information to smart contracts on the blockchain.
4.Bridge Layer (Lb): This layer represents cross-chain bridges, which facilitate the transfer of assets and data between Ethereum and other blockchain networks. Bridges are key to enabling cross-chain interoperability.
3.3.2. Nodes
Each node v = (a, s, l) ∈ V in the graph represents an Ethereum account, and each node is characterized by:
•Address (a): The Ethereum account’s unique address, which serves as the node’s identifier.
•Score (s): A measure of the account’s resource usage, particularly the amount of gas consumed across transactions. This score helps to quantify the resource intensity of each node’s activities on the blockchain. The node score is calculated in section 4.2.
•Layer (l): Each node is assigned to one of the predefined layers (Leoa, Lsc, Lo, or Lb) based on the type of account it represents. This assignment is critical for understanding the different roles accounts play in the blockchain and for analyzing interactions within and across layers.
3.3.3. Edges
Edges e = (x, y, w, h) ∈ E represent the transactions or actions that occur between two accounts on the blockchain. Each edge contains the following components:
•Source (x): The sender of the transaction, represented by an Ethereum account.
•Target (y): The recipient of the transaction, which can be another EOA or a smart contract.
•Weight (w): The weight of each edge represents the average gas consumption for opcode execution during the transaction. This metric allows us to assess the resource intensity of each transaction and identify high-resource interactions. The edge weight is calculated in section 4.2.
•Transaction Hash (h): Each edge is associated with a unique transaction hash, linking it to a specific transaction in the Ethereum blockchain. This ensures that all actions from a single transaction can be traced and analyzed together.
By modeling transactions as directed, weighted edges, we can capture both the direction of value or data transfer and the resource consumption incurred during each transaction. This edge-centric view enables detailed analysis of how different types of accounts consume resources and interact with one another.
Figure 1 represents an example of a multilayer graph containing 6 transactions. Typically, the w(i, h) values represent the weights associated with the edges in the graph, where
•i is the weight index based on the transaction call-trace action
•h is the transaction hash
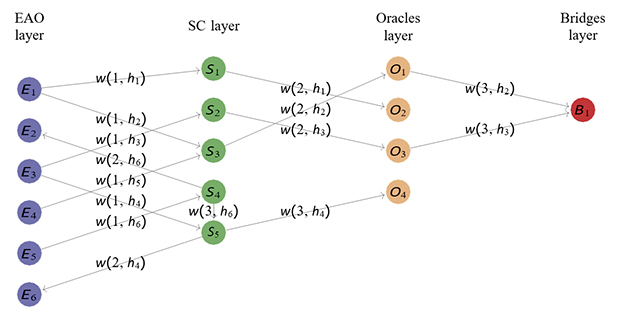
Figure 1. MultiLayer Graph Representation
Overall, our graph-based approach offers a comprehensive framework to study Ethereum’s complex transaction ecosystem. By organizing accounts into distinct layers and analyzing the weighted interactions between them, the multilayer graph allows us to identify key accounts and transactions that contribute to resource- heavy behaviors. This representation also serves as the foundation for detecting anomalies and inefficiencies, ultimately aiding in the optimization of smart contracts and the reduction of gas costs across the network.
4. Methodology
In this section, we describe the methodology employed to collect, process, and structure Ethereum transaction data, followed by the construction of a multilayer graph. We further outline the graph-theoretical metrics used to analyze node performance and transaction behavior.
4.1. Data Collection and Preparation
The initial step in our methodology involves gathering detailed Ethereum transaction data, which forms the foundation for constructing the multilayer graph. This data collection and preparation process includes identifying different account types, tracking transaction flows, and recording resource consumption across Ethereum’s ecosystem.
4.1.1. Data Sources and Transaction Traces
Since Ethereum transactions are publicly recorded, we source data primarily from Blockchair (Datasets, b), a free and open-source data aggregator that offers extensive and detailed blockchain information. Blockchair aggregates data from multiple blockchains into a unified search engine, enabling users, development teams, and research organizations to access blockchain data efficiently. This includes comprehensive transaction details such as transaction hash, sender and receiver addresses, gas prices, gas used, and timestamps, forming the foundation for our transaction flow modeling across Ethereum’s ecosystem.
To further examine each transaction’s internal actions, we utilize Geth (Datasets, a), an Ethereum client, to retrieve detailed transaction call trace actions. Geth enables us to trace each operation within a transaction, providing granular insights into gas consumption, opcode usage, and inter-account interactions. Analyzing these traces reveals the computational load of each transaction, especially those interacting with smart contracts. Each transaction trace records all internal operations, illustrating the sequence of actions taken and the gas consumed for each action.
For calculating opcode counts based on transaction input data, we employ PyEVMAsm (Crytic, ), an open- source assembler and disassembler library for the Ethereum Virtual Machine (EVM). PyEVMAsm offers both a command-line utility and a Python API, enabling us to parse and analyze opcode sequences effectively. This tool allows us to quantify computational steps and examine gas usage patterns, which are essential for understanding resource consumption across various account types (evm.codes, 2021 ; Wood, 2018).
4.1.2. Preprocessing
Once the raw data is extracted, several preprocessing steps are implemented to ensure data quality and consistency across the dataset:
•Cleaning: We remove irrelevant or incomplete transaction data to retain a high-quality dataset.
•Filtering: Transactions involving minimal opcode execution or low gas consumption are excluded, as simple transfer transactions do not contribute significantly to resource usage analysis.
•Formatting: The final dataset is structured to highlight opcode usage, gas consumption, and participating accounts, ensuring uniformity across all transactions for ease of analysis.
The processed dataset includes key attributes for each transaction:
•Transaction type: Transactions are categorized by type, such as transfers, contract creation, or contract invocation.
•Opcode usage: We include a comprehensive breakdown of all opcodes executed in each transaction, detailing the computational steps undertaken by the EVM.
•Gas consumption: Total gas consumed for each transaction and for each internal action within the transaction is recorded.
4.2. Graph Construction
To analyze Ethereum transactions across multiple types of accounts, we construct a multilayer graph that captures both the flow of transactions and resource consumption patterns. This structured approach allows us to represent different types of accounts and their interactions in a layered format, which provides insights into transaction intensity, resource demands, and interaction types within the network.
With the preprocessed data, we construct the multilayer graph that models the transaction interactions across Ethereum accounts. This graph represents both the flow of transactions and the resource consumption patterns for different types of accounts.
•Node Creation: Each Ethereum account (either an EOA or a smart contract) is represented as a node in the graph. The nodes are categorized into different layers based on the type of account. We categorize account types (EOA, smart contract, oracle, bridge) for both sender and receiver accounts. This classification builds on our previous AI-driven study on opcode-based smart contract classification, referenced in (Hasnaoui et al., 2024), which enhances our ability to differentiate and analyze account types effectively.
•Edge Creation: Each transaction trace action between two accounts is represented as a directed edge between the corresponding nodes. The weight of the edge is determined by the gas consumed per opcode in the transaction. The calculation of the edge weight is performed as follows:
– First, the total gas consumed for each action is computed by analyzing the opcodes executed during the transaction.
– Then, the weight w of the edge is calculated using the formula:
where gasConsumed is the total gas used in the transaction, and opcodeCounts is the total number of opcodes executed.
– The transaction hash is attached to each edge to track all internal actions within a transaction. This enables us to follow the complete path of a transaction through the network of accounts.
– The edges capture not only the existence of a transaction between two accounts but also the intensity of the interaction based on resource consumption (gas usage).
•Score Calculation: To quantify the resource consumption of each account, we compute a score for each node. This score reflects the total gas consumed by all outgoing transactions from that account. It is calculated using the following formula:
Where:
– nv is the number of outgoing transactions from node v.
– mv,i is the number of internal actions within transaction i.
– w(i, j) is the gas consumed for each opcode executed in action j of transaction i.
The score allows us to identify accounts that are involved in resource-intensive transactions, highlighting potential inefficiencies.
Algorithm 1 Multilayer Graph Construction
Input: transactions - A set of Ethereum transactions
Output: Multilayer graph G = (V , E, L) representing transaction interactions and resource consumption
1:procedure CONSTRUCTMULTILAYERGRAPH(transactions)
2: for tx in transactions do
3: actions ⟵ getTraceActions(tx)
4: for action in actions do
5: data ⟵ disassembleData(action)
6: opcodesTrace ⟵ getOpcodesActionTrace(data)
7: opcodeCounts ⟵ calculateOpcodeCounts(opcodesTrace)
8: gasConsumed ⟵ calculateGasConsumed(opcodesTrace)
9: w ⟵ gasConsumed / opcodeCounts
10: fromAccountType ⟵ getAccountType(action.from)
11: toAccountType ⟵ getAccountType(action.to)
12: createLayersIfNotExist(fromAccountType, toAccountType)
13: addEdge(fromAccountType, toAccountType, w)
14: incrementNodeScore(fromAccountType, w)
15: end for
16: end for
17:end procedure
The CONSTRUCTMULTILAYERGRAPH algorithm is designed to build a multilayer graph model representing the transactions and interactions within the Ethereum blockchain. Taking a set of Ethereum transactions relevant to our study as input, it outputs a multilayer graph G = (V, E, L) with nodes, edges, and layers that represent account types and their transaction flows.
1.Initialize Transactions: The procedure begins by iterating through each transaction within the input set.
2.Trace Actions Extraction: For each transaction, we retrieve a sequence of internal actions (e.g., account interactions and operations).
3.Opcode Processing: Each action undergoes data disassembly to extract opcode traces, and the opcode counts are calculated for detailed analysis.
4.Resource Consumption Calculation: Gas consumption is computed from opcode traces, with an edge weight w determined by the ratio of gas consumed to the total opcode count, capturing the transaction’s computational cost.
5.Account Type Classification: Account types (EOA, smart contract, oracle, bridge) for both the sender and receiver accounts are identified.
6.Graph Layering and Edge Creation: Layers are created for each unique account type if they do not already exist. A directed edge between the sender and receiver is added to the graph, weighted by the calculated resource cost w.
7.Node Score Update: The node score for the sending account is incremented based on the resource weight, quantifying its gas consumption.
This iterative process constructs a graph reflecting Ethereum’s transaction structure and resource usage across different account layers, providing a detailed view of transaction flows and aiding in performance and efficiency analysis across account types.
4.3. Use Cases for Multilayer Graph Analysis
The multilayer graph model provides a robust framework for analyzing Ethereum transactions and account interactions across different contexts. Here, we discuss three specific use cases: project-specific analysis, block-specific analysis, and mempool analysis. Each use case offers a unique perspective on the Ethereum network, enabling optimizations in resource usage, anomaly detection, and gaining insights into blockchain behavior.
•Project-Specific Analysis: Project-specific analysis focuses on examining transactions and interactions associated with a specific smart contract or project deployed on Ethereum, such as decentralized finance (DeFi) protocols, token contracts, or decentralized applications (DApps). By isolating the graph to include only the accounts and transactions related to this project, we conduct a detailed resource and performance analysis.
– Transaction Flow: The graph highlights frequent interactions between specific accounts (EOAs or smart contracts) and the project’s contracts, identifying key users or participants.
– Resource Consumption: Analyzing node scores of interacting accounts reveals which users or smart contracts consume the most gas when interacting with the project’s system.
– Optimization Opportunities: Patterns indicating consistently high gas consumption in specific transactions help developers optimize certain contract functions or interactions.
•Block-Specific Analysis: Block-specific analysis involves focusing on transactions within a single Ethereum block, providing a snapshot of account interactions and contract executions during that block’s processing.
– Resource Usage: By isolating a single block, we analyze gas consumption distribution across transactions, identifying high-cost transactions that may impact block space efficiency.
– Transaction Congestion: Examining node degrees reveals highly active accounts in a given block, highlighting potential contributors to network congestion.
– Execution Patterns: The multilayer graph captures invocation patterns of smart contracts within a block, detailing interactions across different layers (EOA, SC, Oracle, Bridge) in a specific time frame.
•Mempool Analysis: Mempool analysis centers on pending transactions not yet included in a block, enabling real-time pattern analysis and optimizing transaction selection for block inclusion.
– Transaction Prioritization: Node scores, based on gas fees and transaction complexity, assist miners in prioritizing high-value or resource-efficient transactions for faster inclusion.
– Anomaly Detection: Real-time graph analysis of the mempool identifies spikes in activity or unusual transaction patterns, such as spam attacks or front-running attempts.
– Optimization for Layer 2 Solutions: The graph highlights transactions suitable for Layer 2 scaling solutions (e.g., rollups), based on their resource usage profiles.
4.4. Graph Metrics and Features
Once the graph is constructed, we compute several key graph metrics to analyze its structure and account behaviors. These metrics provide insights into transaction flows, resource usage, and performance bottlenecks:
•Transaction Volume per Node and Layer: This metric indicates transaction activity levels for different account types (EOAs, smart contracts, oracles, bridges), highlighting which accounts are most active in initiating or receiving transactions.
•Node Degree Analysis:
– Outgoing Degree (Successor Edges): Reflects the transaction count initiated by an account, useful for identifying high-activity accounts like frequently used smart contracts or EOAs.
– Incoming Degree (Predecessor Edges): Shows the frequency of transactions received by an account, often identifying critical nodes like oracles or bridges with high transaction dependency.
•Node score distribution: This distribution highlights resource-intensive accounts that consume significant amounts of gas. By analyzing node scores, we can pinpoint which accounts are responsible for the highest levels of resource consumption, potentially identifying opportunities for optimization.
•Shortest transaction path: The shortest path between any two nodes is calculated based on the gas consumption (edge weights) between them. This metric helps identify the most efficient routes for transactions, providing insights into potential optimization of transaction flows. It also allows us to detect patterns of indirect or inefficient resource usage.
These metrics enable a comprehensive analysis of Ethereum transaction behavior, offering a foundation for further studies on network optimization, anomaly detection, and smart contract performance improvements.
5. Results and Analysis
In this section, we present the results of our analysis based on the constructed multilayer graph of Ethereum transactions. Our findings are drawn from transaction data collected, providing insights into transaction types, contract interactions, gas usage, and the overall performance of the Ethereum network.
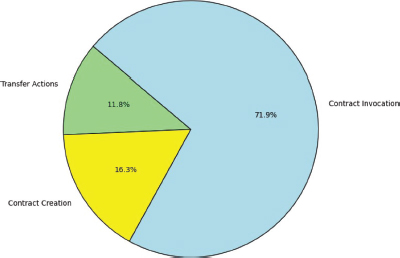
5.1. Transaction Type Analysis
We analyzed Ethereum transactions over a one-month period, classifying them into three main categories: Transfer Actions, Contract Creation, and Contract Invocation. The following table 1 summarizes the results:
Table 1. Transaction Analysis Summary
Tx Type |
Total Transactions |
Total Opcode Count |
Total Gas Used |
Transfer Actions |
45M |
0 |
18B |
Contract Creation |
1.5M |
12B |
25B |
Contract Invocation |
7.5M |
90B |
110B |
Our findings show that Transfer Actions (native currency transfers), the most common (83.3 % of all transactions), are computationally simple with minimal gas use, while Contract Creation (2.8 %) and Contract Invocation (13.9 %) require more resources due to increased complexity. Contract Invocation is particularly gas-intensive, indicating significant computational costs associated with smart contract functions.
The following graph visually represents the varying levels of gas consumption across different Ethereum transaction types. As shown, Contract Invocation requires the highest gas usage, reflecting the resource intensity of executing smart contracts, while Transfer Actions are minimal in comparison.
Graph 1. Gas Consumption by Transaction Type
5.1.1. Contract Creation Analysis
To understand resource distribution, we examined contract types across token contracts, oracles, cross-chain bridges, and DeFi applications, as shown in Table 2.
Table 2. Resource Consumption by Contract Type
Contract Type |
Avg Opcode Count |
Avg Gas Used |
Token Contracts |
9,000 |
18M |
Oracle Contracts |
14,000 |
28M |
Cross-chain Bridges |
24,000 |
45M |
DeFi Contracts |
26,000 |
50M |
Token Contracts consume the least resources, typically for basic token issuance and transfers, while Oracle Contracts require moderate resources due to external data dependencies. Cross-chain Bridges and DeFi Contracts are the most resource-intensive, reflecting complex interactions and substantial on-chain logic.
5.1.2. Contract Invocation Analysis
Similarly, contract invocation transactions reveal high resource consumption for DeFi and bridge-related interactions (Table 3). Token invocations are less demanding, while oracle invocations consume additional resources for data retrieval processes.
Table 3. Resource Consumption for Contract Invocation
Contract Type |
Avg Opcode Count |
Avg Gas Used |
Token Contracts |
12,000 |
25M |
Oracle Contracts |
16,000 |
35M |
Cross-chain Bridges |
28,000 |
58M |
DeFi Contracts |
30,000 |
62M |
Graph 2 compares the average gas consumption between Contract Creation and Contract Invocation across different contract types. As shown, DeFi Contracts and Cross-chain Bridges exhibit the highest resource consumption in both contract creation and invocation, indicating their complexity and high computational requirements.
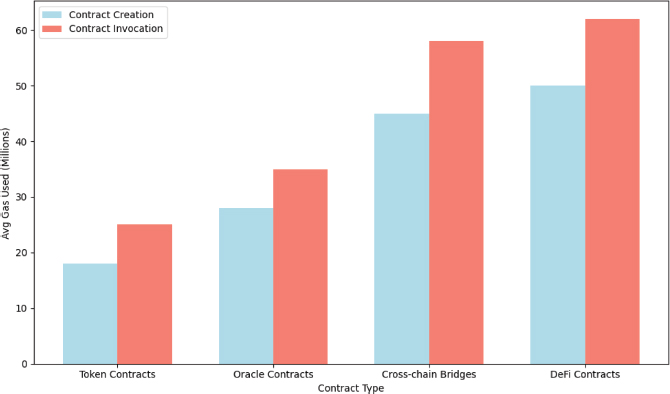
Graph 2. Gas Consumption by Contract Type (Creation vs. Invocation)
5.1.3. Transfer Efficiency Analysis
A comparison of native ETH transfers and token transfers reveals differences in gas consumption, shown in Table 4.
Table 4. Transfer Analysis: Native Currency vs. Token Transfers
Transfer Type |
Total Transactions |
Total Gas Used |
Native Currency (ETH) |
15M |
10M |
Token Transfers |
25M |
55M |
Native Currency Transfers (ETH) are lightweight, as they do not require contract interaction, consuming only 10M gas. In contrast, Token Transfers involve smart contract invocations, resulting in a higher gas cost of 55M for the 25M token transfers analyzed. This highlights the added resource demand associated with token standards like ERC-20 or ERC-721.
In summary, the data reveals that transaction complexity significantly affects gas usage, with contract invocations, especially in DeFi and cross-chain applications, consuming the most resources. Token transfers also demonstrate higher gas costs than native currency transfers, reflecting the computational overhead of interacting with smart contracts.
5.2. Graph Metrics Summary
In this section, we summarize key metrics from the multilayer Ethereum transaction graph analysis. These metrics provide insights into the structure, resource consumption, and interaction patterns within the Ethereum network, allowing for a more comprehensive understanding of account behavior and transaction flows. Table 5 provides our graph metrics summary.
Table 5. Graph Metrics Summary
Metric |
Description |
Value |
Total Nodes |
Total number of unique accounts (EOAs, smart contracts, oracles, bridges) |
8 million |
Total Edges |
Total number of transactions between accounts |
35 million |
Average Node Degree |
Average number of outgoing transactions per account |
4.4 |
Node Score Distribution |
Range of resource consumption scores across accounts |
Highly skewed toward SC |
Shortest Transaction Path |
Average minimum transaction path between accounts |
2.7 |
•Total Nodes and Edges: The graph includes 8 million nodes, representing unique Ethereum accounts such as EOAs, smart contracts, oracles, and cross-chain bridges active during the analysis period. The total edges capture the transactions among these accounts, underscoring the high volume of transactions on the Ethereum network.
•Average Node Degree: The average node degree is 4.4, indicating that each account initiates around 4 transactions on average. This metric reveals that, while many accounts only occasionally transact, a subset of highly active accounts generates a significant volume of interactions.
•Node Score Distribution: Node scores, representing resource consumption based on gas usage and opcode execution, show a distribution heavily skewed toward smart contracts (SC), especially in contract invocations. EOAs generally have lower scores, as their transactions typically involve simpler, less resource-intensive transfers.
•Shortest Transaction Path: With an average shortest path length of 2.7, most accounts are only a few transactions apart, indicating a highly interconnected network. This interconnectedness enables frequent interaction among accounts, either directly or through intermediary nodes.
In summary, these graph metrics offer valuable insights into Ethereum’s transaction flow, interaction clusters, and resource allocation. This analysis enhances our understanding of network behavior, enabling more informed strategies for optimizing blockchain performance and detecting transaction anomalies.
5.3. Node Score by Layer
In this analysis, we evaluate the distribution of node scores across different layers of the multilayer graph. The node score reflects the total resource consumption (measured in gas) associated with outgoing transactions from each account. Table 6 provides a summary of the average node scores for each account type:
Table 6. Average node scores by layer, representing resource consumption
Layer |
Number of Nodes |
Average Node Score (Gas Consumption) |
EOA Layer (Leoa) |
500,000 |
150 m |
Normal Contract Layer (Lsc) |
120,000 |
1,200 m |
Oracle Layer (Lo) |
20,000 |
1,500 m |
Bridge Layer (Lb) |
15,000 |
2,000 m |
The data indicates that while Externally Owned Accounts (EOAs) have a low average score of 150 million due to their primarily transactional role, normal contracts exhibit a significantly higher average score of 1,200 million, reflecting their complexity and functionality. Oracles further increase resource usage to 1,500 million, as they provide critical external data, while bridges represent the highest consumption at 2,000 million, attributed to the complexity of cross-chain transactions. This analysis underscores the varying resource demands of different account types, highlighting the importance of focusing optimization efforts on the more resource-intensive layers to improve overall network efficiency.
5.4. Anomaly Detection
In this section, we propose an approach to detect anomalies in the Ethereum network based on fluctuations in node scores, which may indicate unusual or potentially malicious activities. Our analysis focuses on average node scores per block, enabling us to identify deviations that may signal anomalies, such as reentrancy attacks or other vulnerabilities.
To implement this approach, we analyze the score of various contract protocols across multiple blocks. We systematically track how often score spikes indicate potential reentrancy attacks.
To optimize our anomaly detection approach and reduce false positives (FP), we implemented a set of adjustments aimed at fine-tuning the detection mechanism. These optimizations include refining the threshold for anomaly detection to reduce the sensitivity to benign fluctuations in node scores, as well as incorporating additional contextual factors such as transaction volume and gas consumption into the analysis. This allows the model to more accurately differentiate between legitimate anomalies and normal network behavior.
The Table 7 summarizes our findings regarding the detection of reentrancy attacks in relation to smart contracts and Externally Owned Accounts (EOAs):
Table 7. Anomaly detection results for reentrancy attacks in smart contracts and EOAs
Detection Type |
True Positive (TP) |
True Negative (TN) |
False Positive (FP) |
False Negative (FN) |
Smart Contracts |
15 |
100 |
2 |
3 |
EOAs |
10 |
90 |
1 |
2 |
From our analysis, we observed the following results:
•For smart contracts, we accurately identified 15 instances of reentrancy attacks (true positives), while 2 false alarms were triggered (false positives). This indicates a high detection rate with minimal false positives.
•In the context of EOAs, we detected 10 true cases of reentrancy attacks, with 1 false alarm. This reflects a precise detection mechanism, with very few false positives. The performance here reflects slightly lower efficacy compared to smart contracts, suggesting the need for enhanced monitoring strategies for EOAs.
Overall, our anomaly detection approach demonstrates potential for identifying malicious activities within the Ethereum ecosystem. By refining our detection algorithms and further analyzing patterns, we can enhance the security posture of the network and mitigate risks associated with smart contract vulnerabilities and malicious attacks.
5.5. Graph Construction Complexity
The construction of the multilayer graph involves several computational steps, which are assessed based on two primary factors: the number of transactions and the number of internal calls per transaction. Table 8 provides a summary of the key metrics associated with this process.
Table 8. Graph construction metrics and computational complexity
Metric |
Value |
Total Number of Transactions (n) Average Number of Internal Calls (m) Time Complexity |
1,000,000 10 to 15 O(n · m) |
The time complexity of constructing the multilayer graph is O(n m), where n represents the total number of transactions, and m denotes the average number of internal calls per transaction. All operations within the algorithm, including trace actions, opcode analysis, and account classification, are O(1) calls, ensuring that each transaction and its internal calls are processed in constant time, contributing to the overall O(n m) complexity. As the scale of transactions and contract complexity increases, efficient real-time graph construction is essential for maintaining the performance of the analysis. To enhance scalability and meet the demands of large datasets, parallel processing and distributed computing can be applied. These techniques allow for the concurrent processing of multiple transaction traces and internal calls, significantly reducing the overall computation time.
By leveraging distributed systems or multi-core processors, the construction process can remain efficient even as transaction volumes grow, ensuring that the system is adaptable to larger, real-time datasets.
This approach ensures that the multilayer graph construction remains scalable, enabling more effective analysis of Ethereum’s evolving ecosystem and maintaining responsiveness for real-time applications.
6. Discussions
6.1. Implications for Blockchain Scalability, DeFi, and Web3 Optimization
This study provides crucial insights into the scalability challenges facing blockchain networks, particularly within the context of DeFi and Web3 applications. The high gas consumption observed during smart contract execution—especially for complex contracts such as oracles and bridges—highlights the scalability concerns of Ethereum and similar blockchain networks. These findings suggest that, to accommodate the growing demand for decentralized finance (DeFi) and Web3 applications, optimizing opcode execution and reducing gas costs will be essential.
By analyzing opcode distributions and gas usage, we demonstrate how smart contract efficiency can be improved, leading to reduced transaction fees and enhanced throughput. These improvements are especially relevant to DeFi platforms, where high transaction costs often hinder scalability and accessibility. Our approach offers a pathway to optimize smart contract interactions, enabling more efficient decentralized applications. Furthermore, with the increasing importance of cross-chain bridges in Web3 ecosystems, our analysis highlights opportunities to enhance resource consumption and efficiency, ultimately improving inter- network communication.
The results of this study underscore the need for targeted optimizations in blockchain applications to support scalability. By optimizing opcode usage and refining contract designs, developers can create more resource- efficient smart contracts, which are crucial for the continued growth of DeFi and Web3 applications. Specifically, reducing gas fees will be vital for enabling broader adoption and ensuring the scalability of decentralized platforms. The insights derived from this research can inform the development of more efficient transaction models that are both cost-effective and scalable.
Our approach aligns with recent studies aimed at optimizing transaction efficiency and scalability in blockchain networks. For example, research on dynamic gas pricing mechanisms, such as Ethereum’s EIP-1559 (Ethereum Foundation, 2021), aims to improve scalability by adjusting gas fees according to network demand. EIP-1559 introduces a base fee that fluctuates with congestion, which can help reduce transaction cost volatility. While this proposal addresses network congestion, our work complements it by providing a deeper analysis of opcode-level resource consumption across multiple contract layers. This complementary approach offers more granular insights into transaction patterns, further optimizing gas usage across decentralized applications.
Studies focused on smart contract optimization, such as those addressing gas consumption in business processes or Solidity code, tend to focus on individual contract-level improvements. One study suggests that simplifying business process models can lead to up to 15 % gas savings (Hu et al., 2019), while another targets control structures in Solidity code, reporting up to a 21 % reduction in gas costs per transaction (Nelaturu et al., 2021). While these approaches provide significant contract-level optimizations, they do not offer a comprehensive view of resource consumption across different contract types.
In contrast, our approach employs multilayer graph analysis based on opcode execution, enabling a more holistic and comprehensive understanding of resource consumption across the entire blockchain network, rather than just individual contract-level optimizations. This broader perspective allows for deeper insights into how different contract types and interactions impact overall network efficiency.
6.2. Applicability to Other Blockchain Platforms
While this study focuses on the Ethereum blockchain, the methodology developed is designed to be adaptable across various EVM-compatible platforms. These platforms share a common foundation in opcode execution and gas cost calculation, making our multilayer graph approach applicable with minor adjustments (Solomon, 2024). Table 9 provides a comparative overview of prominent EVM-compatible blockchains, highlighting their consensus mechanisms and features impacting opcodes and gas. The analysis underscores the key aspects that make these blockchains well-suited for implementing our methodology. Their full or near-full compatibility with Ethereum’s opcode set ensures that our opcode-driven multilayer graph approach can be seamlessly applied. This broad applicability strengthens the case for extending our methodology to analyze resource consumption, opcode usage, gas costs, and transaction behavior across multiple platforms.
Table 9. Comparison of EVM-Compatible Blockchains Relevant to the Proposed Approach
Blockchain |
Consensus Mechanism |
Compatibility |
Distinct Features Impacting Opcodes/Gas |
Ethereum |
Proof of Stake (PoS) |
EVM |
Comprehensive opcode set; dynamic pricing |
BNB Chain |
Proof of Staked Authority (PoSA) |
EVM |
Optimized for low fees; fewer opcode- intensive features |
Polygon |
Proof of Stake (PoS) |
EVM |
Lower gas fees due to scalability mechanisms |
Avalanche |
Snowman |
EVM |
Uses subnets for resource isolation |
Arbitrum |
Inherits Eth’s PoS |
EVM |
Reduced gas usage through off-chain execution |
6.3. Impact of Dynamic Gas Pricing on Blockchain Resource Consumption
Ethereum’s gas fee structure is a critical factor influencing transaction costs and resource consumption within the network. Historically, gas prices were determined by a bidding system, which led to significant volatility and congestion during periods of high demand. However, with the implementation of EIP-1559 (Buterin et al., 2019), Ethereum introduced a dynamic gas pricing mechanism. This system includes a base fee that adjusts automatically based on network demand, alongside a priority fee paid to validators to prioritize transactions.
The base fee is designed to scale according to network congestion. During periods of high demand, the base fee increases, incentivizing users to pay more to have their transactions processed quickly. Conversely, when demand is low, the base fee decreases, lowering transaction costs. This dynamic model brings more predictability to gas pricing, though it remains sensitive to fluctuations in network activity.
The introduction of EIP-1559 has substantial implications for opcode execution and transaction costs. As gas fees fluctuate, the cost of executing opcodes—especially those in resource-intensive smart contracts—can vary significantly. During times of high base fees, the cost of executing operations increases, while in less congested periods, these costs decrease. This variability affects not only transaction costs but also the economic efficiency of smart contract operations, as users and developers must adjust to these changing conditions.
Given the inherent volatility of gas prices, optimizing resource consumption becomes crucial for reducing costs and improving overall efficiency. Our multilayer graph-based approach is particularly effective in this context, as it dynamically calculates and visualizes resource consumption across different transaction types and account interactions. By continuously tracking and adapting to fluctuations in gas fees, our model can offer real-time insights into cost-effective strategies for optimizing blockchain interactions, making it a valuable tool for both developers and users seeking to minimize transaction costs amidst a dynamic pricing environment.
7. Conclusions
This paper presents a comprehensive analysis of the blockchain network through the construction of a multilayer graph representation of its transaction ecosystem. By segmenting accounts into distinct layers—Externally Owned Accounts (EOAs), normal contracts, oracles, and bridges—we have gained valuable insights into the diverse operational dynamics that characterize this decentralized environment.
A key aspect of our analysis is the opcode approach, which enables us to evaluate resource consumption at a granular level. By examining opcode execution and gas usage across different layers, we have effectively quantified the computational demands associated with various types of transactions. This method not only highlights the efficiency and complexity of interactions but also provides a framework for optimizing network
performance. The findings illustrate that while EOAs primarily engage in simple transfers, smart contracts especially oracles and bridges exhibit significantly higher resource consumption due to their intricate functionalities.
Moreover, our implementation of an anomaly detection mechanism demonstrates its potential to proactively identify and mitigate malicious activities within the Ethereum ecosystem. By focusing on deviations in transaction patterns, this approach offers a promising avenue for enhancing the security and resilience of smart contracts against vulnerabilities, such as reentrancy attacks.
While our study provides valuable insights into blockchain transaction analysis, certain limitations must be acknowledged. One challenge is the complexity of analyzing large-scale datasets, which increases computational demands as transaction volumes grow. This highlights the importance of developing optimization techniques to enhance the efficiency of data processing and analysis. Additionally, accurately classifying unverified smart contracts, such as oracles and bridges, introduces ambiguities that may impact the precision of the results. Refining classification algorithms could improve the accuracy of future analyses.
Looking ahead, several promising directions for future research emerge. A key focus will be extending the multilayer graph methodology to non-EVM blockchain networks, such as Algorand, Solana, and Polkadot. This comparative exploration could reveal how varying consensus mechanisms and architectural designs influence transaction dynamics and resource consumption. Furthermore, an in-depth comparative analysis of multilayer graphs for Layer 2 blockchain solutions compared to Ethereum may provide valuable insights into scalability and cost-effectiveness within a layered ecosystem.
In conclusion, this study contributes to the existing body of knowledge on blockchain analysis and provides a foundational framework for future research endeavors. As blockchain technology continues to evolve, the ability to analyze transaction flows, optimize resource usage, and detect security anomalies will be crucial for the development of more efficient, secure, and scalable decentralized networks.
References
Almi’ani, K., Lee, Y.-C., Alrawashdeh, T., & Pasdar, A. (2023). Graph-Based Profiling of Blockchain Oracles. IEEE Access, 11, 24995–25007. https://doi.org/10.1109/ACCESS.2023.3254535.
Antonopoulos, A., & Wood, G. (2018). Mastering Ethereum: Building Smart Contracts and DApps. O’Reilly Media, Incorporated.
Azzolini, D., Riguzzi, F., & Lamma, E. (2019). Studying Transaction Fees in the Bitcoin Blockchain with Probabilistic Logic Programming. Information, 10(11), 335. https://doi.org/10.3390/info10110335.
Belchior, R., Süßenguth, J., Feng, Q., Hardjono, T., Vasconcelos, A., & Correia, M. (2023). A Brief History of Blockchain Interoperability. TechRxiv. License: CC BY-NC-SA 4.0.
Bistarelli, S., Mazzante, G., Micheletti, M., & Mostarda, L. (2019). Analysis of Ethereum Smart Contracts and Opcodes. In Proceedings of the 2nd Distributed Ledger Technology Workshop (DLT 2019).
Brunet, S. C., Ribeca, P., Doyle, P., & Mattavelli, M. (2021). Networks of Ethereum Non-Fungible Tokens: A graph-based analysis of the ERC-721 ecosystem.
Capponi, A., Jia, R., & Wang, Y. (2022). The Evolution of Blockchain: From Lit to Dark. RePEc:arx:papers:2202.05779.
Chen, T., Li, Z., Zhu, Y., Chen, J., Luo, X., Lui, J., Lin, X., & Zhang, X. (2020a). Understanding Ethereum via Graph Analysis. ACM Transactions on Internet Technology, 20(2), 1–32. https://doi.org/10.1145/3381036.
Chen, W., Zhang, T., Chen, Z., Zheng, Z., & Lu, Y. (2020b). Traveling the token world: A graph analysis of Ethereum ERC20 token ecosystem. In Proceedings of The Web Conference 2020 (WWW ’20). https://doi.org/10.1145/3366423.3380215.
Cortes-Goicoechea, M., & Bautista-Gomez, L. (2021). Discovering the Ethereum2 P2P Network. In 2021 Third International Conference on Blockchain Computing and Applications (BCCA), IEEE. https://doi.org/10.1109/BCCA53669.2021.9657041.
Crytic. An Assembler and Disassembler Library for the Ethereum Virtual Machine (pyevmasm). Datasets, B., a. Geth Ethereum. https://geth.ethereum.org.
Datasets, B., b. Universal blockchain explorer and search engine. https://blockchair.com/ethereum.
Ethereum. Solidity Documentation, 2021.
Ethereum Foundation, R. I. G. (2021). EIP 1559: A transaction fee market proposal. https://ethereum.github.io/abm1559/notebooks/eip1559.html.
Ethereum.org. Ethereum official page.
evm.codes, (2021). An Ethereum Virtual Machine Opcodes Interactive Reference.
Hasnaoui, I., Zrikem, M., & Elassali, R. (2024). AI-Driven Opcode-Based Smart Contract Classification. In 2024 IEEE 12th International Symposium on Signal, Image, Video and Communications (ISIVC), 1–6. https://doi.org/10.1109/ISIVC61350.2024.10577927.
Hu, W., Fan, Z., & Gao, Y. (2019). Research on Smart Contract Optimization Method on Blockchain. IT Professional, 21(5), 33–38. https://doi.org/10.1109/MITP.2019.2923604.
Jeyakumar, S., Hou, Z., Yugarajah, A., Palaniswami, M., & Muthukkumarasamy, V. (2023). Visualizing Blockchain Transaction Behavioural Pattern: A Graph-based Approach. https://doi.org/10.36227/techrxiv.22329889.
Khan, M., Sarwar, H., & Awais, M. (2021). Gas consumption analysis of Ethereum blockchain transactions. Concurrency and Computation: Practice and Experience (CCPE). https://doi.org/10.1002/cpe.6679.
Kiffer, L., Levin, D., & Mislove, A. (2018). Analyzing Ethereum’s Contract Topology. In Proceedings of the Internet Measurement Conference 2018 (IMC 2018), 494–499. https://doi.org/10.1145/3278532.3278573.
Kim, J., Lee, S., Kim, Y., Ahn, S., & Cho, S. (2023). Graph Learning-Based Blockchain Phishing Account Detection with a Heterogeneous Transaction Graph. Sensors, 23(1), 463. https://doi.org/10.3390/s23010463.
Kim, S., Kwon, Y., & Cho, S. (2018). A Survey of Scalability Solutions on Blockchain. In Proceedings of the 2018 International Conference on Information and Communication Technology Convergence (ICTC), 1–5. https://doi.org/10.1109/ICTC.2018.8539529.
Mammadzada, K., Iqbal, M., Milani, F., García-Bañuelos, L., & Matulevičius, R. (2020). Blockchain Oracles: A Framework for Blockchain-Based Applications. In Business Process Management: Blockchain and Robotic Process Automation Forum (BPM 2020 Blockchain and RPA Forum), 19–34. https://doi.org/10.1007/978-3-030-58779-6_2.
Marstein, K.-E., Chiriac, A., Riley, L., Hardjono, T., & Verdian, G. (2023). Implementing Secure Bridges: Learnings from the Secure Asset Transfer Protocol.
Nakamoto, S. (2018). Bitcoin: A Peer-to-Peer Electronic Cash System.
Nelaturu, K., Beillahi, S. M., Long, F., & Veneris, A. (2021). Smart Contracts Refinement for Gas Optimization. In 2021 3rd Conference on Blockchain Research & Applications for Innovative Networks and Services (BRAINS), 229–236. https://doi.org/10.1109/BRAINS52497.2021.9569819.
Ofori-Boateng, D., Dominguez, I. S., Akcora, C., Kantarcioglu, M., & Gel, Y. (2021). Topological Anomaly Detection in Dynamic Multilayer Blockchain Networks. In Machine Learning and Knowledge Discovery in Databases, 12975, 788–804. Springer.
Pérez, V., Khan, M. A., Sarwar, H., & Awais, M. (2021). Cost Analysis of Smart Contracts Via Parametric Resource Analysis. Lecture Notes in Computer Science, 12389, 7–31. https://doi.org/10.1007/978-3-030-82979-5_2.
Qiao, L., Dang, S., Shihada, B., Alouini, M.-S., Nowak, R., & Lv, Z. (2022). Can blockchain link the future? Digital Communications and Networks, 8(5), 687–694. https://doi.org/10.1016/j.dcan.2021.07.004.
Solomon, M. (n.d.). evmdiff: Opcodes comparison. Retrieved in 2024 from https://www.evmdiff.com/features?feature=opcodes.
Sui, J., Chu, L., & Bao, H. (2023). An Opcode-Based Vulnerability Detection of Smart Contracts. Applied Sciences, 13(13), 7721. https://doi.org/10.3390/app13137721.
Tolmach, P., Li, Y., Lin, S., Liu, Y., & Li, Z. (2021). A Survey of Smart Contract Formal Specification and Verification. ACM Computing Surveys, 54(7), 1–38. https://doi.org/10.1145/3464421.
Buterin, V., Conner, E., Dudley, R., Slipper, M., Norden, I., & Bakhta, A. (2019). EIP-1559: Fee market change for ETH 1.0 chain. Ethereum Improvement Proposals, (1559). Retrieved from https://eips.ethereum.org/EIPS/eip-1559.
Wang, T., Zhao, C., Yang, Q., Zhang, S., & Liew, S. C. (2021). Ethna: Analyzing the Underlying Peer-to-Peer Network of Ethereum Blockchain. IEEE Transactions on Network Science and Engineering, 8(3), 2131–2146. https://doi.org/10.1109/TNSE.2021.3078181.
Wood, G. (2018). Ethereum: A Secure Decentralised Generalised Transaction Ledger.
Wu, K. (2019). An Empirical Study of Blockchain-based Decentralized Applications. Available at: https://arxiv.org/abs/1902.04969.
Wu, K., Ma, Y., Huang, G., & Liu, X. (2021). A first look at blockchain-based decentralized applications. Software: Practice and Experience, 51(10), 2033–2050. https://doi.org/10.1002/spe.2751.
Yuan, H., Fei, S., & Yan, Z. (2023). Technologies of Blockchain Interoperability: A Survey. Digital Communications and Networks. In Press, Journal Pre-proof. https://doi.org/10.1016/j.dcan.2023.07.008.
Yue, K., Zhang, Y., Chen, Y., Li, Y., Zhao, L., Rong, C., & Chen, L. (2021). A survey of decentralizing applications via blockchain: The 5G and beyond perspective. IEEE Communications Surveys & Tutorials, 23(4), 2191–2217. https://doi.org/10.1109/COMST.2021.3116109.