ADCAIJ: Advances in Distributed Computing and Artificial Intelligence Journal
Regular Issue, Vol. 13 (2024), e31594
eISSN: 2255-2863
DOI: https://doi.org/10.14201/adcaij.31594
Harigeeta: Cic Mechanism with Euclidean Steiner Tree for Service Latency Prediction in Delay-Sensitive Cloud Services
Rahul Kumar Sharmaa,b and Sarvpal Singha,c
a Madan Mohan Malviya University of Technology, Gorakhpur, India, 37003
b Research scholar, Information technology and Computer Application Department, MMMUT, Gorakhpur, India, 37003
c Professor Information technology and Computer Application Department, MMMUT, Gorakhpur, India, 37003
ABSTRACT
Data establishment and resource provision are the most crucial tasks in the data center. To achieve minimum service latency, it is required to have a balance between the virtual machine and physical machine for proper execution of any query into the cloud data center. Cloud services have a huge market in the world trade. These services have a large impact on every field, also on research. Latency is a major problem in the growth of the cloud market in a real time scenario. Online trade, marketing and banking have a large market of cloud services, which require minimum latency in the real-time response otherwise the whole market would be destroyed. Latency prediction plays a crucial role in managing the load on the data center. To perfectly maintain a request waiting queue, it is required to predict accurate latency between the virtual machines in the data center. If any approach can predict accurate latency in the data center for any particular request, then it can perfectly manage the waiting queue for the cloud data center. Thus, prediction plays a crucial role in reducing latency in the execution of any request to the cloud data center. This article presents an online latency prediction approach for VMs to improve load balancing. A Euclidean Circle Steiner Tree point is proposed. Results show compression with existing mechanisms and get 8-12 % more accuracy in latency prediction.
KEYWORDS
latency; Euclidean space; prediction; SLPT; ECST; JTM
1. Introduction
In the world, the Internet is the simplest and easiest way for people to connect without any distance and time barrier. From the economical perspective, the internet is also the cheapest way to communicate with a person who is located in another country or city. Best effort (BE) internet is the cheapest, universal platform for communication and delivering various digital services in different fields (Medara et al., 2022). However, the internet depends on significant over-provisioning of bandwidth, fetching relatively bad quality of services (QoS) guarantees, which are responsible for resource utilization, energy efficiency and throughput. The poor quality of energy efficiency on the internet is the main reason behind the everyday overflow of energy cost (Alharbi et al., 2019). It also contributes noticeably to greenhouse gas emissions and global warming. As a result of these conditions, governments from all over the world are moving toward future internet architectures which are both revolutionary and evolutionary (Balasubramanian et al., 2019).
According to the survey, approximately 98.3 % communication between people from different cities or countries takes place over the internet. All of the communication takes place in the form of messages. We transfer messages in the form of the different type of webs, which contains the messages in encrypted format, in the form of 0 and 1. These webs convert the message into the text format with the help of a decryption key, which is provided to the authorized receiver. Thus, in this whole process, there are two main points which require much work for a strong internet architecture to be developed. The first one is the security of our message which is sent over the internet. If there are no strong and secure encryption algorithms, then it is very likely that the sent message is eventually lost or fetched by someone who wants to take advantage of our information. Nowadays, every department of any government all over the world is highly dependent on the internet (e.g., the banking system is fully based on the internet, if at this level the internet were not secure then anybody could easily hack into the system and obtain our personal and banking information). Thus, if the level of security is not enhanced, our personal or professional information cannot be sent over the internet. The second point to be developed is the transfer rate of data over the internet from the sender to the receiver (Miladinovic et al., 2021). How is data transfer rate the most essential point? To understand this, we need to understand «what our internet needs are today and what they will be in the future». Nowadays, cloud is the most effective place to store our data over the internet. The cloud is known as a storage space, where we can save our data from any place in the world through the internet. Most people use the cloud to store their data because it is easy to access from anywhere. It is also highly user-friendly and friendly for the environment (Hemalata et al., 2012). Some of the cloud providers provide free of cost spaces to the user (e.g., Gmail, Yahoo, Amazon etc.). The cloud presents a new paradigm with effective and specialized network environment for various delivery services. Nowadays, cloud service providers (CSPs) provide new, effective services for various technologies on a global scale, by renting computing facilities and cloud storage from cloud infrastructure providers. Today, cloud services have penetrated many areas and provide services in almost every field, on a global scale. Cloud service providers (CSPs) include various services such as a high-performance computing (HPC) system, a secure transaction platform and large-scale video distribution (e.g., YouTube, Hotstar and Netflix etc.)
A large investment of approximately $1.1 billion was announced by Cisco, to establish a global intercloud to provide a path for private and public clouds to establish an unprecedented global service infrastructure.
On-demand gaming has two key technological obstacles: latency and the requirement for servers with high-cost, specialized technology that cannot accommodate numerous gaming sessions at once. On-demand gaming suffers from network latency, which is the delay in delivering user input and video output back and forth between the end user and the cloud, as well as encoding latency, which is the time it takes to compress the video output. A major percentage of network delay is inevitable since it is constrained by the speed of light through fiber, although the video encoding latency is likely to decrease with faster hardware encoders. Cloud computing and network architecture are large-scale distributed network environments (Ardagna et al., 2015). Figure 1 describes the architecture of cloud computing and controller effect with low latency. It shows that low latency is helpful when playing video games online. Cloud computing is also known an «on demand system», in which, computing resources are provided to the users on demand. These resources include memory, processing power, bandwidth etc. Cloud computing provides both software and hardware in the data center and provides applications as services over the internet. Cloud computing is a collection of many technologies such as traditional computing, peer computing, network computing and grid computing. All these technologies are based on the internet.
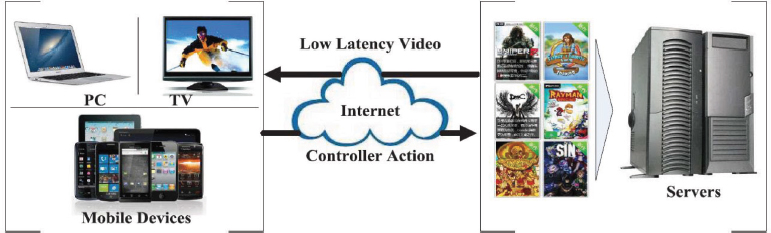
Figure 1. Architecture of cloud service system
Due to the widespread usage of the cloud, cloud computing has become a more effective and demanded technology in the world. In cloud computing, we fetch our data from the cloud. The cloud denotes a place where storage devices have been placed to store data. Data storage processes take time; if we want to reduce this time then we need to improve the data transfer rate over the internet (Sharma et al. (2015). The speed of data transfer is the most relative property of the internet, and it has a large impact on cloud computing. If the speed of data transfer is not suitable (low data transfer rate) then the scope of delayed sensitive cloud services, such as online games, online secure transactions, 3D presentations etc., is destroyed (Medara et al., 2020). So, if we want to enhance the network speed or data transfer then it is necessary to work on reducing the latency in cloud computing.
Many researchers, ventures and industrial practitioners have much attention to cloud computing. According to the survey and the prediction of industry experts, the size of global cloud computing, solely based on the video game market, is to grow up to U.S. $ 110 billion in 2020, also implying significant growth in online, cloud-based gaming and storage. It is a very challenging task to establish an effective cloud computing platform with minimum latency that can offer an attractive quality of experience (QoE). It is necessary to work on the latency of the cloud to improve the quality of experience (QoE) of the user because if latency were reduced then the total response time would also reduce, making it possible to provide data to the user from cloud storage in a matter of seconds (Ridhawi et al., 2017; Liang et al., 2015). This would provide a high QoE to the user and positively impact the user base.
Latency is related to the delay in the processing of data between the end user and the data center. Figure 2 depicts the procedure that occurs during a delay in online gaming, caused by the waiting queue in the cloud service architecture. When the data center could not fulfill the response to the request, the user request that had been routed to that data center is held in the waiting queue (Medara et al., 2021).
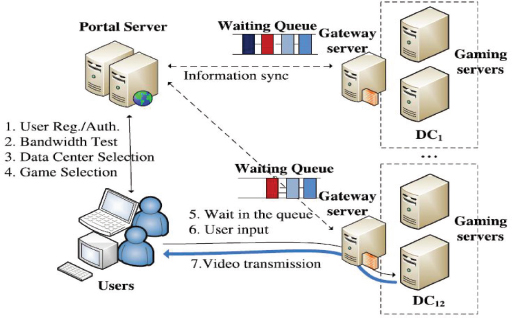
Figure 2. Cloud service procedure for online gaming waiting queue
Latency may occur at various levels of cloud computing, such as the queuing delay (Li et al., 2020), conjunction delay (Machida et al., 2015; Nathan et al., 2015), location delay etc. To better understand cloud latency, the various components of cloud service latency are described in the paragraphs that follow. These components affect the performance of the cloud service on various levels.
In the whole cloud service procedure, there are two major latency components for the cloud user.
1) Queuing Delay: Queuing delay is defined as the difference between the time when the request of a user enters the waiting queue of a data center and the time when the data center starts serving that request. This type of queuing phenomenon occurs when a data center does not have the available resources (e.g., storage memory, CPU, current time memory) to launch a new cloud server to serve more requests. In this case, the user has to wait for a unit of time before being served. Figure 3 shows a record of a waiting queue in a data center from a 7-day period. The waiting queue shows the number of users who are experiencing a delay in receiving the data they requested because of the delay in fetching the data from the server.
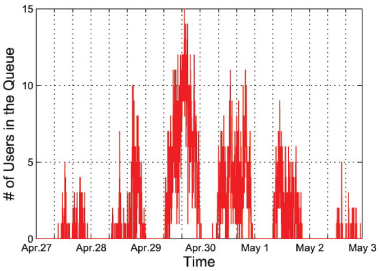
Figure 3. Number of users in the waiting queue of a data center during the period 27, April to 3, May
Figure 4 presents a comprehensive analysis of the queuing delay experienced at various time slots throughout the day within a data center, offering valuable insights into the user data center usage patterns. The queuing delay refers to the time it takes for data packets to wait in line before they are processed and transmitted, and it serves as a critical performance metric in assessing the efficiency and responsiveness of the data center's infrastructure. The figure reveals a clear and consistent trend in data center usage, showcasing a distinct pattern of load fluctuation over the course of the day. During the morning hours, the data center exhibits a relatively minimal load, indicating that fewer users or applications are accessing the system during this time. This period of reduced activity might be attributed to the majority of users being inactive or engaged in other activities, such as work or personal commitments. Most of the time, queuing delay remain between few second to several minutes, although sometimes it also extends to several hours. In any case, if the queuing delay is too long, the session is timed out and the user must choose from among other data centers or abort their request.
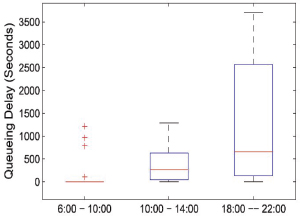
Figure 4. Queuing delay experience by user at different time slot of a day
2) Response Delay: Response delay as the difference between the time when a user sends a command to the server and the time when server decodes the generated frame and presents it to the user on the screen (response of the request), (e.g., «move to left» in any online game). According to Chen et al. (2021) response delay is further divided into three parts: Network delay, which takes place at the network side. The second one is processing delay, which takes place at the server side and the last one is payout delay, which takes place at the client side. Pay out delay and processing delay are described by hardware configuration (e.g., memory and CPU) and video/audio codes of cloud/client server (Asghari et al., 2020).
Figure 5 illustrates the response delay of a data center for the same request but in various locations. The response delay is a crucial metric in evaluating the efficiency and performance of data centers, especially when considering their proximity to different cities. As depicted in the figure, data center DC3, situated near or between multiple cities, exhibits a significantly higher response delay compared to DC1, which is located far away from urban centers.
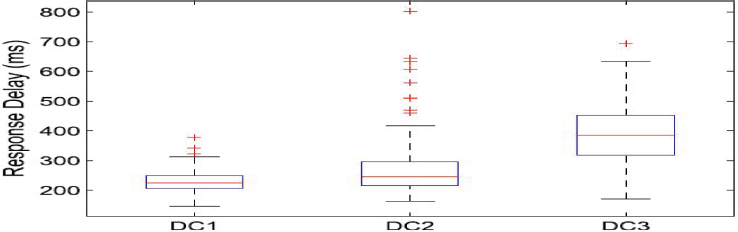
Figure 5. Response delay when selecting a different data center
The observed variations in response delay can be attributed to several factors. Data center DC3, being close to or within densely populated regions, faces higher network traffic and demands from numerous users and businesses in the surrounding cities. The increased data processing and communication requirements stemming from this concentrated user base result in a more extended response delay. Network delay is to be calculated by geographical distance between the data center and the user and the network bandwidth condition. Thus, response delay has a significant impact on the interactivity of the cloud server (Veith et al., 2023).
The methodology and research presented here regard latency measurement on various cloud center data, such as CloudUnion and IETcloud. Latency prediction is one of the most effective ways of analyzing and reducing the latency in cloud computing. If actual latency in the cloud can be predicted then reducing latency in the network could become highly effective, helping to maintain a queue in the data center (Mithila et al., 2022).
In this research paper, an improved online latency prediction mechanism is introduced that evaluates actual latency between the virtual machines, which effectively help to manage the request queue on the data center and reduce latency in the request-response process between the end-user and the data center.
The rest of this paper is organized as follows: Section 2 describes the basic approach and related work. Section 3 presents the proposed mechanism for accurate latency prediction in delay sensitive cloud services. Section 4 describes the results of both approaches and analyses them. Section 5 outlines the advantages and disadvantages of the mechanism. Section 6 draws conclusions from the conducted research and discusses future work.
2. Related Works
Karuppiah et al. (2013) proposed an approach called FARCREST. In this approach, the authors introduced an online latency prediction system for real time delay sensitive cloud services. The main aim of this paper was to develop a highly effective and accurate mechanism for service latency prediction in a small bit of time unit reflecting time-to-time of actual condition of cloud resources, while imposing minimum overheads on the cloud services themselves. The authors were motivated by an intuitive model for service latency prediction over cloud services, which was based on Euclidean Steiner Tree (EST). This approach makes use of the Euclidean Steiner tree model. All VMs were established on the basis of the tree metric in the data center. The authors elaborated on the approach of embedding latencies between various virtual machines into a Euclidean metric space estimate and on the analysis of the service latencies taken on unmeasured virtual machines by constructing the metric tree.
FARCREST provides an approach for establishing path according to requirement between the virtual machines. In the Euclidean space, to develop minimum spanning tree, the authors used Gromov Steiner point in the Euclidean Steiner tree model.
The Steiner tree constructs by intersecting edge. eab, ebc, and eac belong to E through an intermediate point known as Steiner point. A Steiner point connects up to 3 degrees in Euclidean Steiner tree (Hu et al., 2008). The ‘D’ can be measured in the Euclidean space, measuring by Gromov product for each and every host respectively. In Gromov product, ‘b’ and ‘c’ at a, denoted by (b, c) a, is defined as:
(b , c)a = 0.5 (d (a , d) + d (a , c) – d (b , c))
Figure 6 describes the Gromov point approach for the established Steiner tree. The authors were also inspired by Sequoia Steiner tree model (Malkhi et al., 2009). Then, all the work was done by Ubuntu 10.04 with the help of Rapid Miner for evaluating latency and mining data from the data center. This research contributed to a more accurate prediction of latency for better quality of experience (QoE).
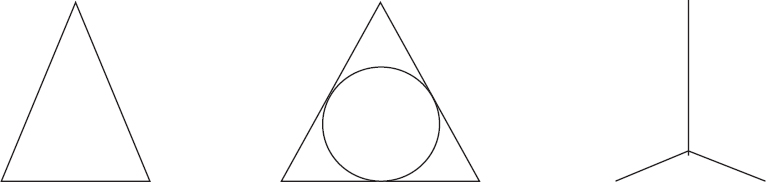
Figure 6. Gromov Point for Steiner tree
Sharma et al. (2015) proposed an approach named «A latency reduction mechanism for virtual machine resource allocation in delay sensitive cloud service», which was a modified approach of FARCREST. In this approach, the authors developed a method, which used a prediction tree to accurately analyze the latency for the completion of any task. They researched a tree architecture on tree metric and discovered some cases where the actual latency was different from the predicted one. Thus, the authors provided a special case study with the existing FARCREST for a better and more accurate latency prediction and a high quality of experience (QoE). They elaborated some cases between the three virtual machines, where two virtual machines have small distance and the third one has a large distance from both of them (Medara et al., 2022). In cases of this type, the Gromov Steiner tree would fail to provide an accurate point by which a minimum distance path could be reached. To solve this type of problem, the authors provided a special case.
Figure 7 describes the difference between Gromov point (7.a) and the suggested point (7). In the special case, the mechanism would move to the Gromov point to r/2 distance towards the nearest two virtual machines (Harzog et al., 2020; Tordsson et al., 2012), where ‘r’ denotes the radius of in-circle of the triangle. This new point provides minimum distance for Gromov approach. The authors did all the work using a mathematical model with the help of Matlab and provided the result using service latency prediction trees.
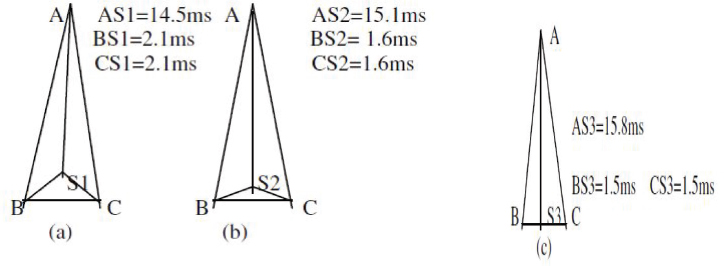
Figure 7. Special case with Gromov point
3. Proposed Work
In the proposed mechanism, there is a modified version of FARCREST with some extensions. The approach explains an online service latency prediction system for better utilization of the data center in minimum time. In the data center, all the virtual machines have been arranged in the form of tree metric. Thus, the tree modal plays a major role in finding the minimum latency path between virtual machines. It makes it possible to calculate the service latency using minimum spinning tree through the summation of tree edges’ values between two virtual machines and evaluate them with the partially predicted and collected results from the experiment. Our mechanism has three sub parts, in the first part, the mechanism describes an algorithm for the minimum path distance intermediate node between VMs, which helps us to connect them with minimum distance path. Second part describes the procedure for expending tree architecture with a new VM. The third part has an algorithm for construct and analysis to the tree.
In our proposed work, introduced a new (ECST) point on the place of Gromov Steiner point, which was used in FARCREST to analysis and measurement shortest path in the virtual machines tree architecture. The proposed ECST point provides a shorter path than Gromov Steiner point by using the virtual machine tree architecture, which plays a very critical role in the analysis of service latency prediction in delayed sensitive cloud services.
Mechanism use Euclidean Steiner Tree model and ECST point to predict accurate latency in the cloud services. In the mechanism metric space (V, d) a, b, c belong to V. Meanwhile, d(a,b), d(a,c), and d(b,c) are the latencies of the services respective to the a , b and c. This set of measurements is followed on the tree metric and they work on these properties:
1. Symmetry—d
(a , b) = d (b , a)
2. Triangle—-- d (a , c) <= d (a, b) + d (b , c)
3. Negativity – d (a , b) >= 0
Figure 8 presents a point which gives a better result than the Gromov Steiner point in every case, also including the special case. This mechanism is called the ECST point. This point indicates as the third in-circle center (O”) of any triangle with respect to minimum distance. This point gives a better result in every case except the equilateral triangle.

Figure 8. Euclidean Circle Steiner Tree Point
The ECST point calculation procedure involves firstly, taking any three co-ordinates A, B, C and forming a triangle. The in-circle center (O) of that triangle is calculated. Then, the distance of the three points A, B, C from the center (O) is checked and a new triangle is made with (O) and two closest points (B, C) from (O). A triangle with O, B, C is made and the in-circle center (O’) of triangle OBC is calculated. The distance of all three points A, B, C from the center(O’) is calculated and a new triangle is made with (O’) and two closest points (B, C) from (O’). A triangle is made again with O’, B, C and the in-circle center (O’’) is calculated. Thus, O’’ is the point which gives us the total shortest path between points A, B and C.
Table 1 shows the difference between the distance in both approaches, at the same coordinates. In our proposed mechanism, FARCREST is fundamental. In the proposed work, the Gromov Steiner point was replaced with the proposed ECST point, which gives a better and more accurate result. It helps us to more accurately predict latency between the virtual machines in the data center.
Table 1. Gromov distance vs ECST distance
Co-ordinate |
Total path distance in Gromov Steiner point |
Total path distance in ECST point |
(1000,1000), (0,0), (2000,0) |
13626.87101 |
11762.39704 |
(1000,0), (-9856, -9878), (0,0) |
19107.19649 |
15121.77189 |
Service Latency Prediction Tree (SLPT)
1. If there is a single virtual machine, there is no tree formation for service latency prediction.
2. For the second virtual machine, connect the virtual machines with a straight line.
3. To join the third virtual machine with the existing two, call the Euclidean Circle Steiner Tree (ECST) model.
4. Construct the SLPT with the suggested ECST point.
5. To join any new virtual machine with the existing tree, call the Join Tree Model (JTM)
6. Save the existing tree.
7. Repeat step ‘5’ of service prediction latency tree (SPLT) to add new VM to an existing tree.
8. End.
Join Tree Model (JTM)
1. Fetch virtual machine co-ordinates to join with existing SLPT.
2. Find out the two nearest virtual machines(co-ordinate) in the SPLT from the new virtual machine(co-ordinate).
3. Get co-ordinates of all three virtual machines.
4. Call ECST to find shortest path point.
5. Connect new Steiner point with the closest ECST point of SLPT.
6. Now, join one of the two virtual machines with new ECST point which is closer to it.
7. End,
Euclidean Circle Steiner Tree (ECST)
I. Fetch 3 VMs’ co-ordinates
II. Verify all tree metric conditions
Symmetry—d (a , b) = d (b, a )
Triangle —-- d (a , c) <= d (a, b ) + d (b, c)
Negativity – d (a , b) >= 0
III. If all three conditions are satisfied then create a triangle between them.
Otherwise
All co-ordinates represent a straight line.
Take median of that line as ECST point.
IV. Calculate the distance between all three VMs.
V. If all distances are equal, find the in-center of the triangle which is ECST point
Otherwise find the in-center (O) of the triangle and calculate distance of point ‘O’ with each of the three virtual machines.
VI. Take two closest virtual machines from the center (‘O’) and create a triangle using ‘O’ and these two virtual machines.
VII. Find in-center (P) of new triangle (BOC) and evaluate its distance from all three virtual machines.
VIII. Take two closest virtual machines from point(P) and create a triangle using point ‘P’ and these two virtual machines and again create a triangle (BPC).
IX. Find the in-center (R) of new triangle (BPC). Point (R), as the ECST point, provides minimum distance for joining the new VMs with existing SPLT. The send point (R) co-ordinates are the result of the ECST algorithm.
X. End
Join Tree Model
If any new virtual machine requires joining with SPLT, then two closest VMs of the SPLT are taken from the new VM to call ECST, to join all three virtual machines. It searches the closest ECST point of SPLT from the new ECST point and joins them. Then, any of the two virtual machines is joined to new SPLT, (which would be chosen according to the calculation of the new ECST point in SLPT), as one virtual machine is closest to that point.
Figure 9. (a) shows a virtual machine with a straight path. Figures 9. (b) and 9(c) show how a new virtual machine is connected with a straight path. At last, Figure 9. (d) shows how a new VM is joined with already existing SPLT.

Figure 9. (a) Two VMs, (b) Three VMs, (c) Three VMs with ECST, (d) Four VMs,
4. Result and Analysis
Matlab was used to implement the proposed work. Both types of latency prediction approaches FARCREST and HARIGEETA, were compared with basic latency results. Table 2 presents the results. It shows the difference between the latency of both approaches. Figure 10 shows the time latency graph of both approaches, under the same conditions.
Table 2. Latency analysis with various location coordinate
DC1x |
DC1y |
DC2x |
DC2y |
DC3x |
DC3y |
FARCREST Latency(ms) |
HARIGEETA Latency(ms) |
2000 |
1500 |
150 |
0 |
0 |
0 |
3256.510668 |
2562.197761 |
700 |
0 |
0 |
0 |
10 |
8000 |
10721.91544 |
8627.953398 |
1000 |
9989 |
0 |
0 |
2000 |
0 |
13612.51393 |
11751.52159 |
100 |
10000 |
2000 |
0 |
0 |
0 |
13677.51664 |
11801.44418 |
9000 |
9000 |
0 |
0 |
900 |
0 |
16577.5637 |
13149.03906 |
10000 |
10000 |
0 |
0 |
2000 |
0 |
18063.21708 |
15101.79885 |
-9856 |
-9878 |
1000 |
0 |
0 |
0 |
19107.19649 |
15121.77189 |
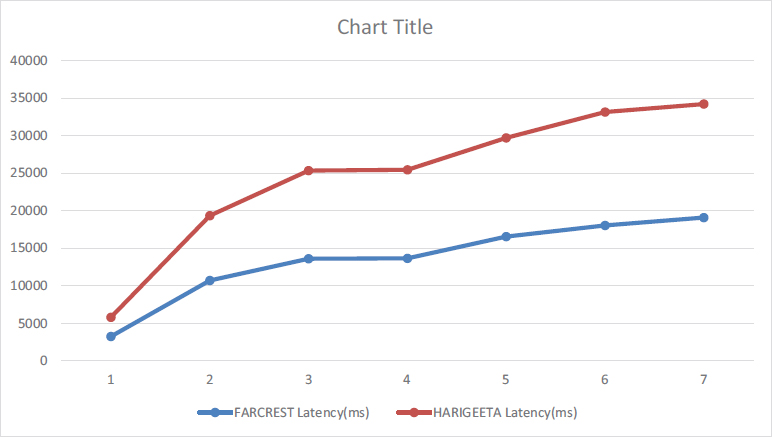
Figure 10. Latency Graph between FARCREST and HARIGEEA
The table provides information related to the coordinates and latencies of a series of data centers (DC), named DC1, DC2, and DC3, as well as the latencies to these data centers, of the two compared approaches, named FARCREST and HARIGEETA. Let's break down each column: DC1x, DC1y: These columns represent the x and y coordinates of the first data center, DC1. DC2x, DC2y: These columns represent the x and y coordinates of the second data center, DC2. DC3x, DC3y: These columns represent the x and y coordinates of the third data center, DC3. In FARCREST Latency(ms), the column provides the latency in milliseconds from the FARCREST algorithm to each data center (DC1, DC2, and DC3) and in the HARIGEETA Latency(ms), the column provides the latency in milliseconds from the HARIGEETA location to each data center (DC1, DC2, and DC3). Each row in the table represents a different set of coordinates for the data centers, and the corresponding latencies through FARCREST and HARIGEETA algorithm to these data centers. For example, the first row represents the coordinates (2000, 1500) for DC1, (150, 0) for DC2, and (0, 0) for DC3. The latencies from data centers are approximately 3256.51 ms for the FARCREST algorithm, 2562.20 ms for the HARIGEETA algorithm. The table helps to compare the latencies from different locations to each data center based on their coordinates.
In the realm of data center management, latency prediction plays a pivotal role in optimizing performance and ensuring seamless load balancing among virtual machines in the database. In this context, HARIGEETA emerges as a remarkable solution, showcasing its superiority by providing an impressive accuracy rate of more than 8-11 % in latency prediction compared to its counterpart, FARCREST, under identical conditions.
The significance of accurate latency prediction cannot be overstated, as it directly impacts the overall efficiency and responsiveness of the data center. By accurately forecasting the time it takes for data packets to traverse between virtual machines and the database, HARIGEETA empowers administrators with invaluable insights. This level of precision enables them to make well-informed decisions on resource allocation and load balancing, ensuring that computing resources are optimally distributed based on real-time demands.
The benefits of HARIGEETA's superior accuracy extend far beyond routine maintenance and resource management. With the ability to precisely gauge latency between virtual machines, data center operators can proactively identify potential bottlenecks and address them before they escalate into critical issues. Consequently, this proactive approach contributes to a significant reduction in downtime, ensuring continuous and uninterrupted service delivery to users.
As part of our study, we have examined the outcomes obtained by previous studies in the field of cloud services. The performances of our proposed algorithm may be assessed against the results of other state-of-the-art approaches, concentrating on estimation availability and latency. For instance, Cao et al. (2018) reduced the 85th percentile prediction error by 2.5 % by predicting latency using stochastic models and experience availability (EA). Our method was equivalent to that of Cao et al. in terms of accuracy with a latency prediction accuracy of over 92 %. Similar to our proposed system, which achieved over 96 % accuracy in high availability. Amaral et al. (2019) worked on the availability of cloud data storage systems and obtained an accuracy of over 87 %. Additionally, Li et al. (2017) conducted a related research that made use of optimization strategies for data reconstruction based on cloud service availability. Integer programming techniques were also used by Liu et al. (2016) to estimate latency and availability in the AWS, Azure Cloud, and Google Cloud, with an accuracy rate of 70 %. To duplicate data across different cloud providers, Mao et al. (2016), Lepakshi et al. (2020), and Chakravarthi et al. (2020) developed the cloud-of-clouds concept with different approaches, which reduced latency by 35 %, 42 %, and 59 %, respectively, and improved availability to over 78 %, 72 % and 85 %, respectively. Cho et al. (2017) reduced latency (68 %) in a cloud environment when migrating to network function virtualization (NFV).
4.1. Advantages and Disadvantages
Accurate prediction is undeniably a powerful tool that bestows a myriad of benefits and elevates the efficiency of every task at hand. By enabling us to anticipate the next steps well in advance of completing our current approach, it equips us with the foresight to optimize our strategies and make informed decisions. This pre-execution advantage, in turn, translates into a significant boost in the execution of our overall approach. In the realm of virtual machine networks, our innovative mechanism takes center stage, offering a solution that unveils the shortest path between these machines within the tree metric. By doing so, it facilitates the prediction of precise latency between virtual machines, allowing for seamless and reliable communication. This not only streamlines data transmission but also enhances the overall performance and responsiveness of complex systems, fostering an environment of heightened productivity and technological advancement. In this fast-paced world, harnessing the power of accurate prediction proves to be a game-changer, propelling us towards unparalleled success in our endeavors. In the realm of cloud computing, the crucial factor of cloud service latency significantly impacts the overall response time and performance of various approaches. Our prediction approach stands out as it has the potential to enhance the efficiency of delay-sensitive cloud services. By accurately predicting response times, it not only optimizes the performance of cloud services but also revolutionizes load balancing methodologies within cloud data centers.
However, it is essential to acknowledge that the ECST (Enhanced Cloud Service Time) algorithm, which lies at the heart of our prediction approach, may require some additional time to calculate the ECST points accurately. Nevertheless, this slight delay in computation is well worth the trade-off, considering the substantial benefits it brings in terms of improved response times and enhanced load distribution in the cloud environment. By mitigating latency issues and delivering precise predictions, our approach paves the way for a more efficient and reliable cloud computing ecosystem, catering to the demands of both users and applications alike.
5. Conclusion and Future Scope
Our innovative approach represents a significant advancement in predicting latency between virtual machines, thereby revolutionizing load balancing within data centers. By accurately forecasting latency, we can optimize resource allocation, ensuring efficient and seamless operations. The core of our approach lies in the response time distribution process among virtual machines, which enables us to fine-tune their interactions, resulting in enhanced overall system performance. Furthermore, we explore the integration of ECST (Efficient Communication and Scheduling Technique) into other network-related mechanisms, unlocking a multitude of benefits. By leveraging ECST in diverse network processes, we aim to streamline operations, minimize overhead costs, and reduce the overall length of these mechanisms. This integration offers a groundbreaking solution that not only optimizes resource utilization but also delivers remarkable gains in network latency reduction. The ramifications of our approach extend beyond data centers, as it also positively impacts various network architectures. By employing ECST, we can efficiently tackle latency issues, enabling seamless and rapid data transmission across different network nodes. Ultimately, this comprehensive strategy promises to reshape the landscape of virtual machine communication, load balancing, and network optimization, driving us towards a more interconnected, responsive, and cost-effective future. Future research could explore the integration of more advanced machine learning techniques, such as deep learning and neural networks, to enhance the accuracy of latency prediction models. In the future, the research could be extended to address latency prediction and load balancing challenges in multi-cloud environments, where applications span across multiple cloud providers.
References
Alharbi, F., Yu-ChuTian, Tang, M., Zhang, W.-Z., Peng, C., & Fei, M. (2019). An ant colony system for energy-efficient dynamic virtual machine placement in data centers. Expert Systems with Applications, 120, 228–238
Amaral, D. M., Gondim, J. J. C., Albuquerque, R. D. O., Orozco, A. L. S., & Villalba, L. J. G. (2019). Hy-sail: Hyper-scalability, availability and integrity layer for cloud storage systems. IEEE Access, 7, 90082–90093. https://doi.org/10.1109/ACCESS.2019.2925735
Ardagna, D., (2015). Cloud and multi-cloud computing: Current challenges and future applications. IEEE/ACM 7th International Workshop on Primary Engineering Service-Oriented and Cloud Systems, https://doi.org/10.1109/PESOS.2015.8 (Workshop)
Asghari, A., Sohrabi, M. K., & Yaghmaee, F. (2020). Online scheduling of dependent tasks of cloud ‘s workflows to enhance resource utilization and reduce the makespan using multiple reinforcement learning-based agents. Soft Computing, 24(21), 16177–16199.
Balasubramanian, V., Zaman, F., Aloqaily, M., Alrabaee, S., & Reisslein, M. (2019). Reinforcing the edge: Autonomous energy management for mobile device clouds. In IEEE International Conference on Computer Communications
Cao, R., Tang, Z., Li, K., & Li, K. (2018). Hmgowm: A hybrid decision mechanism for automating migration of virtual machines. IEEE Trans. on Services Computing. https://doi.org/10.1109/TSC.2018.2873694
Chakravarthi, K., Shyamala, L., & V., V. (2020). Budget aware scheduling algorithm for workflow applications in iaas clouds. Cluster Computing
Chen, K., Lei, C., Tseng, P., Chang, Y., & Huang, C., (2021). Measuring the latency of cloud gaming systems. 19th ACM International Conference on. Multimedia, pp. 1269–1272.
Cho, D., Taheri, J., Zomaya, A. Y., & Bouvry, P. (2017). Real-time virtual network function (vnf) migration toward low network latency in cloud environments. In 2017 IEEE 10th International Conference on Cloud Computing (CLOUD). https://doi.org/10.1109/CLOUD.2017.118
Harzog, B., (2020). Infrastructure Performance Management for Virtualized Systems. White Paper APM Experts, pp. 1-18.
Hemalata, & Singh, A., (2012). Compress analysis on low latency on different bandwidth and geographical location while using cloud-based applications. IJAET, ISSN: 2231-1963
Hu, X., & Du, D. (2008). Steiner Tree Problems in Computer Communication Networks, World Scientific Publishing Company.
Karuppiah, K. E., Lim, B. P., Yassin, Y. M., Chong, P. K., & Noor, M. F., Nazir, B. A., 2013. FARCREST: Euclidean Steiner Tree-based Cloud Service Latency Prediction System. 10th annual IEEE CCNC.
Lepakshi, V. A., & Prashanth, C. S. R. (2020). Efficient resource allocation with score for reliable task scheduling in cloud computing systems. 2nd International Conference on Innovative Mechanisms for Industry Applications (ICIMIA) (pp. 6–12). https://doi.org/10.1109/ICIMIA48430.2020.9074914
Li, P. (2017). Enabling low degraded read latency and fast recovery for erasure coded cloud storage systems. 47th Annual IEEE/IFIP International Conference on Dependable Systems and Networks Workshops (DSN-W). https://doi.org/10.1109/DSN-W.2017.27
Li, C., Zhang, Y., Hao, Z., & Luo, Y. (2020). An effective scheduling strategy based on hypergraph partition in geographically distributed datacenters. Computer Networks, 170, 107096.
Liang, Y.-C., Hung, S.-C., Lien, S.-Y., Chen, K.-C., (2015). Ultra-low-latency ubiquitous connections in heterogeneous cloud radio access networks, IEEE Wireless Communication., vol. 22, no. 3, pp. 22_31
Liu, G., & Shen, H. (2016). Minimum-cost cloud storage service across multiple cloud providers. IEEE 36th International Conference on Distributed Computing Systems (ICDCS). https://doi.org/10.1109/ICDCS.2016.36
Machida, F., Trivedi, K. S., & Kim D. S, (2015). Modeling and analysis of software rejuvenation in a server virtualized system. Perform. Eval., vol. 70, no. 3, pp. 212_230.
Malkhi, D., Kuhn, F., Ramasubramanian, V., Balakrishnan, M., Akella, A., Gupta, A., (2009). On the treeness of internet latency and bandwidth. ACM SIGMETRICS
Mao, B., Wu, S., & Jiang, H. (2016). Exploiting workload characteristics and service diversity to improve the availability of cloud storage systems. IEEE Transactions on Parallel and Distributed Systems, 27, 2010–2021. https://doi.org/10.1109/TPDS.2015.2475273
Medara, R., & Singh, R.S., (2022). A Review on Energy-Aware Scheduling Techniques for Workflows in IaaS Clouds. Wireless Personal Communication, 125, pages1545–1584
Medara, R., Singh, R. S., & Amit. (2021). Energy-aware workflow task scheduling in clouds with virtual machine consolidation using discrete water wave optimization. Simulation Modelling Practice and Theory, 110, 102323.
Medara, R., Singh, R. S., Kumar, U. S., & Barfa, S. (2020). Energy efficient virtual machine consolidation using water wave optimization. IEEE Congress on Evolutionary Computation (CEC) (pp. 1–7). IEEE.
Miladinovic, I., Schefer-Wenzl, S., Burger, T., & Hirner, H., (2021). Multi-Access Edge Computing: An Overview and Latency Evaluation. 22nd IEEE International Conference on Industrial Technology (ICIT), Valencia, Spain, pp. 744-748, doi: 10.1109/ICIT46573.2021.9453495.
Mithila S. P., & Baumgartner, G., (2022). Latency-based Vector Scheduling of Many-task Applications for a Hybrid Cloud. IEEE 15th International Conference on Cloud Computing (CLOUD), Barcelona, Spain, pp. 257-262, doi: 10.1109/CLOUD55607.2022.00047.
Nathan, S., Kulkarni, P., & Bellur, U., (2015). Towards a comprehensive performance model of virtual machine live migration, Proc. 6th ACM Symp. Cloud Comput., Kohala Coast, HI, USA, pp. 288_301.
Ridhawi, I. A., Mostafa, N., Kotb, Y., Aloqaily, M., & Abualhaol, I., (2017). Data caching and selection in 5g networks using f2f communication. In 2017 IEEE 28th Annual International Symposium on Personal, Indoor, and Mobile Radio Communications (PIMRC)
Sharma, R. K., Singh, S. P., Kamal P., (2015). A Latency reduction mechanism for virtual machine resource Allocation in delay sensitive cloud services. ICGCIoT.
Sharma, R. K., Singh, S. P., Kamal P., (2015). An Evaluation on Latency & its Measurement in cloud computing. INBUSH.
Tordsson, J., Monterob, R.S., Moreno-Vozmedianob, R., & Llorente, I.M., 2012. Cloud brokering mechanisms for optimized placement of virtual machines across multiple providers. Future Generation Computer Systems, Vol. 28, pp. 358–367.
Veith, A.D.S., Assunção, M. D. D., & Lefèvre, L., (2023). Latency-Aware Strategies for Deploying Data Stream Processing Applications on Large Cloud-Edge Infrastructure. IEEE Transactions on Cloud Computing, vol. 11, no. 1, pp. 445-456, doi: 10.1109/TCC.2021.3097879.