ADCAIJ: Advances in Distributed Computing and Artificial Intelligence Journal
Regular Issue, Vol. 12 N. 1 (2023), e31490
eISSN: 2255-2863
DOI: https://doi.org/10.14201/adcaij.31490
Cryptocurrency Price Prediction Using Supervised Machine Learning Algorithms
Divya Chaudharya, Sushil Kumar Saroja
aDepartment of computer science and engineering, MMMUT, Gorakhpur, India, 273010
divyachaudhary098@gmail.com, sushil.mnnit10@gmail.com
ABSTRACT
As a consequence of rising geo-economic issues, global currency values have declined during the last two years, stock markets have performed poorly, and investors have lost money. Consequently, there is a renewed interest in digital currencies. Cryptocurrency is a fresh kind of asset that has evolved as a result of fintech innovations, and it has provided a major research opportunity. Due to price fluctuation and dynamism, anticipating the price of cryptocurrencies is difficult. There are hundreds of cryptocurrencies in circulation around the world and the demand to use a prediction system for price forecasting has increased manifold. Hence, many developers have proposed machine learning algorithms for price forecasting. Machine learning is fast evolving, with several theoretical advances and applications in a variety of domains. This study proposes the use of three supervised machine learning methods, namely linear regression, support vector machine, and decision tree, to estimate the price of four prominent cryptocurrencies: Bitcoin, Ethereum, Dogecoin, and Bitcoin Cash. The purpose of this study is to compute and compare the precision of all three techniques over all four datasets.
KEYWORDS
Cryptocurrency; Bitcoin; Blockchain; Machine Learning; Price Prediction
1. Introduction
A cryptocurrency is an encrypted digital currency that prevents forgery and double expenditure. It is not created by a centralized authority or banking system and is a distributed virtual currency that may be traded via encrypted means. Mined virtual currencies may be purchased on a crypto exchange. Furthermore, not all e-commerce sites accept the purchase of cryptocurrencies. Even well-known cryptocurrencies such as Bitcoin are seldom employed for retail transactions. In contrast, cryptocurrencies have gained popularity as trading tools due to their rising value. They are also used in a limited capacity for international transfers.
Blockchain is the technology that supports Bitcoin and the vast majority of other cryptocurrencies. It maintains a tamper-proof ledger of events and keeps a record of who possesses what. All peer-to-peer transactions are recorded on a blockchain which is a decentralized ledger. Participants may validate transactions even without a requirement for a centralized authority using this technology. A blockchain is, at its most fundamental level, a publicly verifiable catalog of transactions. Based on how they are employed, the component units of digital currencies are known as either coins or tokens. Some are intended to be used as mediums of exchange for goods or services, some as repositories of worth, and still others to participate in specific software applications, such as gaming and investment derivatives.
Regardless of the perspective, Bitcoin is a high-risk investment. Cryptocurrency does not fulfill the economic qualities of a currency, based on the viewpoint and characteristics of conventional money. The crypto market is one of the most tempting places for financial speculators, indicating growth in deceptive activities on social media. Some investors, especially those with a high-risk appetite, are interested in Bitcoin investments. Numerous people have had substantial gains from digital market speculation. Consequently, forecasts are used by market analysts and speculators. Due to variations in each coin’s prognostic capacity, machine learning, and artificial intelligence algorithms are rather fascinating today.
Cryptocurrencies with slow growth are more dependable than those with fluctuation. In contrast, rate patterns are very controversial and unpredictable. Based on historical data, machine learning model predictions allow organizations to formulate extremely accurate hypotheses about the predicted outcomes of a query. Machine learning can only be used to forecast cryptocurrency values when users analyze historical price fluctuations before purchasing and selling cryptocurrencies. The values of cryptocurrencies change from time to time, shifting unpredictably, as their tempo is unknown. As a consequence, forecasting is tough for academics and related fields.
The goal of this research paper is to predict the price of Bitcoin, Ethereum, Dogecoin, and Bitcoin Cash for five days using the current close price, using the supervised machine learning algorithms (SVM), linear regression, and decision tree, while comparing and evaluating the accuracy of all three methodologies. The rest of this paper is organized into a literature review in Section 2. The proposal is described in Section 3. Performance evaluation is presented in Section 4. Finally, the paper is concluded and future lines of research are discussed in Section 5.
2. Related Work
Cryptocurrencies are progressively changing the dynamics of the traditional money market. Many methods have been proposed for predicting the closest value for the currency. It is stated that social media sentiments also have a huge role in the changing dynamics of cryptocurrency. Therefore, many research works were performed previously that state the various factors that affect the currency market. This part includes the literature-based efforts on cryptocurrency price prediction using machine learning, deep learning, and social media sentiments. Several recent research works are investigated.
Jang et al. (2017) argued that bitcoin and national currencies exhibit propagation of volatility shocks, while policy uncertainty has no influence. They deployed Bayesian neural network models coupled with characteristics obtained from Bitcoin and blockchain technology’s principles. The authors validated the Currency’s high volatility and developed an effective price time-series data predictor. Madan et al. (2015) investigate the connection between big data and cryptocurrency. Classification-wise, they addressed the topic of anticipating Bitcoin’s price changes. 98.7 percent accuracy was reached for daily forecasts, and 50-55 percent utilizing 10-minute intervals.
Chen et al. (2013) established investing strategies by analyzing and categorizing Twitter feeds. Go et al. (2009) evaluate the classification performance of classifiers trained using a dataset simplified by remote monitoring. Recent research has focused on high-frequency trading and the use of deep-learning methods such as RNN for the prediction of time series data using dense, feed-forward neural networks as function models. Andrianto et al. (2017) show that including cryptocurrency in a portfolio improves its performance in two distinct ways. The primary goal is to reduce standard deviation, while the secondary purpose is to provide investors with other allocation options. The appropriate cryptocurrency allocation ranges between 5 to 20 percent, depending on the risk tolerance of the investors.
Derbentsev et al. (2021) use two machine learning approaches, random forests (RF) and stochastic gradient enhancing machine, to forecast time series data (SGBM). The results suggest that the ML ensemble method may be used to forecast the price of Bitcoin. Particularly, there is a lack in research using ML techniques to predict Bitcoin’s price. Shah et al. (2014) predicted Bitcoin’s price using a latent source model, claiming an 89 percent return in 50 days and a 4.1 Sharpe ratio. Attempts have also been made to predict the value of Bitcoin using text data from social media networks and other sources. Georgoula et al. (2014) explored sentiment analysis by combining support vector machines with the frequency of Wikipedia page views and the network hash rate.
Matta et al. (2015) analyzed the association between the price of Bitcoin, tweets, and Google Trends page views. By analyzing Google Trends, the authors forecasted Bitcoin’s trading activity rather than its price. Inadequate sample sizes and the potential for disinformation to spread across multiple (social) media channels such as Twitter or on discussion boards such as Reddit, which dramatically raise prices, are the disadvantages of such research. Hota et al. (2017), provided a model for the prediction of time series data based on the sliding window idea and the Radial Basis Functions Network (RBFN) Artificial Neural Network (ANN) approach. It illustrates some constraints, such as the introduction of hybrid or ensemble approaches with novel characteristics. Velankar et al. (2018) sought to discover and comprehend daily Bitcoin market patterns by collecting ideal characteristics around Bitcoin prices and producing a normalized graph.
Zhao et al.’s (2021) hybrid model was used for both linear and non-linear period elements of the stock dataset for future predictions. CNN and Seq2Seq LSTMs were connected well for dynamic modeling in the non-linear time series forecast including both short- and long-term dependent patterns. Yuneline et al. (2019) examined the perspectives and features of cryptocurrencies in terms of monetary characteristics, legal aspects, economic factors, and Sharia issues. Based on the perspective and characteristics of conventional money, cryptocurrencies lack the economic characteristics of a currency. Using Bayesian-optimized RNN and LSTM, McNally et al. developed two different types of Bitcoin price forecasting models. The analysis revealed that LSTM had 52% accuracy and 8% RMSE.
3. Proposed Approach
To build a prediction system using machine learning, there is a fixed set of steps that involves data collection, training the historical data, and then predicting the result by using the appropriate machine learning algorithms. Figure 1 depicts the steps involved in the prediction of the cryptocurrency price. The machine learning algorithms used in the paper are: support vector machine, linear regression, and decision tree. For this investigation, we chose to focus on four distinct cryptocurrencies due to their widespread adoption because there is a wide availability of historical price data, and overall market capitalization, namely, Bitcoin, Ethereum, Bitcoin Cash, and Dogecoin.
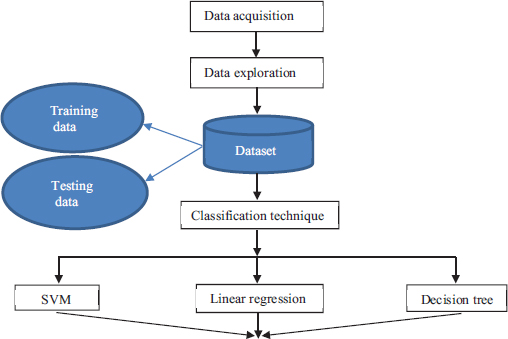
Figure 1. The steps involved in the prediction of cryptocurrency price
3.1. Data Acquisition
Coin Metrics and Coin Codex were used to collect the data for this research paper. The datasets for all four are in different CSV format files. Each dataset contains the same number of columns each defining the attribute of the currency. The dataset contains a total of six features. The details for them are as follows:
1. Close Price: This is the value of the currency at the market’s close for the day.
2. High Price: It is the day’s highest exchange rate.
3. Lowest Price: It is the day’s lowest exchange rate.
4. Open Price: The opening price of the currency market for the day.
5. Volume: The amount of currency being traded on a given day.
6. Market capitalization refers to the total value of a company’s shares or, in the case of Bitcoin or another cryptocurrency, the total value of all coins in circulation (USD).
3.2. Data Preprocessing
In the proposed work the data preprocessing steps are as follows:
1. The columns that are not needed to predict the price of the required cryptocurrency are dropped. Here, we predict the price of the required digital or virtual currency only on close price. All the other columns are unnecessary hence we need to remove them from the dataset.
2. The close column is renamed as a price column and we have declared a variable named prediction_days which stores the number of days for which we are predicting the values. Here, we have taken prediction_days value=5.
3. Another column is added in the dataset, under the title “prediction”, which contains the value of the close price shifted five days up. E.g., the prediction value for 21 May 2022 stores the close price of 16 May 2022. Hence, all the other values also shift by five days. For the last five values of the dataset, the predicted values are stored as NAN (Not a Number).
3.3. Dataset Splitting
The method involves separating a dataset into two categories. Figure 2 shows the graph of the closing price after a five-day shift.

Figure 2. Graph of closing price after five-day shift
1. Train Dataset: The dataset used to train a machine learning model.
2. Test Dataset: Used to evaluate the fitness of the machine learning model. For this research, we have used train test split ratios of 80% and 20%.
3.4. Classification Methods
We analyze and compare the accuracies of the algorithms when run on different cryptocurrencies. The applied classification techniques are to perform regression on the required dataset. The various classification techniques are discussed in the subsections that follow.
3.4.1. Support Vector Machine
It is one of the most used supervised machine learning (ML) methods, and it can solve regression and classification issues. However, it is mostly used in ML to address categorization problems. The objective of this technique is to identify the optimal line or decision boundary for dividing an n-dimensional region into categories such that more data points may be conveniently assigned to the appropriate category. The best potential choice boundary is a hyperplane. This method chooses the extreme points/vectors that contribute to the formation of the hyperplane. The attribute values are bits of information that are nearer to the feature space and influence the placement and direction of the hyperplane. The Python library used for SVM is SVR from sklearn.svm. It is a form of support vector machine that accommodates both linear and nonlinear regression. Hyper plane h(x) is defined as:
where ω is a coefficient vector, x is a sample point and b is the constant value of the distance from the origin. In the case of linear SVM if h(x)>=0 then the points fall in class 1, otherwise class 0. The maximum distance (d) between the two different support vectors is defined as:
a) Bitcoin
The dataset for Bitcoin’s daily price history spans from 31 December 2016 to 21 May 2022 and contains 1969 data points. The first 1571 data points were utilized for training and validating the model, while the remaining 393 were used for testing and predicting the values for the next five days. Figure 3 shows the true vs predicted value of the testing dataset for Bitcoin using the SVM algorithm.

Figure 3. True vs predicted value for Bitcoin using SVM
b) Ethereum
The dataset for the daily price history of Ethereum contains 1969 data points from 31 December 2016 to 21 May 2022. The first 1571 data points were utilized for testing and validating the model, while the remaining 393 were used for training and predicting the values for the next five days. Figure 4 depicts the true vs predicted value of the testing dataset for Ethereum using the SVM algorithm.
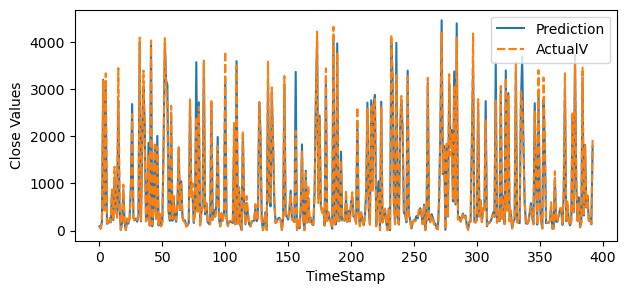
Figure 4. True vs predicted value for Ethereum using SVM
c) Dogecoin
The dataset for the daily historical price of Dogecoin contains 1969 data points from 31 December 2016, to 21 May 2022. The first 1571 data points were utilized for training and validating the model, while the remaining 393 were used for testing and predicting the values for the next five days. Figure 5 shows the true vs predicted value of the testing dataset for Dogecoin using the SVM algorithm.

Figure 5. True vs predicted value for Dogecoin using SVM
d) Bitcoin Cash
The dataset for the daily price history of Bitcoin Cash contains 1,763 data points from 20 May 2022 to 23 July 2017. The first 1406 data points were utilized for training and validating the model, while the remaining 352 were used for testing and predicting the values for the next five days. Figure 6 depicts the true vs predicted value of the testing dataset for Bitcoin using the SVM algorithm.

Figure 6. True vs predicted value for Bitcoin Cash using SVM
3.4.2. Linear Regression
Utilizing a linear equation to estimate the connection between two parameters based on observable data. One type of factor is referred to as an ‘independent variable’ while the other is referred to as a ‘dependent variable’. It is frequently used in predictive analysis. The main purpose of regression is to investigate two things. First and foremost, whether a set of predictor variables accurately predict a result (dependent) variable. The correlation coefficient is a measure of how closely two variables are related. The value of the coefficient ranges from -1 to +1. The power of the observed data’s correlation with two variables is described by this coefficient. The equation for linear regression is as follows:
M = independent factor (represented on the x-axis) N= dependent variable (represented by the y-axis) j = line’s slope, i = intercept. The Python library used for linear regression is linear_model from sklearn. Figures 7-10 express the prediction for Bitcoin, Ethereum, Dogecoin and Bitcoin Cash datasets using the linear regression algorithm.
a) Bitcoin
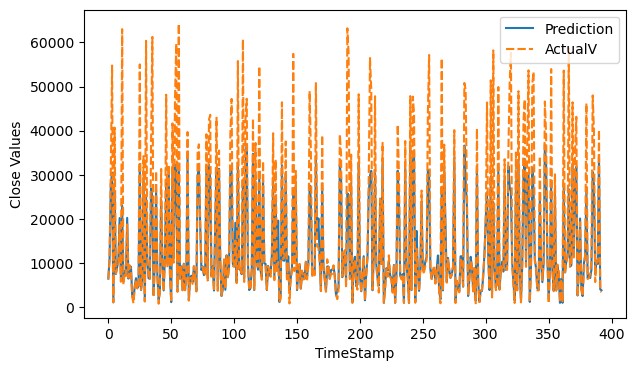
Figure 7. True vs predicted value for Bitcoin using linear regression
b) Ethereum

Figure 8. True vs predicted value for Ethereum using linear regression
c) Dogecoin
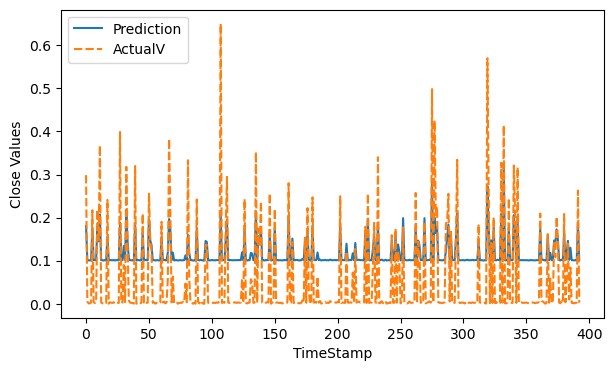
Figure 9. True vs predicted value for Dogecoin using linear regression
d) Bitcoin Cash
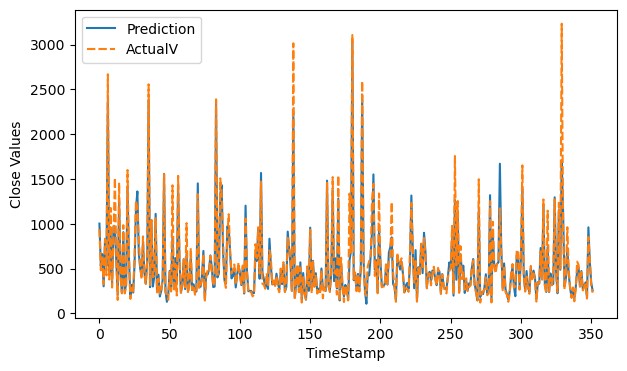
Figure 10. True vs predicted value for Bitcoin Cash using linear regression
3.4.3. Decision Tree
This is another supervised learning algorithm that may be used for both classification and regression problems, however, it is more commonly employed for classification. It is a tree-structured classifier that consists of two types of nodes: decision nodes and leaf nodes. We describe a choice or a test in decision nodes, and based on this, we can select the path to follow. The internal nodes of the tree represent the features of a dataset, while the decision rule is represented by branches, and each leaf node indicates the decision’s conclusion or result. This test is often done on the value of a feature or attribute of the instance, thus the test is on some property, and there is a branch for each result, so there may be two or more outcomes, followed by leaf nodes indicating the categorization of the instance depending on the value of the test. The Python library used for decision tree is DecisionTreeRegressor from sklearn. tree. There are some criteria such as entropy, information-gain, Gini-index, Gain-ratio, reduction in variance, and Chi square to solve the attribute selection problem. Information-gain (IG), Gini-index (GI), and Gain-ratio (GR) are defined as follows:
where Eb is an entropy before splitting, and Ea is an entropy after splitting.
where Pi is the proportion of the samples that belong to class c for a particular node.
where S1, S2…….Sn are the subsets resulting in partitioning S for attribute A.
Figures 11-14 express the prediction for Bitcoin, Ethereum, Dogecoin and Bitcoin Cash datasets using the decision tree algorithm.
a) Bitcoin

Figure 11. True vs predicted value for Bitcoin using decision tree
b) Ethereum
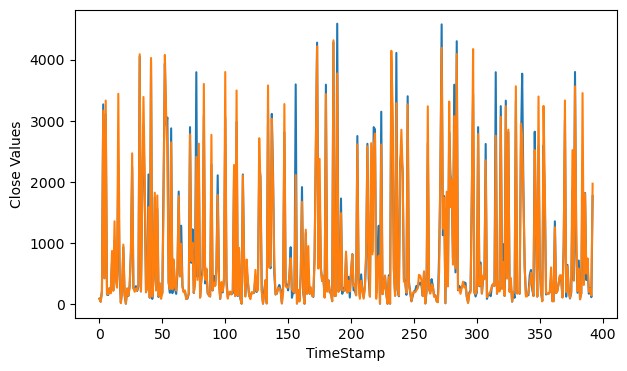
Figure 12. True vs predicted value for Ethereum using decision tree
c) Dogecoin

Figure 13. True vs predicted value for Dogecoin using decision tree
d) Bitcoin Cash

Figure 14. True vs predicted value for Bitcoin Cash using decision tree
4. Performance Evaluation
This section contains the results and analysis subsections.
4.1. Results
After implementing our program on these algorithms, we have predicted five days’ closing price values of the cryptocurrencies. These algorithms performed with certain accuracies on different datasets. Table 1 represents cryptocurrencies used in the research paper with their corresponding trading symbols, the number of observations, and the dates on which the data from the table was obtained. Tables 2-5 show the snapshots of results at different stages for Ethereum dataset. The accuracy of the proposed approach for various cryptocurrencies is shown in Table 6. The accuracy of different state-of-art approaches for Bitcoin cryptocurrency has been compared in Table 7. Figures 3-14 show the prediction graphs of four different currencies using different machine learning techniques. Figure 15 shows the bar graph of prediction for Bitcoin using the linear regression algorithm. Figure 16 shows the strip plot of prediction for Bitcoin using the linear regression algorithm.
Table 1. The obtained cryptocurrency data
Cryptocurrency |
Symbol |
Data Points |
Data Collection Dates |
Bitcoin |
Btc |
1968 |
12-31-2016 to 05-21-2022 |
Ethereum |
Eth |
1968 |
12-31-2016 to 05-21-2022 |
DogeCoin |
Dash |
1968 |
12-31-2016 to 05-21-2022 |
Bitcoin Cash |
Bch |
1763 |
07-23-2017 to 05-20-2022 |
Table 2. Snapshot showing Ethereum original dataset value from 17 May 2022 to 21 May 2022
In [30]: |
df.tail(5) |
|||||||
Out[30]: |
|
|||||||
|
|
Date |
Open |
High |
Low |
Close |
Volume |
Market Cap |
|
1963 |
May-17-2022 |
2107.876242 |
2120.682435 |
1931.4100 |
1932 271700 |
2.713261e+10 |
2.450000e+11 |
|
1964 |
May-18-2022 |
1929.116300 |
2046.025573 |
1922.7377 |
2041.142403 |
3 264130e+10 |
2.400000e+11 |
|
1965 |
May-19-2022 |
2039.065838 |
2074.823200 |
1946.9523 |
1985.743912 |
3.049357e+10 |
2.440000e+11 |
|
1966 |
May-20-2022 |
1981.411791 |
2015.449916 |
1957.7459 |
2000.331522 |
2 281244e+10 |
2.400000e+11 |
|
1967 |
May-21-2022 |
1995.853839 |
2066.098943 |
1980.1965 |
2065.544773 |
1.503812e+10 |
2.440000e+11 |
Table 3. Snapshot showing the closing price for the Ethereum dataset, shifted 5 days up
In [43]: |
df.tail(5) |
||
Out[43]: |
|
||
|
|
Price |
Prediction |
|
1963 |
1932.271700 |
NaN |
|
1964 |
2041.142403 |
NnN |
|
1965 |
1985.743912 |
NaN |
|
1966 |
2000.331522 |
NaN |
|
1967 |
2065.544773 |
NaN |
Table 4. Snapshot showing actual price from May 2022 to 22 May 2022 for Ethereum
In [71]: |
df.tail(Prediction_days) |
|
Out[71]: |
|
|
|
|
Price |
|
1963 |
1932.271700 |
|
1964 |
2041.142403 |
|
1965 |
1985.743912 |
|
1966 |
2000.331522 |
|
1967 |
2065.544773 |
Table 5. Snapshot showing code for prediction of closing price for Ethereum using linear regression
In [51]: |
|
reg_prediction = reg.predict(prediction_days_array) |
|
#predictions for the next 5 days print(reg_prediction) |
|
print()
|
|
|
[1933.58489389 2041.83945372 1986.7544851 2001.25953793 2066.10372087] |
Table 6. Accuracy of the proposed approach for various cryptocurrencies
Cryptocurrency |
SVM |
Linear regression |
Decision tree |
Bitcoin |
72.07 |
98.61 |
97.25 |
Ethereum |
98.25 |
98.35 |
96.58 |
Dogecoin |
5.71 |
95.91 |
89.93 |
Bitcoin Cash |
92.92 |
92.50 |
84.28 |
Table 7. Comparison of prediction accuracy for different approaches for Bitcoin
Authors/year |
Algorithms |
Accuracy |
Machine learning |
97.00 |
|
Linear discriminant analysis |
66.00 |
|
Logistic regression |
66.00 |
|
LSTM |
52.78 |
|
RNN |
50.25 |
|
Binomial GLM |
98.79 |
|
Random forest |
94.98 |
|
Deep leaning |
50.00 |
|
LSTM |
52.00 |
|
MLP neural network |
54.00 |
|
LSTM |
67.43 |
|
Linear regression with LSTM |
97.20 |
|
LSTM |
76.83 |
|
Ensemble LSTM |
96.86 |
|
Machine learning |
56.00 |
|
Machine learning |
97.00 |
|
Random forest |
85.00 |
|
Logistic regression |
66.00 |
|
Proposed approach |
Decision tree |
97.25 |
Linear regression |
98.61 |

Figure 15. Bar graph of prediction for Bitcoin using linear regression

Figure 16. Strip plot of prediction for Bitcoin using linear regression
4.2. Analysis
4.2.1. Applied Python Libraries
1. Panda: It is the finest tool for dealing with chaotic, real-world data. Pandas are one of the NumPy-based open-source Python programs. Using the sequence and data frame, these two data models allow to manipulate data in a variety of ways, making data manipulation in pandas very efficient and quick. It can deal with missing data and data cleansing, and it supports numerous file types. This indicates that it can read or load data in several formats, including CSV, Excel, SQL, etc.
2. NumPy: Which refers to Numerical Python, is a collection of multidimensional array entities and array-processing functions. NumPy enables the mathematical and logical manipulation of arrays. Here, we have used NumPy to take the close price of the dataset as an array from a dataset.
3. Matplotlib: It is a great Python library for visualizing 2D array charts. It is a cross-platform visual analytics toolkit based on NumPy arrays and designed to work with the whole SciPystack. There are several graphs, including lines, bars, scatter, and histograms.
4. Sklearn and Model_selection: It is a Python module that offers a variety of data processing capabilities for categorizing, grouping, and model identification. It is a method for building a strategy for data analysis and then using it to measure new data. Choosing a suitable model helps the production of reliable forecasts. To do this, a model must be trained using a certain dataset. The model is then evaluated against another dataset. If a single dataset is used, it must first be divided using the Sklearn train test split method. Train test split is a function in Sklearn model selection that divides data arrays into two subsets: training data and testing data. Using this method, manually partitioning the dataset is unnecessary. We have used the Anaconda and Jupyter notebook. We have run on the DEL laptop which has I5 processor, 4-GB RAM, and Windows 11 operating system.
As can be seen from Table 6, the most constant performance is given by the linear regression algorithm of the proposed approach which performed best for every cryptocurrency we have analyzed in this paper. The worst performance was achieved by SVM as it performed with an accuracy of 5.71% for the Dogecoin dataset. Decision tree performance was also constant but not better than linear regression. We have compared the various machine learning, deep learning, and statistical approaches in Table 7. Madan et al. have proposed the binomial GLM based approach which has the highest accuracy i.e., 98.79%. It is a statistical model. The proposed approach has second highest accuracy i.e., 98.61% which is very close to the highest reported accuracy. It is a machine learning model. Andi et al. have designed a hybrid model of machine learning and deep learning i.e., linear regression with LSTM. It has the third highest accuracy i.e., 97.20%. Statistical methods are error prone and work on homogeneous data only. Deep learning approaches have a good prediction accuracy, but these approaches require a large amount of time, processing power, and input size to produce the same results as compared to machine learning methods. The proposed approach is a machine learning based approach. It has a prediction accuracy that is better than most deep learning approaches. In this scenario, the accuracy of the proposed model becomes more relevant.
5. Conclusion and Future Research
The crypto market is a fast-developing canvas of commerce and investment that has attracted unprecedented global interest from dealers, investors, and entrepreneurs. Offering comparative research and results from market pricing information for cryptocurrencies can assist in documenting the peculiarities and practices of such a lucratively arduous and swiftly increasing market. Therefore, the fundamental contribution of this paper is to provide a detailed overview of each algorithm employed in this examination of major digital currencies. The dataset that was collected is for five years and the best discovered method is linear regression, which provides consistent results for all currencies. The accuracy of proposed approach is 98.61%. The algorithm also forecasts the closing price for the next five days and tries to give the most accurate results. As stated in the introduction, the digital currency market is also impacted by social media mood, elections, etc. The movements are identical to those seen on the stock market; thus, in the future, the algorithm may be enhanced to analyze social media emotions before making predictions.
Declaration Statement
We have no conflicts of interest corresponding to this paper.
References
Andi, H. K. (2021). An Accurate Bitcoin Price Prediction using logistic regression with LSTM Machine Learning model. Journal Of Soft Computing Paradigm, 3(3), 205-217. https://doi.org/10.36548/jscp.2021.3.006
Andrianto, Y., & Diputra, Y. (2017). The Effect of Cryptocurrency on Investment Portfolio Effectiveness. Journal of Finance and Accounting, 5(6), 229-238. https://doi.org/10.11648/j.jfa.20170506.14
Awotunde, J. B., Ogundokun, R. O., Jimoh, R. G., Misra, S., & Aro, T. O. (2021). Machine Learning Algorithm for Cryptocurrencies Price Prediction. Artificial Intelligence for Cyber Security: Methods, Issues, and Possible Horizons or Opportunities, 972, 421-447. https://doi.org/10.1007/978-3-030-72236-4_17
Bangroo, R., Gupta, U., Sah, R., and Kumar, A. (2022), “Cryptocurrency price prediction using machine learning algorithm,” 10th International Conference on Reliability, Infocom Technologies and Optimization (Trends and Future Directions) (ICRITO), 1-4. Noida, India. https://doi.org/10.1109/ICRITO56286.2022.9964870
Basher, S. A., and Sadorsky, P. (2022). Forecasting Bitcoin price direction with random forests: How important are interest rates, inflation, and market volatility? Machine Learning With Applications, 9, 100355. https://doi.org/10.1016/j.mlwa.2022.100355
Chen, R., & Lazer, M. (2013). Sentiment analysis of Twitter feeds for the prediction of stock market movement. Stanford edu Retrieved, January 25.
Chen, Z., Li, C., & Sun, W. (2020). Bitcoin price prediction using machine learning: An approach to sample dimension engineering. Journal Of Computational And Applied Mathematics, 365, 112395. https://doi.org/10.1016/j.cam.2019.112395
Cherati, M. R., Haeri, A., & Ghannadpour, S. F. (2021). Cryptocurrency direction forecasting using deep learning algorithms. Journal Of Statistical Computation And Simulation, 91(12), 2475-2489. https://doi.org/10.1080/00949655.2021.1899179
Chintalapati, J. B., Pratyusha, P. P. S., Keerthi, V. U., & Jatin, K., S. (2020). Bitcoin price prediction using time series analysis observations marked with a timestamp. Journal of Engineering Sciences, 11(5), 8-14.
Derbentsev, V., Babenko, V., Khrustalev, K., Obruch, H., & Khrustalova, S. (2021). Comparative performance of machine learning ensemble algorithms for forecasting cryptocurrency prices. International Journal of Engineering, 34(1), 140-148. https://doi.org/10.5829/ije.2021.34.01a.16
Dimitriadou, A., & Gregoriou, A. (2023). Predicting Bitcoin prices using machine Learning. Entropy, 25(5), 777. https://doi.org/10.3390/e25050777
Georgoula, I., Pournarakis, D., Bilanakos, C., Sotiropoulos, D., and Giaglis, G. M. (2014). Using Time-Series and Sentiment Analysis to Detect the Determinants of Bitcoin Prices. Social Science Research Network. Available at SSRN 2607167. https://doi.org/10.2139/ssrn.2607167
Go, A., Bhayani, R., & Huang, L. (2009). Twitter sentiment classification using distant supervision. CS224N project report, 1(12). Stanford.
Hosure, N. S., Gaikwad J. V., Shravani M. R., Kulloli N., & Madhusudhan H. S. (2022). Cryptocurrency price prediction using machine learning. International Journal of Advanced Research in Computer and Communication Engineering, 11(6), 645-651.
Hota, H. S., Handa, R., & Shrivas, A. K. (2017). Time series data prediction using sliding window based RBF neural network. International Journal of Computational Intelligence Research, 13(5), 1145-1156.
Ibrahim, A., Kashef, R., & Corrigan, L. (2021). Predicting market movement direction for bitcoin: A comparison of time series modeling methods. Computers & Electrical Engineering, 89, 106905. https://doi.org/10.1016/j.compeleceng.2020.106905
Jang, H. & Lee, J. (2017). An empirical study on modeling and prediction of bitcoin prices with Bayesian neural networks based on blockchain information. IEEE Access, 6, 5427-5437. https://doi.org/10.1109/access.2017.2779181
Jaquart, P., Dann, D., & Weinhardt, C. (2021). Short-term bitcoin market prediction via machine learning. The Journal Of Finance And Data Science, 7, 45-66. https://doi.org/10.1016/j.jfds.2021.03.001
Madan, I., Saluja, S., & Zhao, A. (2015). Automated bitcoin trading via machine learning algorithms. URL: http://cs229.Stanford.edu/proj2014/Isaac%20Madan, 20.
Matta, M., Lunesu, I., & Marchesi, M. (2015). Bitcoin spread prediction using social and web search media. UMAP workshops, 1-10.
McNally, S., Roche, J., and Caton, S. (2018). Predicting the price of Bitcoin using machine learning 26th Euromicro International Conference on Parallel, Distributed and Network-based Processing (PDP), 339-343. https://doi.org/10.1109/PDP2018.2018.00060
Shah, D., & Zhang, K. (2014). Bayesian regression and Bitcoin. 52nd Annual Allerton Conference on Communication control and Computing (Allerton), 409-414. https://doi.org/10.1109/ALLERTON.2014.7028484
Shin, M. J., Mohaisen, D., & Kim, J. (2021). Bitcoin price forecasting via ensemble-based LSTM deep learning networks. International Conference on Information Networking (ICOIN), Jeju Island, Republic of Korea, 603-608. https://doi.org/10.1109/ICOIN50884.2021.9333853
Velankar, S., Valecha, S., & Maji, S. (2018). Bitcoin price prediction using machine learning. 20th International Conference on Advanced Communication Technology (ICACT), 144-147. https://doi.org/10.23919/ICACT.2018.8323675
Wei, W., Zhang, Q., & Ling, L. (2021). Bitcoin transaction forecasting with deep network representation learning. IEEE 543 Transactions on Emerging Topics in Computing, 9(3), 1359-1371. https://doi.org/10.1109/TETC.2020.3010464
Yuneline, M. H. (2019). Analysis of cryptocurrency’s characteristics in four perspectives. Journal Of Asian Business And Economic Studies, 26(2), 206-219. https://doi.org/10.1108/jabes-12-2018-0107
Zhao, Y., & Chen, Z., (2021). Forecasting stock price movement: new evidence from a novel hybrid deep learning model. Journal Of Asian Business And Economic Studies, 29(2), 91-104. https://doi.org/10.1108/jabes-05-2021-0061