ADCAIJ: Advances in Distributed Computing and Artificial Intelligence Journal
Regular Issue, Vol. 13 (2024), e31420
eISSN: 2255-2863
DOI: https://doi.org/10.14201/adcaij.31420
Deep and Machine Learning for Acute Lymphoblastic Leukemia Diagnosis: A Comprehensive Review
Mohammad Faiza, Bakkanarappa Gari Mounikaa, Mohd Akbarb and Swapnita Srivastavac
a School of Computer Science and Engineering, Lovely Professional University, Phagwara, Punjab, India
b Department of Computer Science and Engineering, Integral University, Lucknow, India
c Department of Applied Computer Science and Engineering, GLBITM, Greater Noida, India
faiz.techno20@gmail.com, mounikareddyb0305@gmail.com, alakbar.com@gmail.com, swapnitasrivastava@gmail.com
ABSTRACT
The medical condition known as acute lymphoblastic leukemia (ALL) is characterized by an excess of immature lymphocyte production, and it can affect people across all age ranges. Detecting it at an early stage is extremely important to increase the chances of successful treatment. Conventional diagnostic techniques for ALL, such as bone marrow and blood tests, can be expensive and time-consuming. They may be less useful in places with scarce resources. The primary objective of this research is to investigate automated techniques that can be employed to detect ALL at an early stage. This analysis covers both machine learning models (ML), such as support vector machine (SVM) & random forest (RF), as well as deep learning algorithms (DL), including convolution neural network (CNN), AlexNet, ResNet50, ShuffleNet, MobileNet, RNN. The effectiveness of these models in detecting ALL is evident through their ability to enhance accuracy and minimize human errors, which is essential for early diagnosis and successful treatment. In addition, the study also highlights several challenges and limitations in this field, including the scarcity of data available for ALL types, and the significant computational resources required to train and operate deep learning models.
KEYWORDS
Acute lymphoblastic leukemia; Machine learning; Deep learning; Blood smear images
1. Introduction
Blood plays a vital role in our body. The bone marrow, a pliable material situated at the core of bones, helps to make blood cells (Alsalem et al., 2018). Once mature blood cells are generated within the bone marrow, they are discharged into the blood and transported throughout the body. The main function of red blood cells is to transport oxygen from the lungs to various tissues and organs throughout the body. Additionally, they also help to remove carbon dioxide (CO2), which is produced during cellular respiration, and return it to the lungs for exhalation, while platelets are responsible for stopping bleeding. The immune system mainly depends on white blood cells to fight off infections. Leukemia, a type of blood cancer disease, is characterized by the abnormal production of white blood cells known as blast cells. Acute and chronic are two types of leukemia (Aftab et al., 2021). Acute is characterized by abnormal blast cells that never fully mature and disrupt regular body processes, whereas chronic leukemia grows more slowly.
Acute leukemia can rapidly worsen if left untreated. Acute lymphoblastic leukemia or ALL is a subtype of acute leukemia that impacts white blood cells called lymphocytes, specifically immature B cells and T cells. These blast cells divide rapidly and replace the regular cells found in the bone marrow, which causes a decrease in the production of normal or healthy cells shown in Figure 1 (Anilkumar et al., 2022). The main cause of ALL is not entirely clear, but some risk factors include exposure to radiation or chemicals, certain genetic conditions, and a weakened immune system.
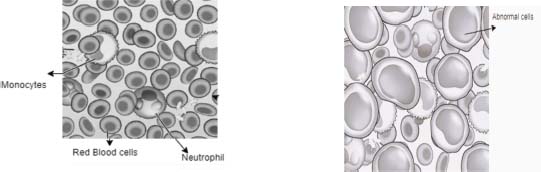
Figure 1. (A) Healthy Blood (B) Leukemia (ALL)
The French American British (FAB) system categorizes ALL into three distinct types: ALL-L1, ALL-L2, and ALL-L3 shown in Figure 2. (Ouyang et al., 2021; Moraes et al., 2019). The most common subtype of ALL diagnosed in children is ALL-L1. When observing microscopic blood smear images of L1 patients, one would typically see small and uniform cells that have a well-defined nucleus and minimal cytoplasm. The characteristics of L2 leukemia include an uneven nucleus, larger and more diverse cells, and differences in the cytoplasm. L3 leukemia exhibits unique characteristics, such as large cells with bubble-like vacuoles, round or oval nuclei, and a notable amount of cytoplasm. L2 or L3 leukemia is the most common diagnosis for ALL in adults.
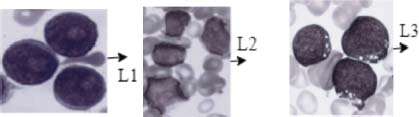
Figure 2. (A) ALL-L1 (B) ALL-L2 (C) ALL-L3
The early detection of ALL is a constant challenge for medical professionals and researchers, the World Health Organization (WHO) updated its classification of ALL in 2016 to include additional subcategories, which include Acute Pre-B-cell, Acute T-cell, and ALL with ambiguous lineage. Acute Pre-B-cell ALL is the most common subtype, accounting for 75-80% of adult ALL cases, and it occurs during the development of B-lymphocytes. B-cell ALL is rare, accounting for only 3-5% of cases, and occurs during the maturation of lymphocytes. In T-cell ALL, 20-25% of cases involve an increase in white blood cell density within the central nervous system (Wang et al., 2016). Determining whether acute ambiguous lineage originates from acute B-cells or acute T-cells can be challenging. It accounts for approximately 5-10% of ALL cases and has a poor prognosis (Wan et al., 2016). Symptoms of ALL cancer, such as gum bleeding, bone pain, fever, pale skin, tiredness, and a general decline in energy, can also be associated with other common diseases, making early detection a challenge (“Isotretinoin for Juvenile Chronic Myelogenous Leukemia,” 1995). To diagnose ALL, doctors typically use blood tests to detect any abnormal levels of platelets, white blood cells, or red blood cells in a patient’s bloodstream. However, in some cases, further examination is necessary to determine the subtype of ALL. To differentiate between B or T-cell type ALL, doctors may choose to perform a bone marrow test on their patients. Imaging tests are performed to determine whether the tumor has spread to other organs and the brain. Additionally, a spinal fluid test is conducted to identify the presence of blast cells that have entered the spinal fluid. Leukemia patients require specialized treatment, which can be more expensive and time-consuming.
Computer-aided methods using deep learning and machine learning have been developed to diagnose ALL from tiny blood smear image data. This approach saves time, reduces costs, and produces accurate results compared to manual diagnosis. These methods can assist healthcare professionals in making more informed decisions about patient treatment.
1.1. Literature Review
Aftab et al. (2021) used GoogleNet and CNN to identify leukemia from blood smear image data and achieved a good performance of 97.33% in training and 94.78% in validation. Dese et al. (2021) conducted a study in which they collected 250 blood smear images from the hematology division of Jimma University Medical Centre and the publicly available ALL_DB online database. The authors utilized the K-means-MCSVM segmentation technique and reported good performance Shafique & Tehsin deployed a deep-convolutional-neural-network (DCNN) which is already trained for the diagnosis of ALL into ALL-L1, ALL-L2, and ALL-L3 subtypes. The model achieved impressive results with 99.50% accuracy and 98.11% specificity in the detection of ALL, as well as 99.03% specificity, and 96.06% accuracy for the subtypes of ALL (Shafique et al., 2018; Tehsin et al., 2018).
Anilkumar et al. (2022) utilized a dataset from the ASH (American Society of Haematology). By using the CNN AlexNet, successfully separated B-cell and T-cell ALL images, resulting in a classification of 94.12% accuracy. The study highlights the potential of using additional leukemic image types to further improve the performance of the classification of illness. Khandekar et al. (2021) introduced leukemic cells that are predicted from tiny blood smear images by an automation technique that uses object detection. By leveraging the You Only Look Once (YOLOv4) method, the researchers were able to predict leukemic cells by achieving impressive MAP scores of 96.06% and 98.7%.
(Genovese et al. (2021a) have introduced an innovative approach to enhancing the quality of blood smear images by using an adaptive un-sharpening method through machine learning. To classify the output, the authors utilized deep convolutional neural networks trained using several popular architectures, including AlexNet, VGG16, VGG19, ResNet18, ResNet50, ResNet101, and DenseNet201. have conducted a comprehensive survey on the diagnosis of acute lymphoblastic leukemia by leveraging the power of both deep learning (DL) and machine learning (ML) feature extraction models (Das et al. 2022a). The authors explored a range of algorithms, including naive Bayesian, multi-layer perceptron, artificial neural network, fuzzy means clustering, rough-fuzzy-means, conventional CNN (convolutional neural network) & RNN (recurrent neural network). To train and test these models, the authors collected datasets from ALLIDB1 and ALLIDB2, achieving impressive results with the MobikeNetV2-ReseNet18 architecture. Notably, the authors demonstrated that an accurate diagnosis of the disease can be achieved by further classifying acute leukemia subtypes.
Rehman et al. (2018) utilized input data from the Amreek Clinical Labs in Swat KP, Pakistan’s Saidu Sharif. By leveraging the power of convolutional layers in CNN and segmentation methods, the authors were able to achieve highly accurate classification results. Das et al. (2022c) have proposed an innovative approach to extracting lymphocytes from blood smear images using a color-based k-means grouping method. To extract the characteristics of the nucleus, the authors utilized two approaches: GLCM (gray-level co-occurrence matrix) and GLRLM (gray-level run-length matrix). Additionally, the authors accomplished spatial reduction through principal component analysis (PCA). The scientists used an SVM (support vector machine) with an RBF kernel to predict WBC count.
Genovese et al. (2021b) introduced an innovative technique for lymphoblastic leukemia diagnosis using histopathological transfer learning. The model was trained on convolutional network layers by taking input as a histopathology dataset to predict types of tissues. The fine-tuned leukemia database is used to recognize the presence of lymphoblasts. By leveraging advanced machine learning techniques, the authors were able to achieve highly accurate results and demonstrate the potential for histopathological transfer learning architecture to enhance the accuracy of disease diagnosis.
Akter Hossain et al. (2020) utilized a region convolutional neural network (RPN) architecture to diagnose comparable blood objects & determine the presence of leukemia cells. The authors reported an average mean of precision values of 0.16, 0.10, and 0 for epochs 40, 60 & 120, respectively Rezayi et al. (2022) utilized deep learning networks such as ResNet-50 and VGG-16, as well as a CNN with 10-convolutional layers & two max pooling layers to distinguish malicious cells from healthy cells in microscopic pictures. After 100 training sessions, the VGG-16, ResNet-50, and CNN achieved accuracies of 81.63%, 84.62%, and 82.10%, respectively (Rezayi et al. 2021).
Sampathila et al. (2022) proposed an intelligent deep learning algorithm that utilizes blood smear microscopic images as input to distinguish between healthy blood cells and leukemic cells. The proposed algorithm employs a CNN for this task and uses the customized ALLNET model learned from open-source microscopic image data. The model was trained using Nvidia Tesla P100 GPU technology on Google Collaboratory. The results of the evaluation show that this reliable predictor achieved a high accuracy of 95.54%, a specificity of 95.71%, a sensitivity of 95.71%, an F1-score of 95.43%, and a precision of 96%, indicating its high effectiveness in leukemia detection. Chen et al. (2022) introduced an innovative method for the identification of leukemia cells using artificial intelligence (AI) technology. The authors compared the performance of traditional algorithms with convolutional neural networks (CNN) and YOLO models. The YOLOv5s model demonstrated exceptional results in object detection of acute leukemia cells with a remarkable accuracy of 97.2%.
Mustaqim et al. (2023) compared various algorithms, including YOLOv4, R-CNN, EfficientDEtD3, VGG16, ShuffleNet, ResNet50, SVM, GoogleNet, and ALLNett, for detecting acute lymphoblastic leukemia (ALL). Alam et al. (Alam & Anwar, 2021) implemented a model for ALL (acute lymphoblastic leukemia) using deep learning models. The authors utilized a pre-trained AlexNet architecture and achieved a remarkable accuracy rate of 98% without employing any picture segmentation or feature extraction techniques. Bukhari et al. (2022) proposed the idea of squeeze & excitation learning, which entails explicit modeling of channel interdependencies to enable recurrent calibration of channels-wise feature outputs. This technique was utilized to improve the performance of a deep learning architecture for leukemia diagnosis using input images and patient blood sample data. By applying squeeze & excitation learning to CNN-based, the accuracy was improved to 98.3%.
Jha et al. (2019) used a hybrid model that integrated the active contour model and fuzzy C means segmentation, then extracted features using statistical and local directional pattern (LDP). The features were transferred to chronological SCA (sine cosine algorithm) by using deep convolutional neural network (DCNN) for leukemia diagnosis using blood smear image data ALL-IDB2. The algorithm performed well and achieved a high-accuracy rate of 98.7%, demonstrating its effectiveness in identifying leukemia cells.
This comparative analysis provides an overview of existing approaches for leukemia detection in the literature Table 1. Various deep learning models, such as DCNN, GoogleNet, CNN, and YOLOv4, have been utilized to achieve high accuracy in identifying leukemia and predicting leukemic cells.
Table 1. Existing Approaches for Acute Leukemia Detection
Research paper |
Model |
Performance |
Deep Convolutional Neural Network (DCNN) |
█████████████████████ 99.50 |
|
Convolutional Neural Network (CNN) |
██████████ (Highly) |
|
Region Convolutional Neural Network (RPN) |
██████ 0.16 - 0.10 - 0 (Epochs 40, 60 & 120) |
|
GoogleNet and CNN |
██████████ 94.78 |
|
K-means-MCSVM segmentation technique |
██████ (Good) |
|
YOLOv4 |
██████████████████ 98.7 |
|
Deep Convolutional Neural Networks (various architectures) |
██████████████ (Highly) |
|
Customized ALLNET model using CNN |
██████████ 95.54 |
|
CNN AlexNet |
██████ 94.12 |
|
CNN and YOLO models |
████████ 97.2 |
|
CNN, RNN |
██████████ (Impressive) |
|
YOLOv4, R-CNN |
███████ Varies |
2. Methodology for Diagnosing ALL
The diagnosis of leukemia requires several stages, which are demonstrated in Figure 3. In this process, researchers utilize several public and private data sources. Das et al., (2021a) proposed new deep CNN frameworks utilizing the ALL-IDB 1 & ALL-IDB 2 datasets. Bibi et al., (2020) used ALL-IDB and ASH datasets to develop Residual Convolutional Neural Networks (RCNN) and DenseNet-121 (Dense Convolutional Neural Networks) for leukemia diagnosis.

Figure 3. Stages of ALL detection
ALLIDB1 and ALLIDB2, shown in Table 2, are the most popular standard datasets due to their widespread use in the research community, extensive annotation of leukemia images, and availability for public access. These datasets provide a rich and diverse collection of blood smear images, enabling researchers to develop and evaluate advanced machine-learning algorithms for acute lymphoblastic leukemia detection with a high level of accuracy and reliability.
Table 2. Acute Lymphoblastic Leukemia Datasets
Dataset |
Description |
ALL-IDB1 |
Has a total of 108 images containing multiple leukocytes. 59 of those images are healthy and 49 are ALL affected. |
ALL-IDB2 |
Has a total of 260 images containing single leukocyte. 130 of those images are healthy and 130 are ALL affected. |
C-NMC |
It consists of 15000+ cancer cell images of B-Lineage ALL along with healthy images. |
BCCD |
It consists of two sets of data. The first set contains 367 microscopic images without augmentation. The second set contains 12444 images with augmentation |
Once the data has been collected, the next crucial step is to pre-process it to enhance the quality of input data used for classification. The quality of these input images can be affected by various factors such as the light source, angle of capture, and camera used. To address this, a normalization process is used to minimize illumination and color fluctuations caused by different capture environments in various laboratories. In addition, the data undergoes further pre-processing using Laplacian of Gaussian (LoG) techniques to enhance its quality. The LoG technique involves reducing noise in the input image data with a Gaussian smoothing filter and generating the final image Laplacian. To enhance the image’s edges and details, a modified high-boosting (LoGMH) filter is applied, which combines the LoG filter with a high-boost filter (Das et al., 2022c). To achieve better accuracy, various methods such as cropping, zooming, rotating, and flipping are employed to improve the training dataset. These techniques aid in preventing overfitting and ensuring that the model can effectively classify new, unseen data.
Segmentation is a crucial step in which the preprocessed images are analyzed to identify and separate different objects or regions of interest, such as cells, tissues, or organs. Manual segmentation is a time-consuming method in which a skilled hematologist visually inspects the images and identifies the leukemic cells. Alternatively, threshold-based segmentation can be used, where a threshold value is chosen based on the intensity values of the leukemic cells to classify them from the background. Another segmentation approach is region-based, which determines areas of the image that are most likely to have leukemic cells using the texture and shape attributes of the image. Supervised segmentation involves training models such as random forest, SVM, or ANN using labeled images to identify and segment cells. On the other hand, unsupervised segmentation can be performed without the need for labeled data by dividing an image into separate areas or components. Techniques such as fuzzy C-means clustering, spectral clustering, & k-means can be utilized for the unsupervised separation of smear images.
After performing segmentation on an image or dataset, it is common to have many features that may not all be relevant for the subsequent analysis. Feature reduction means reducing the number of features from the data while retaining the most important ones for the task at hand. Either feature extraction or feature selection can be used to accomplish this. Feature selection determines the portion of the original features that are most pertinent to the study. This approach is mainly useful when dealing with data containing high dimensions and can help to decrease the overfitting problem and increase model accuracy. Feature extraction aims to identify the underlying properties or characteristics that are most crucial for classifying the data. This can be achieved through a variety of techniques, such as PCA (principal component analysis) or the discrete orthonormal S-transform (DOST) method. In the latest research by Mishra et al.,(Mishra et al., 2019) the authors utilized the DOST approach to extract features from smear images of abnormal and normal cells. They then used linear discrimination analysis to minimize feature space dimensionality and classify the cells. This approach allowed them to effectively reduce the number of features while retaining the most important ones for their analysis, ultimately improving the accuracy of their classification results.
2.1. Classification: Machine Learning
The Classification using machine learning (ML) models is a common approach to diagnosing acute lymphoblastic leukemia. Pre-processed data is sub-divided into a training dataset & a testing dataset (Bhuiyan et al., 2019). The training data is used to train the ML algorithm on the relevant features extracted from the data. Once the ML model is trained, it is used to predict or classify whether new instances of the data are ALL positive or negative (Kassani et al., 2019). Some of the most popular machine learning algorithms used to classify acute lymphoblastic leukemia are random forest (RF) & support vector machines (SVM). Many people have employed these algorithms and have demonstrated good performance in accurately identifying ALL cases (Acevedo et al., 2019; Mahmood et al., n.d.).
2.1.1 Random Forest
Random forest combines the strengths of different numbers of decision trees to create a powerful classifier. The algorithm works by building many decision trees, each decision tree is trained on a random subset of the features. To make the prediction, all previous predictions are combined through a voting process. This method helps to decrease the impact of overfitting & improves the overall model (Laosai et al., 2018). The formula for random forest is shown in equation (1)
where RF(y) is the anticipated class for the input dataset y,Tn (y) is the anticipated input by (nth) decision tree, and mode is the function that returns the most common class among the outputs of the decision trees. The likelihood of incorrectly classifying a randomly selected element in the set is quantified by the Gini Impurity. (2)
Information gain (IG) is a metric measuring the entropy reduction brought about by data division based on a characteristic. IG is shown in equation (3).
Here, IG (B,G) is the information gain of attribute G on dataset B, the total entropy for dataset B is H(B), and given attribute G, H(B|G) represents the conditional probability of dataset B.
Mirmohammadi et al., (2021) used a random forest algorithm to classify the dataset into subtypes such as L1, L2, and L3 and achieved good performance when compared with multi-layer perceptron and multi-support vector machine. Similarly, Mishra et al., (2017) utilized features of the random forest algorithm to classify the ALL-IDB leukemia dataset and achieved better accuracy, sensitivity, and specificity compared to other classification models (Mishra et al., 2017; Das et al., 2021a). These studies demonstrate the effectiveness of the random forest algorithm in accurately classifying acute lymphoblastic leukemia.
2.1.2 Support Vector Machine
SVMs are a potent class of machine learning algorithms used for regression and classification analyses. They operate by determining the ideal hyperplane that classifies the input data points of two classes in a high-dimensional space (Mishra et al., 2019). Equation (4) is based on the greatest possible margin distance and plays a crucial role in accurately classifying new instances of data as ALL positive or negative.
\Where b is just the bias term, ‘x’ represents the input dataset. The hyperplane’s direction is represented by the weight W, and its position concerning the origin is determined by the bias term b.
Equation (5) represents the distance between each class’s closest data points and the hyperplane, which is known as the greatest possible margin. This margin provides a measure of the generalization ability to the SVM model.
Support vector machines (SVM) utilize Lagrange multipliers to solve a quadratic optimization problem. The optimization problem can be expressed as in Equation (6), where R is the SVM objective function, and ‘w’ is the weight. The goal is to maximize the margin, which is achieved by minimizing the value of R.
Santhosh Krishna et al.,(Santhosh Krishna et al., 2021) used an SVM for the diagnosis of acute lymphoblast leukemia (ALL) and its types and achieved good accuracy (Das, et al., 2022a; Das et al., 2021a).
2.2. Classification: Deep Learning
Deep learning techniques have been applied to diagnose leukemia through automated analysis of medical images and blood samples. These methods can extract features and patterns from input data that may be invisible to the human eye, enabling more accurate and faster diagnoses. In addition, deep learning can handle large and complex datasets, allowing for the integration of multiple sources of data to improve diagnostic accuracy (Rehman et al., 2018).
2.2.1 Convolutional Neural Network
Convolutional neural networks, or CNNs, are a type of neural network used for image processing and classification applications. The input dataset is subjected to filters by the CNN layers in order to automatically recognise and extract features such as edges or shapes (Mahmud et al., 2018). Each filter recognizes a specific pattern or feature in the input image, producing a new output image called a feature map. It consists of several layers, as illustrated in Figure 4. The pooling layers then downsample the feature map to lessen its dimensionality. This reduces the image’s feature dimension and computational complexity, as well as suppressing overfitting problems. Average pooling is one type of pooling that calculates the average value of each window’s pixels. Another type is min pooling, which selects the minimum value in each window (Houssein et al., 2021).
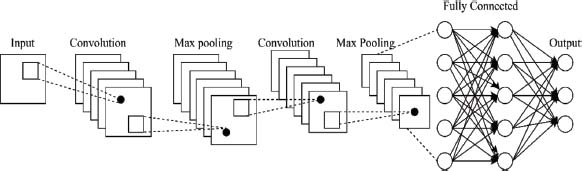
Figure 4. Convolutional Neural network (CNN)
The final categorization result is produced by the fully connected layers. They process the output of the pooling layers and apply a weighted set to it to produce the classification output. Additionally, CNNs can include activation layers, which apply a sliding window to the input dataset and calculate the mean value of each window’s pixels. This compresses the spatial dimensionality of the input dataset or feature map and adds regularization to reduce the model’s complexity. Dropout layers can also be used during training to randomly set a portion of the activations in the preceding layer to zero. This can improve the network’s generalization performance and prevent overfitting. Overall, these layers work together in a CNN architecture to learn and extract features from the input data, reduce its dimensionality, and produce a classification output.
2.2.2 AlexNet
Krizhevsky et al. (2017) popularised the transfer learning approach known as AlexNet. Eight layers make up AlexNet’s architecture, comprising three fully linked layers and five convolutional layers (see Figure 5). There are 96 filters in the primary convolutional layer and 256 filters in each of the following four. After the convolutional layers, the feature maps’ spatial dimensions are reduced by the max-pooling layers. Each of the fully connected layers contains 4096 neurons.
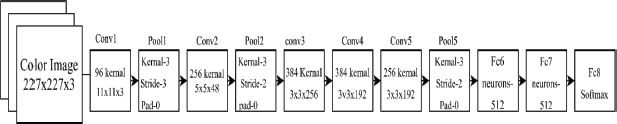
Figure 5. Basic AlexNet architecture
AlexNet also introduced a few new concepts that improved the accuracy of deep neural networks. One of them was the use of the Rectified Linear Unit (ReLU) function, which allowed for faster convergence during training. To boost the amount of training data and avoid overfitting, AlexNet additionally used data augmentation methods including random cropping and horizontal flipping. It also highlighted the effectiveness of transferred learning, as additional image recognition tasks can be trained using the pre-learned weights of AlexNet, leading to faster convergence and improved accuracy (Das et al., 2021a).
2.2.3 GoogleNet
GoogLeNet is a deep neural network that stands out for its innovative architecture and efficient design. It comprises 22 levels and employs a unique architecture known as the inception module. This module uses concurrent convolutions with different kernel sizes to collect features at various scales, reducing the computational cost while allowing the network to effectively learn various features. One of GoogLeNet’s distinctive features is Global Average Pooling, which averages the feature maps across their coordinates and helps reduce the parameter count and computational cost. To train the network, the creators used stochastic gradient descent with momentum and data augmentation techniques such as horizontal flipping and cropping (Al-Qudah et al., 2020). The impact of GoogLeNet’s work can be seen in the creation of other deep convolutional networks, such as ResNet50 and Inception-ResNet, which are influenced by their use of parallel convolutions and efficient designs for deep learning (Das et al., 2021a).
2.2.4 ResNet50
ResNet 50 is a type of deep convolutional network consisting of fifty layers, making it significantly deeper than its predecessor, ResNet 34. ResNet50 uses residual connections, which allows it to overcome the vanishing gradient problem and allows for the training of deeper networks without sacrificing accuracy. ResNet50 model includes several convolutional layers, batch normalization, and ReLU activation functions illustrated in Figure 6.
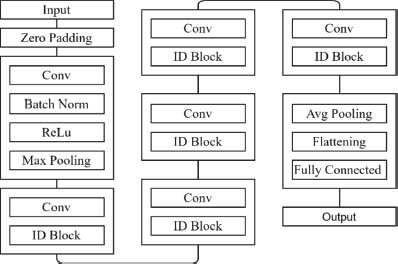
Figure 6. ResNet50 architecture
The network also uses max pooling to downsample the feature maps and fewer parameters are used in the architecture. During training, to improve the range of the training data and avoid overfitting, ResNet50 employs data augmentation techniques including cropping and horizontal flipping (Khandekar et al. 2021). The network undergoes training via a stochastic gradient descent with momentum, which helps it to converge faster and find better solutions (Das et al., 2021b; Das et al., 2021a). Its success has led to the development of even deeper networks such as ResNet101 and ResNet152, which have achieved even higher accuracy on certain tasks (Szegedy et al., n.d.).
2.2.5 ShuffleNet
ShuffleNet is a neural network architecture designed to reduce computing and memory costs while maintaining high accuracy. One of its key innovations is the use of group convolutional operations, which divide input channels into groups and perform separate convolutions for each group. This encourages cross-group information sharing and allows for more efficient processing. To further reduce computational expenses, ShuffleNet employs pointwise convolutions with 1x1 kernels, which significantly cuts down on the number of channels (Zhang et al., 2017). The network also uses the ReLU activation function and residual connections, both of which simplify training and improve accuracy. Another noteworthy feature of ShuffleNet is its use of channel shuffling, which rearranges the output channels to encourage cross-channel communication and improve performance. All these techniques work together to make ShuffleNet a highly efficient and accurate neural network architecture (Das et al., 2021b).
2.2.6 MobileNet
MobileNet is a deep convolutional network created by Wang et al. (2016) specifically for image recognition tasks. One of its most important features is its use of depth-wise separable convolutions, which enables it to achieve high performance while reducing both computational complexity and memory requirements. MobileNet’s depth-wise-convolution uses a single filter to process each input data separately, resulting in multiple sets of output channels.
These channels are then merged using point-wise convolutions that utilize 1x1 filters (Hazarika et al., 2021). Finally, two 1x1 convolutions are performed to filter and combine the output channels from the depth-wise convolution shown in Figure 7. This approach allows MobileNet to maintain its accuracy while significantly reducing its computational cost and memory requirements (Das et al., 2022a).
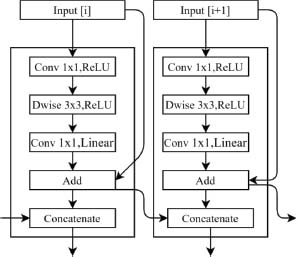
Figure 7. Basic MobileNet Model
2.2.7 Recurrent Neural Network
Recurrent neural networks (RNN) have a well-organized architecture that enables them to effectively process sequences of data and learn from their dependencies over time. As shown in Figure 8, an RNN takes a sequence of inputs, with each input being fed into the network at a specific time step. At every step, the network processes the input using a hidden state that maintains information gathered from both the previous input and the current input. This hidden state can be thought of as a form of memory that enables the network to incorporate knowledge from prior inputs into its predictions.

Figure 8. Recurrent neural network
However, when dealing with long sequences, RNNs can suffer from the problem of vanishing gradients, where the gradients used for updating the network parameters become very small, leading to poor performance. To address this problem, various types of RNN cells have been developed, such as Tanh and sigma cells. These cells are used when the input gaps are wide to learn relevant information from the data, improving the performance of the network. Long short-term memory (LSTM) is another popular type of RNN cell that is designed to handle long-term dependencies. LSTM incorporates gate functions that allow the network to selectively forget or remember information from the previous hidden state (AL-Dulaimi et al., 2021). This enables the network to maintain information over longer time periods. There are also variations of LSTM, such as integrated and gated recurrent units (GRU) which also have gate functions. The integrated LSTM cell is an extension of LSTM that allows for a better handling of gradient flow, while the gated recurrent unit (GRU) simplifies the LSTM architecture and can be more efficient in some cases (Y. Yu et al., 2019).
Shah et al. (Shah et al., 2019) proposed a deep learning architecture that combines recurrent and convolutional networks to identify immature and healthy cells. Additionally, the spectral characteristics of the cells were incorporated into the model using a discrete cosine transform. This specialized architecture has promising potential in the field of cell classification and detection (Gupta et al., 2022).
2.3. Simulation & Analysis Tool
Researchers can leverage the convenience of Google Collaboratory, a web-based platform that allows them to access Jupyter Notebooks through web browsers. This grants them access to Google’s powerful hardware and cloud computing capabilities, enhancing the efficiency of running machine learning models. The utilization of Collaboratory in the research has led to noteworthy outcomes, highlighting the platform’s effectiveness in meeting research objectives and producing significant results.
3. Empirical Results
To assesses the effectiveness and efficiency of algorithms, performance indicators are crucial. These metrics offer a means of evaluating the success of goals and objectives and pinpointing areas that need improvement, as shown in Table 1. Metrics such as FP, TP, FN, and TN assess the accuracy of diagnosis. False positives (FP) indicate the quantity of healthy cells that are wrongly classified as cancerous. True positives (TP) refer to the quantity of cancerous cells that are accurately detected. False negatives (FN), refer to the quantity of cancerous cells that are missed or wrongly identified as healthy. Finally, True Negatives (TN) refer to the quantity of healthy cells that are correctly diagnosed.
The machine learning algorithms evaluated for ALL classification using the ALL-IDB1 dataset are demonstrated in Table 2. They achieved high performance in terms of sensitivity, specificity, accuracy, and F1 score.
Deep learning and machine learning techniques have shown promising results in the detection and classification of acute lymphoblastic leukemia (ALL) shown in Table 4. Numerous studies have compared different approaches and reported high accuracy rates on various datasets. These advancements hold significant potential for improving medical diagnosis and treatment.
The different performance metrics are shown in Table 3.
Table 3. Performance metric
Metric |
Formula |
Description |
Sensitivity |
The proportion of true positives (TP) that a classification algorithm properly detected. |
|
Precision |
The proportion of accurate true positive predictions among all successful classification model predictions. |
|
Specificity |
The proportion of true negatives that a classification model properly classified. |
|
Accuracy |
The proportion of observations that a classification model accurately predicted out of all the predictions it made. |
|
F1-Score |
A useful statistic for balancing accuracy & recall in classification models is the weighted average of precision and recall. |
Table 4. Advancements in deep- and machine learning-based detection and classification of acute lymphoblastic leukemia: A Comparative Analysis
Reference |
Year |
Segmentation |
Features |
Classification |
Dataset |
Accuracy |
2017 |
Watershed |
GLCM |
RF |
ALL-IDB1 |
96.00 |
|
2017 |
Ostu’s - Thresholding |
Shape, Texture, Color |
SVM |
ALL-IDB1 |
89.80 |
|
2017 |
- |
- |
Ensemble Learning |
- |
88.50 |
|
2017 |
- |
VGGNet |
Ensemble Learning |
ALL-IDB1 |
100.00 |
|
2018 |
K means |
Texture, CD marker |
K means, SVM |
Private dataset |
99.67 |
|
2018 |
K means algorithm |
Color, Size |
Decision Tree |
ALL-IDB |
99.52 |
|
2018 |
K -means-clustering |
Statistical and geometrical |
KNN NB |
Not revealed |
92.80 |
|
2018 |
Watershed |
GLRLM |
SVM |
ALL-IDB1 |
96.90 |
|
2018 |
- |
Transfer Learning |
SVM |
Hybrid Dataset |
99.22 |
|
2018 |
Watershed |
LBP- based texture |
Ensemble |
ALL-IDB |
89.81 |
|
2019 |
K medoid |
Texture |
ANN |
ALL-IDB |
98.60 |
|
2019 |
FCM |
Statistical, LDP |
Deep CNN |
ALL-IDB |
95.10 |
|
2019 |
- |
Transfer Learning |
SVM |
ALL-IDB |
96.10 |
|
2020 |
K means |
Color, Shape |
SVM |
ALLIDB1 |
96.00 |
|
2021 |
- |
Transfer Learning |
Machine learning |
ALL-IDB2 |
96.84 |
|
2021 |
- |
- |
VGG16 |
ALL-IDB2 |
96.15 |
|
2022 |
- |
- |
SVM |
ALL-IDB |
99.39 |
|
2022 |
- |
- |
MobileNetV2+SVM |
ALL-IDB2 |
99.40 |
Table 5 shows classification performance metrics using different machine learning algorithms.
Table 5. ALL classification performance metrics for machine learning algorithms using the ALL-IDB1 dataset
Reference |
Machine learning model |
Sensitivity |
Specificity |
Accuracy |
Precision |
Support vector machine (SVM) |
92.60 |
93.06 |
96.00 |
- |
|
Random Forest (RF) |
86.50 |
99.50 |
96.00 |
99.60 |
The SVM classifier demonstrated the highest sensitivity, correctly identifying 92.60% of ALL cases, while the RF model achieved the highest specificity of 99.50%, accurately identifying healthy cases. Both algorithms demonstrated a high accuracy of 96.00%, indicating that they can be effective in accurately classifying ALL cases in the ALL-IDB1 dataset illustrated in Figure 9 (Das et al., 2022a; Mishra et al., 2017).
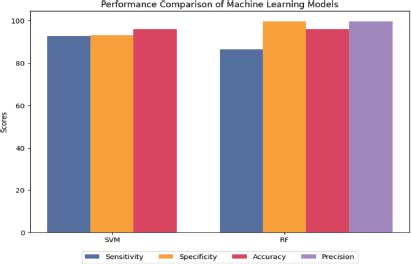
Figure 9. Machine learning performance on ALL-IDB1
MobileNet V2, which is a lightweight and efficient deep learning architecture, performed exceptionally well on the ALL-IDB1 dataset. The system achieved an F1 score of 95.00 %, 96.11% sensitivity, 97% specificity, and 95.68% accuracy, as shown in Table 6. This result indicates that MobileNet V2 is a promising algorithm for detecting ALL cases in blood cell images.
Table 6. ALL classification performance metrics for deep learning algorithms using the ALL-IDB1 dataset
Reference |
Deep Learning Architecture |
Sensitivity |
F1 Score |
Specificity |
Accuracy |
Precision |
ResNet50 |
98.00 |
94.00 |
92.7 |
95.10 |
91.97 |
|
ShuffleNet |
98.00 |
96.00 |
96.11 |
96.90 |
95.63 |
|
AlexNet |
98.64 |
93.00 |
89.35 |
93.64 |
89.55 |
|
GoogLeNet |
95.6 |
95.00 |
94.67 |
95.15 |
94.49 |
|
ResNet18 |
96.59 |
95.00 |
94.12 |
95.00 |
93.79 |
|
(Das et al., 2022) |
MobileNet V2 |
96.12 |
95.00 |
97.00 |
95.68 |
95.72 |
MobileNet V2+SVM |
100 |
99.01 |
99.00 |
99.30 |
97.33 |
|
MobileNet V2+RF |
96.19 |
96.00 |
98.00 |
96.29 |
98.57 |
In addition, machine learning (ML) classifiers such as SVM and RF applied to the MobileNet V2 architecture significantly improved the algorithm’s performance (Das et al., 2022a). The MobileNet V2+SVM acquired a 100% sensitivity, an F1 score of 99.01 & 99% specificity, and an accuracy of 99.3%, making it the best-performing algorithm in the table. Similarly, the MobileNet V2+RF obtained a sensitivity of 96.19%, an F1 score of 0.96, a specificity of 98%, and an accuracy of 96.29%. AlexNet achieved a high sensitivity of 98.64%, but a low specificity of 89.35%, resulting in a lower overall performance of 93.64%. On the other hand, ShuffleNet had the highest specificity of 96.11%, but a slightly lower sensitivity of 98%, resulting in a high accuracy of 96.9% illustrated in Figure 10 (Das et al., 2021b; Das et al.,2021a).

Figure 10. Deep learning performance on ALL-IDB1
SVM achieved perfect sensitivity (100%) with an F1 score of 95.00, while RF achieved a sensitivity of 95.65% and an F1 score of 95.10 shown in Table 7.
Table 7. ALL classification performance metrics for machine learning algorithms using the ALL-IDB2 dataset
Reference |
Machine Learning Model |
Sensitivity |
F1 Score |
Specificity |
Accuracy |
Precision |
Support vector machine (SVM) |
100.00 |
95.00 |
93.55 |
96.15 |
91.30 |
|
Random forest (RF) |
95.65 |
95.10 |
96.55 |
96.10 |
95.65 |
SVM had a specificity of 93.55% and an accuracy of 96.15%, while RF had a specificity of 96.55% and an accuracy of 96.10%, as illustrated in Figure 11. Overall, both algorithms performed well in identifying positive cases, with RF having a slightly better performance in identifying negative cases (Das et al., 2021a).
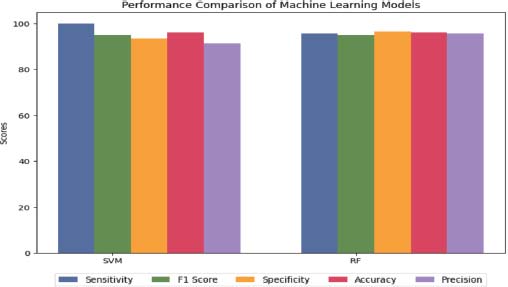
Figure 11. Machine learning performance on ALL-IDB2
The highest sensitivity and F1 score were achieved by MobileNet V2 with SVM and ShuffleNet shown in Table 8. This indicates that these models can correctly identify cancerous cells in medical images with a high level of accuracy. The highest specificity was achieved by MobileNet V2 with RF illustrated in Figure 12. This indicates that this model can correctly identify normal cells in medical images with a high level of accuracy (Das et al., 2022a).
Table 8. ALL classification performance metrics for machine learning algorithms using the ALL-IDB2 dataset
Reference |
Deep Learning Architecture |
Sensitivity |
F1 Score |
Specificity |
Accuracy |
Precision |
ResNet50 |
92.90 |
93.85 |
94.82 |
93.8 |
94.82 |
|
ShuffleNet |
96.46 |
96.7 |
96.90 |
96.67 |
96.95 |
|
AlexNet |
94.87 |
92.22 |
88.21 |
91.54 |
89.7 |
|
GoogLeNet |
96.41 |
92.1 |
86.67 |
91.54 |
88.26 |
|
ResNet18 |
93.34 |
93.58 |
93.34 |
93.34 |
93.82 |
|
MobileNet V2 |
95.95 |
92.89 |
89.10 |
92.56 |
90.02 |
|
MobileNet V2+SVM |
96.95 |
95.00 |
92.63 |
94.87 |
93.58 |
|
MobileNet V2+RF |
98.95 |
98.00 |
97.37 |
98.21 |
97.61 |
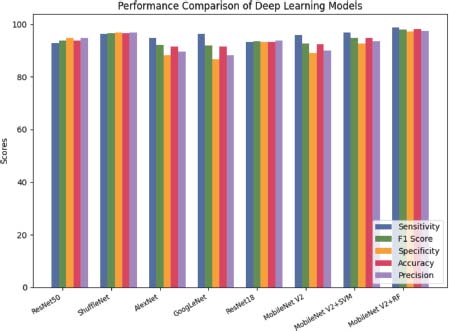
Figure 12. Deep learning performance on ALL-IDB2
4. Open Issues and Future Scope
The study of ALL categorization systems based on effective deep learning and machine learning has produced interesting findings. To increase the reliability and accuracy of ALL diagnoses, more research is still needed. Future research will cover:
• The development of more reliable methods for ALL detection and classification, creating a new hybrid dataset that incorporates images of varying illuminations, resolutions, and sizes.
• The modification of current effective models to create more powerful deep convolutional neural networks or transfer learning-based algorithms that are faster and more accurate.
• Increasing the accuracy or performance of ALL diagnoses by employing different hybrid or ensemble models.
• Separating benign from malignant cases and identifying the subtypes of a disease can improve the accuracy of diagnosis and treatment planning for healthcare professionals.
• Incorporating data from multiple ALL datasets can help reduce model bias in detecting ALL. This could result in a more precise and trustworthy diagnosis of the illness.
The ALL diagnosis holds the potential to revolutionize disease detection and treatment through innovative methods, enhanced models, and comprehensive data integration.
5. Conclusion
This research presents a comprehensive examination of the most recent advancements in acute lymphoblastic leukemia (ALL) diagnosis and classification approaches based on deep & machine learning (ML). The present review emphasizes the increasing reliability and automation of deep learning techniques, for detecting and categorizing ALL, even with limited datasets. The MobileNetV2-SVM model achieved an impressive accuracy of 99.30%, showcasing outstanding classification performance in the ALLIDB1 dataset by effectively combining the strengths of both techniques. Similarly, the MobileNetV2-RF model produced remarkable classification results with an accuracy of 98.21% in the ALLIDB2 dataset, further emphasizing the effectiveness of this approach. The research explores the potential for further advancements in the detection and classification of ALL. To address the challenge of limited datasets, future investigations could focus on developing hybrid datasets that encompass a wide range of image variations. By leveraging innovative techniques, particularly in the realm of deep learning, it is possible to enhance the accuracy and efficiency of ALL diagnoses, leading to improved healthcare outcomes and better patient care.
6. References
Acevedo, A., Alférez, S., Merino, A., Puigví, L., & Rodellar, J. (2019). Recognition of peripheral blood cell images using convolutional neural networks. Computer Methods and Programs in Biomedicine, 180, 105020. https://doi.org/10.1016/j.cmpb.2019.105020
Acharya, V., & Kumar, P. (2019). Detection of acute lymphoblastic leukemia using image segmentation and data mining algorithms. Medical & Biological Engineering & Computing, 57(8), 1783–1811. https://doi.org/10.1007/s11517-019-01984-1
Aftab, M. O., Javed Awan, M., Khalid, S., Javed, R., & Shabir, H. (2021). Executing Spark BigDL for Leukemia Detection from Microscopic Images using Transfer Learning. 2021 1st International Conference on Artificial Intelligence and Data Analytics (CAIDA), 216–220. https://doi.org/10.1109/CAIDA51941.2021.9425264
Akter Hossain, M., Islam Sabik, M., Muntasir, I., Muzahidul Islam, A. K. M., Islam, S., & Ahmed, A. (2020). Leukemia Detection Mechanism through Microscopic Image and ML Techniques. 2020 IEEE REGION 10 CONFERENCE (TENCON), 61–66. https://doi.org/10.1109/TENCON50793.2020.9293925
Alam, A., & Anwar, S. (2021). Detecting Acute Lymphoblastic Leukemia Through Microscopic Blood Images Using CNN (pp. 207–214). https://doi.org/10.1007/978-981-33-6393-9_22
AL-Dulaimi, K., Banks, J., Nugyen, K., Al-Sabaawi, A., Tomeo-Reyes, I., & Chandran, V. (2021). Segmentation of White Blood Cell, Nucleus and Cytoplasm in Digital Haematology Microscope Images: A Review–Challenges, Current and Future Potential Techniques. IEEE Reviews in Biomedical Engineering, 14, 290–306. https://doi.org/10.1109/RBME.2020.3004639
Al-Qudah, R., & Suen, C. Y. (2020). Synthetic Blood Smears Generation Using Locality Sensitive Hashing and Deep Neural Networks. IEEE Access, 8, 102530–102539. https://doi.org/10.1109/ACCESS.2020.2999349
Alsalem, M. A., Zaidan, A. A., Zaidan, B. B., Hashim, M., Madhloom, H. T., Azeez, N. D., & Alsyisuf, S. (2018). A review of the automated detection and classification of acute leukaemia: Coherent taxonomy, datasets, validation and performance measurements, motivation, open challenges and recommendations. Computer Methods and Programs in Biomedicine, 158, 93–112. https://doi.org/10.1016/j.cmpb.2018.02.005
Anilkumar, K. K., Manoj, V. J., & Sagi, T. M. (2022). Automated Detection of B Cell and T Cell Acute Lymphoblastic Leukaemia Using Deep Learning. IRBM, 43(5), 405–413. https://doi.org/10.1016/j.irbm.2021.05.005
Bhuiyan, Md. N. Q., Rahut, S. K., Tanvir, R. A., & Ripon, S. (2019). Automatic Acute Lymphoblastic Leukemia Detection and Comparative Analysis from Images. 2019 6th International Conference on Control, Decision and Information Technologies (CoDIT), 1144–1149. https://doi.org/10.1109/CoDIT.2019.8820299
Bibi, N., Sikandar, M., Ud Din, I., Almogren, A., & Ali, S. (2020). IoMT-Based Automated Detection and Classification of Leukemia Using Deep Learning. Journal of Healthcare Engineering, 2020, 1–12. https://doi.org/10.1155/2020/6648574
Bukhari, M., Yasmin, S., Sammad, S., & Abd El-Latif, A. A. (2022). A Deep Learning Framework for Leukemia Cancer Detection in Microscopic Blood Samples Using Squeeze and Excitation Learning. Mathematical Problems in Engineering, 2022, 1–18. https://doi.org/10.1155/2022/2801227
Chen, E., Liao, R., Shalaginov, M. Y., & Zeng, T. H. (2022). Real-time Detection of Acute Lymphoblastic Leukemia Cells Using Deep Learning. 2022 IEEE International Conference on Bioinformatics and Biomedicine (BIBM), 3788–3790. https://doi.org/10.1109/BIBM55620.2022.9995131
Das, P. K., & Meher, S. (2021a). An efficient deep Convolutional Neural Network based detection and classification of Acute Lymphoblastic Leukemia. Expert Systems with Applications, 183, 115311. https://doi.org/10.1016/j.eswa.2021.115311
Das, P. K., & Meher, S. (2021b). Transfer Learning-Based Automatic Detection of Acute Lymphocytic Leukemia. 2021 National Conference on Communications (NCC), 1–6. https://doi.org/10.1109/NCC52529.2021.9530010
Das, P. K., Meher, S., Panda, R., & Abraham, A. (2022a). A Systematic Review on Recent Advancements in Deep and Machine Learning Based Detection and Classification of Acute Lymphoblastic Leukemia. IEEE Access, 10, 81741–81763. https://doi.org/10.1109/ACCESS.2022.3196037
Das, P. K., Meher, S., Panda, R., & Abraham, A. (2022b). An Efficient Blood-Cell Segmentation for the Detection of Hematological Disorders. IEEE Transactions on Cybernetics, 52(10), 10615–10626. https://doi.org/10.1109/TCYB.2021.3062152
Das, P. K., Nayak, B., & Meher, S. (2022c). A lightweight deep learning system for automatic detection of blood cancer. Measurement, 191, 110762. https://doi.org/10.1016/j.measurement.2022.110762
Dese, K., Raj, H., Ayana, G., Yemane, T., Adissu, W., Krishnamoorthy, J., & Kwa, T. (2021). Accurate Machine-Learning-Based classification of Leukemia from Blood Smear Images. Clinical Lymphoma Myeloma and Leukemia, 21(11), e903–e914. https://doi.org/10.1016/j.clml.2021.06.025
Genovese, A., Hosseini, M. S., Piuri, V., Plataniotis, K. N., & Scotti, F. (2021a). Acute Lymphoblastic Leukemia Detection Based on Adaptive Unsharpening and Deep Learning. ICASSP 2021 - 2021 IEEE International Conference on Acoustics, Speech and Signal Processing (ICASSP), 1205–1209. https://doi.org/10.1109/ICASSP39728.2021.9414362
Genovese, G., Moltrasio, C., Berti, E., & Marzano, A. V. (2021b). Skin manifestations associated with COVID-19: current knowledge and future perspectives. Dermatology, 237(1), 1-12.
Genovese, A., Siegel, M., Diván, M., Piuri, V., Scotti, F., & János Viharos, Z. (2021c). Phone e-mail address TC assignments (joining year) TC mission-field of expertise (max. 1000 char. Including spaces).
Gupta, R., Gehlot, S., & Gupta, A. (2022). C-NMC: B-lineage acute lymphoblastic leukaemia: A blood cancer dataset. Medical Engineering & Physics, 103, 103793. https://doi.org/10.1016/j.medengphy.2022.103793
Hazarika, R. A., Abraham, A., Kandar, D., & Maji, A. K. (2021). An Improved LeNet-Deep Neural Network Model for Alzheimer’s Disease Classification Using Brain Magnetic Resonance Images. IEEE Access, 9, 161194–161207. https://doi.org/10.1109/ACCESS.2021.3131741
Houssein, E. H., Emam, M. M., Ali, A. A., & Suganthan, P. N. (2021). Deep and machine learning techniques for medical imaging-based breast cancer: A comprehensive review. Expert Systems with Applications, 167, 114161. https://doi.org/10.1016/j.eswa.2020.114161
Jha, K. K., & Dutta, H. S. (2019). Mutual Information based hybrid model and deep learning for Acute Lymphocytic Leukemia detection in single cell blood smear images. Computer Methods and Programs in Biomedicine, 179, 104987. https://doi.org/10.1016/j.cmpb.2019.104987
Kassani, S. H., Kassani, P. H., Wesolowski, M. J., Schneider, K. A., & Deters, R. (2019). A Hybrid Deep Learning Architecture for Leukemic B-lymphoblast Classification. 2019 International Conference on Information and Communication Technology Convergence (ICTC), 271–276. https://doi.org/10.1109/ICTC46691.2019.8939959
Khandekar, R., Shastry, P., Jaishankar, S., Faust, O., & Sampathila, N. (2021). Automated blast cell detection for Acute Lymphoblastic Leukemia diagnosis. Biomedical Signal Processing and Control, 68, 102690. https://doi.org/10.1016/j.bspc.2021.102690
Krizhevsky, A., Sutskever, I., & Hinton, G. E. (2017). ImageNet classification with deep convolutional neural networks. Communications of the ACM, 60(6), 84–90. https://doi.org/10.1145/3065386
Kumar, S., Mishra, S., Asthana, P., & Pragya. (2018). Automated Detection of Acute Leukemia Using K-mean Clustering Algorithm (pp. 655–670). https://doi.org/10.1007/978-981-10-3773-3_64
Laosai, J., & Chamnongthai, K. (2018). Classification of acute leukemia using medical-knowledge-based morphology and CD marker. Biomedical Signal Processing and Control, 44, 127–137. https://doi.org/10.1016/j.bspc.2018.01.020
Mahmood, N., Shahid, S., Bakhshi, T., Riaz, S., Ghufran, H., & Yaqoob, M. (n.d.). Identification of significant risks in pediatric acute lymphoblastic leukemia (ALL) through machine learning (ML) approach. https://doi.org/10.1007/s11517-020-02245-2/Published
Mahmud, M., Kaiser, M. S., Hussain, A., & Vassanelli, S. (2018). Applications of Deep Learning and Reinforcement Learning to Biological Data. IEEE Transactions on Neural Networks and Learning Systems, 29(6), 2063–2079. https://doi.org/10.1109/TNNLS.2018.2790388
Mirmohammadi, P., Ameri, M., & Shalbaf, A. (2021). Recognition of acute lymphoblastic leukemia and lymphocytes cell subtypes in microscopic images using random forest classifier. Physical and Engineering Sciences in Medicine, 44(2), 433–441. https://doi.org/10.1007/s13246-021-00993-5
Mishra, S., Majhi, B., & Sa, P. K. (2018). GLRLM-Based Feature Extraction for Acute Lymphoblastic Leukemia (ALL) Detection (pp. 399–407). https://doi.org/10.1007/978-981-10-8636-6_41
Mishra, S., Majhi, B., & Sa, P. K. (2019). Texture feature based classification on microscopic blood smear for acute lymphoblastic leukemia detection. Biomedical Signal Processing and Control, 47, 303–311. https://doi.org/10.1016/j.bspc.2018.08.012
Mishra, S., Majhi, B., Sa, P. K., & Sharma, L. (2017) Gray level co-occurrence matrix and random forest based acute lymphoblastic leukemia detection. Biomedical Signal Processing and Control, 33, 272–280. https://doi.org/10.1016/j.bspc.2016.11.021
Moraes, L. O., Pedreira, C. E., Barrena, S., Lopez, A., & Orfao, A. (2019). A decision-tree approach for the differential diagnosis of chronic lymphoid leukemias and peripheral B-cell lymphomas. Computer Methods and Programs in Biomedicine, 178, 85–90. https://doi.org/10.1016/j.cmpb.2019.06.014
Moshavash, Z., Danyali, H., & Helfroush, M. S. (2018). An Automatic and Robust Decision Support System for Accurate Acute Leukemia Diagnosis from Blood Microscopic Images. Journal of Digital Imaging, 31(5), 702–717. https://doi.org/10.1007/s10278-018-0074-y
Mustaqim, T., Fatichah, C., & Suciati, N. (2023). Deep Learning for the Detection of Acute Lymphoblastic Leukemia Subtypes on Microscopic Images: A Systematic Literature Review. IEEE Access, 11, 16108–16127. https://doi.org/10.1109/ACCESS.2023.3245128
Negm, A. S., Hassan, O. A., & Kandil, A. H. (2018). A decision support system for Acute Leukaemia classification based on digital microscopic images. Alexandria Engineering Journal, 57(4), 2319–2332. https://doi.org/10.1016/j.aej.2017.08.025
Ouyang, N., Wang, W., Ma, L., Wang, Y., Chen, Q., Yang, S., Xie, J., Su, S., Cheng, Y., Cheng, Q., Zheng, L., & Yuan, Y. (2021). Diagnosing acute promyelocytic leukemia by using convolutional neural network. Clinica Chimica Acta, 512, 1–6. https://doi.org/10.1016/j.cca.2020.10.039
Rawat, J., Singh, A., Bhadauria, H. S., Virmani, J., & Devgun, J. S. (2017). Classification of acute lymphoblastic leukaemia using hybrid hierarchical classifiers. Multimedia Tools and Applications, 76(18), 19057–19085. https://doi.org/10.1007/s11042-017-4478-3
Rehman, A., Abbas, N., Saba, T., Rahman, S. I. ur, Mehmood, Z., & Kolivand, H. (2018). Classification of acute lymphoblastic leukemia using deep learning. Microscopy Research and Technique, 81(11), 1310–1317. https://doi.org/10.1002/jemt.23139
Rezayi, S., Ghazisaeedi, M., Kalhori, S. R. N., & Saeedi, S. (2022). Artificial intelligence approaches on X-ray-oriented images process for early detection of COVID-19. Journal of Medical Signals & Sensors, 12(3), 233-253.
Rezayi, S., Mohammadzadeh, N., Bouraghi, H., Saeedi, S., & Mohammadpour, A. (2021). Timely Diagnosis of Acute Lymphoblastic Leukemia Using Artificial Intelligence-Oriented Deep Learning Methods. Computational Intelligence and Neuroscience, 2021, 1–12. https://doi.org/10.1155/2021/5478157
Sampathila, N., Chadaga, K., Goswami, N., Chadaga, R. P., Pandya, M., Prabhu, S., Bairy, M. G., Katta, S. S., Bhat, D., & Upadya, S. P. (2022). Customized Deep Learning Classifier for Detection of Acute Lymphoblastic Leukemia Using Blood Smear Images. Healthcare, 10(10), 1812. https://doi.org/10.3390/healthcare10101812
Santhosh Krishna, B. V., Jijin Godwin, J., Tharanee Shree, S., Sreenidhi, B., & Abinaya, T. (2021). Detection of Leukemia and Its Types Using Combination of Support Vector Machine and K-Nearest Neighbors Algorithm (pp. 435–444). https://doi.org/10.1007/978-981-16-0666-3_35
Shafique, S., & Tehsin, S. (2018). Acute lymphoblastic leukemia detection and classification of its subtypes using pretrained deep convolutional neural networks. Technology in Cancer Research and Treatment, 17, 1–7. https://doi.org/10.1177/1533033818802789
Shah, S., Nawaz, W., Jalil, B., & Khan, H. A. (2019). Classification of Normal and Leukemic Blast Cells in B-ALL Cancer Using a Combination of Convolutional and Recurrent Neural Networks (pp. 23–31). https://doi.org/10.1007/978-981-15-0798-4_3
Shahin, A. I., Guo, Y., Amin, K. M., & Sharawi, A. A. (2019). White blood cells identification system based on convolutional deep neural learning networks. Computer Methods and Programs in Biomedicine, 168, 69–80. https://doi.org/10.1016/j.cmpb.2017.11.015
Szegedy, C., Liu, W., Jia, Y., Sermanet, P., Reed, S., Anguelov, D., Erhan, D., Vanhoucke, V., & Rabinovich, A. (n.d.). Going Deeper with Convolutions.
Vogado, L. H. S., Veras, R. D. M. S., Andrade, A. R., de Araujo, F. H. D., Silva, R. R. V., & Aires, K. R. T. (2017). Diagnosing Leukemia in Blood Smear Images Using an Ensemble of Classifiers and Pre-Trained Convolutional Neural Networks. 2017 30th SIBGRAPI Conference on Graphics, Patterns and Images (SIBGRAPI), 367–373. https://doi.org/10.1109/SIBGRAPI.2017.55
Vogado, L. H. S., Veras, R. M. S., Araujo, Flavio. H. D., Silva, R. R. V., & Aires, K. R. T. (2018). Leukemia diagnosis in blood slides using transfer learning in CNNs and SVM for classification. Engineering Applications of Artificial Intelligence, 72, 415–422. https://doi.org/10.1016/j.engappai.2018.04.024
Wan, S., Lan, Y., Xu, J., Guo, J., Pang, L., & Cheng, X. (2016). Match-srnn: Modeling the recursive matching structure with spatial rnn.
Wang, S., & He, G. (2016). 2016 Revision to the WHO classification of acute lymphoblastic leukemia. Journal of Translational Internal Medicine, 4(4), 147–149. https://doi.org/10.1515/jtim-2016-0040
Yu, W., Chang, J., Yang, C., Zhang, L., Shen, H., Xia, Y., & Sha, J. (2017). Automatic classification of leukocytes using deep neural network. 2017 IEEE 12th International Conference on ASIC (ASICON), 1041–1044. https://doi.org/10.1109/ASICON.2017.8252657
Yu, Y., Si, X., Hu, C., & Zhang, J. (2019). A Review of Recurrent Neural Networks: LSTM Cells and Network Architectures. Neural Computation, 31(7), 1235–1270. https://doi.org/10.1162/neco_a_01199
Zhang, K., Zuo, W., Chen, Y., Meng, D., & Zhang, L. (2017). Beyond a Gaussian Denoiser: Residual Learning of Deep CNN for Image Denoising. IEEE Transactions on Image Processing, 26(7), 3142–3155. https://doi.org/10.1109/TIP.2017.2662206