ADCAIJ: Advances in Distributed Computing and Artificial Intelligence Journal
Regular Issue, Vol. 13 (2024), e31412
eISSN: 2255-2863
DOI: https://doi.org/10.14201/adcaij.31412
Computer-Aided Detection and Diagnosis of Breast Cancer: a Review
Bhanu Prakash Sharma and Ravindra Kumar Purwar
Guru Gobind Singh Indraprastha University, New Delhi-India
bhanu.12016492317@ipu.ac.in, ravindra@ipu.ac.in
ABSTRACT
Statistics across different countries point to breast cancer being among severe cancers with a high mortality rate. Early detection is essential when it comes to reducing the severity and mortality of breast cancer. Researchers proposed many computer-aided diagnosis/detection (CAD) techniques for this purpose. Many perform well (over 90% of classification accuracy, sensitivity, specificity, and f-1 sore), nevertheless, there is still room for improvement. This paper reviews literature related to breast cancer and the challenges faced by the research community. It discusses the common stages of breast cancer detection/ diagnosis using CAD models along with deep learning and transfer learning (TL) methods. In recent studies, deep learning models outperformed the handcrafted feature extraction and classification task and the semantic segmentation of ROI images achieved good results. An accuracy of up to 99.8% has been obtained using these techniques. Furthermore, using TL, researchers combine the power of both, pre-trained deep learning-based networks and traditional feature extraction approaches.
KEYWORDS
Cancer; Breast cancer; Mammogram; Segmentation; Classification model; Machine learning; Deep learning; Transfer learning
1. Introduction
Cancer is a life-threatening disease in which the body's cells grow out of control and become abnormal. If this growth is not properly treated it can lead to the patient's death. Each year, the American Cancer Society (ACS) publishes the annual cancer statistics for the United States. According to the (ACS, 2013-2022), breast cancer covered the maximum number of cancer cases in the last few decades compared to other categories. After lung and bronchus cancer, it has the highest mortality rate. Table 1 summarizes ACS’ cancer statistics from the last decade, comparing overall cancer and breast cancer statistics. This table points to the increasing number of cases and a growing mortality rate for breast cancer. These figures may increase drastically in the coming decades if not controlled in time.
Table 1. ACS's estimated cancer and breast cancer figure for the US for the last decade (ACS (2013-2022))
Year |
Cancer (All categories) |
Breast cancer |
Breast cancer cases in all types (%) |
Breast cancer mortality in all types (%) |
|||
Cases |
Deaths |
Cases |
Deaths |
Mortality rate (%) |
|||
2022 |
934870 |
287270 |
287850 |
43250 |
15.0 |
30.8 |
15.1 |
2021 |
927910 |
289150 |
281550 |
43600 |
15.5 |
30.3 |
15.1 |
2020 |
912930 |
285360 |
276480 |
42170 |
15.3 |
30.3 |
14.8 |
2019 |
891480 |
285210 |
268600 |
41760 |
15.5 |
30.1 |
14.6 |
2018 |
878980 |
286010 |
266120 |
40920 |
15.4 |
30.3 |
14.3 |
2017 |
852630 |
282500 |
252710 |
40610 |
16.1 |
29.6 |
14.4 |
2016 |
843820 |
281400 |
246660 |
40450 |
16.4 |
29.2 |
14.4 |
2015 |
810170 |
277280 |
231840 |
40290 |
17.4 |
28.6 |
14.5 |
2014 |
810320 |
275710 |
232670 |
40000 |
17.2 |
28.7 |
14.5 |
2013 |
805500 |
273430 |
232340 |
39620 |
17.1 |
28.8 |
14.5 |
According to Chen et al. (2017), if milk ducts are the source of breast cancer, it is known as invasive ductal carcinoma. Otherwise, milk-producing glands are the source and cause the invasive lobular carcinoma. The leading causes of breast cancer include radion's effects on the breast, age factor, family history, obesity, gene changes, race, etc. To reduce the severity of breast cancer and improve the survival rate, its detection in the early stage is essential (ACS, 2013-2022). Random breast cancer screening conducted earlier reduced the mortality rate, but no reduction has been observed in the incident count.
Dibden et al. (2020) suggested that regular (repeated every 2-3 years) breast screening reduces the mortality by 40%. The ACS of the US and cancer-controlling agencies of many countries suggest regular/routine breast screening at an older age. There are a number of breast cancer screening methods, such as mammography, magnetic resonance imaging (MRI), computed tomography (CT) scan, biopsy, thermography, breast ultrasound, electrical impedance tomography (EIT), and digital breast tomosynthesis (DBT).
Mammography is economical, painless, and reveals breast abnormalities before their symptoms and is the preferred technique for early-stage breast cancer detection (Misra et al., 2010; Welch et al., 2016). It is an X-ray-based imaging technique used to generate the breast's greyscale images of high resolution. It represents the breast's internal view and diagnoses the abnormalities in overlapping tissues. According to Andersson et al. (1978) and Sickles et al. (1986), two types of mammography projections, named mediolateral oblique (MLO) and bilateral craniocaudal (CC), are used by radiologists and CAD-based systems on a primary basis. When a mammogram image is captured horizontally (C-arm 0° angle) from an upper projection, it generates a CC view image. It reveals information about glandular and nearby fatty tissues. An MLO view image is captured from the C-arm 45° angle side. The breast is placed diagonally between X-ray plates, covering a larger breast area than other angular views. The pectoral muscle becomes visible in this view. Figure 1 represents the left and right CC and MLO view mammogram images from the CBIS-DDSM dataset (Rebecca et al., 2016).

Figure 1. Mammogram MLO and CC view examples. Figures (a) and (b) represent the left and right CC views, whereas (c) and (d) represent the left and right MLO views of the mammogram image
Breast calcifications are categorized into macro and microcalcifications. Macrocalcifications spread randomly, are visible as large white-colored dots, and are generally non-cancerous. In comparison, micro-calcifications look like calcium spots in the form of white specks. According to Nalawade (2009), these specks represent the presence of precancerous cells and are also used to indicate cancer in its early stage.
Regular breast screening burdens radiologists and its automation is necessary. Several researchers proposed mammogram image-based CAD systems for automatic breast cancer detection. These systems detect the presence of a mass in the mammogram images, provide their localization information and classify them into cancerous (malignant), non-cancerous (benign), and normal categories. These systems strengthen radiologists' decisions and prioritize mammogram images (Baker et al., 2003); thus, radiologists can manually analyze mammograms showing severe cases.
The common challenges faced by researchers during the development of such CAD models for breast cancer detection are:
• To get the breast’s internal view, selection of breast screening modalities. For performance evaluation and comparison, the choice of appropriate benchmark datasets.
• Selection of preprocessing techniques for removing noise/markers/labels and enhancing screened images.
• Selection of the appropriate approach to segment ROI.
• If the referenced dataset suffers from data underfitting/overfitting or a data imbalance problem, then the selection of appropriate augmentation and dataset selection techniques is necessary.
• The selection of feature extraction and classification techniques from the available traditional, deep learning, and transfer learning-based models.
This paper discusses various solutions preferred by research communities to overcome these challenges. Section 2 of this paper discusses the stages of CAD models for breast cancer detection. Subsection 2.1 discusses the process of image acquisition and commonly used mammogram datasets, followed by preprocessing techniques in Subsection 2.2. ROI segmentation techniques are discussed in Subsection 2.3. Solutions to data underfitting/overfitting or data imbalance problems are given in Subsection 2.4. Subsections 2.5 and 2.6 discuss the feature extraction and classification process in which traditional feature extraction, classification, deep neural network, and transfer learning techniques are discussed. At last, Section 3 explains the parameters frequently used by researchers for performance evaluation and comparison, followed by the conclusion in Section 4.
2. Stages of CAD Models
Researchers have proposed several CAD models for breast cancer detection. Most of these models have common challenges, as discussed in the introduction section earlier. Figure 2 represents the stages of these CAD systems. Preprocessing and segmentation stages are common in most of these CAD systems. Traditional classification models have separate feature extraction and classification stages, whereas deep neural network (deep learning) based models integrate these stages in one unit. These models work on different hidden layers for feature extraction and classification. The CAD model stages are discussed in the subsequent sections.
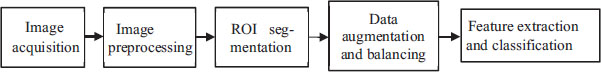
Figure 2. Stages of a CAD-based breast cancer detection system
2.1. Image Acquisition
This stage refers to procuring an image that shows the breast's internal view. These are also known as breast screening images. Mammography is the preferred screening technique because of its non-invasive, economical, and more time-efficient nature. It has the capability to detect breast abnormalities before their symptoms. The mammogram image datasets used by various researchers as benchmark datasets for the performance comparison of CAD-based breast cancer detection systems are discussed as follows:
Mini-Mammographic Image Analysis Society (MIAS)
According to Suckling (1994), Mini-Mammographic Image Analysis Society (MIAS) has a total of 322 greyscale mammogram images of a resolution of 1024×1024 pixels. Seven fields describe its images and their characteristics, i.e., image reference number, background tissue characteristics, presence of an abnormality, severity, coordinate, and radius of the center of mass of breast abnormalities.
In the literature, this dataset has been used for texture and deep learning-based feature extraction in the experimental setup (Sharma and Purwar, 2020; Sharma and Purwar, 2022). The authors’ achieved good classification performance on it. Recently, a series of studies used a mini-MIAS dataset for performance evaluation on various deep learning models (Patel and Hadia, 2023; Ranjbarzadeh et al., 2022; Kumar et al., 2022; Rmili et al., 2022; Kulkarni and Rabidas, 2023). Furthermore, Sharma and Purwar (2023) augmented the ROI images extracted from this dataset and achieved an average enhancement of more than 8% of classification accuracy when evaluated over 24 classifiers.
INbreast
The INbreast dataset suggested by (Moreira et al. 2012) consists of 410 DICOM format mammogram images from 115 cases, covering MLO and bilateral CC views.
In the literature, a series of studies used this dataset to evaluate the performance of ROI segmentation and feature extraction techniques (Taghanaki et al., 2017; Baccouche et al., 2021; Li et al., 2021; Zhang et al., 2020; Alkhaleefah et al., 2022).
Digital Database for Screening Mammography (DDSM)
The Digital Database for Screening Mammography (DDSM) comprises 2620 JPEG format mammogram images (Heath et al., 1998; Michael et al., 2001). Its images cover both MLO and CC view projections for each breast. Its pixel-level annotations for suspected regions provide information at a deep level. It also includes identification information (capturing date, patient's age, BI-RADS score, etc.).
Zemmal et al. (2019) extracted GLCM and LBP features from this dataset and achieved an accuracy of 96.09% on transductive SVM. Sharma et al. (2019) used it as a reference dataset in the proposed clustering-based segmentation technique based on deformable image registration. Shamim (2022) tested the performance of the ROI segmentation technique based on the semantic deep learning-based Unet model. In addition, a series of proposals used this dataset for feature extraction and classification (Zemmal et al., 2019; Cheng et al., 2020; Li et al., 2021; Zebari et al., 2021).
Curated Breast Imaging Subset of DDSM (CBIS-DDSM)
Rebecca et al. (2016) suggested an advanced and processed DDSM dataset. It consists of 10239 DICOM format mammogram images by masking 6775 cases. After decompressing the images, trained mammographers segmented their masses and identified the bounding box covering the ROI. Four CSV files provide pathological information about different tumors; mass training and testing sets provide information about 1318 and 378 tumor images, respectively. The calcification training and testing set consists of details for 1622 and 326 calcifications, respectively.
Hamad et al. (2022) evaluated their proposed fuzzy clustering means and threshold (FCMT) based segmentation technique on this dataset. Rajalakshmi et al. (2020) and Baccouche et al. (2021) used this dataset for Unet-based semantic segmentation. Whereas Alkhaleefah et al. (2022) used it for SegNet-based segmentation. Furthermore, a number of authors used this dataset to test the performance of their proposed models (Zhang et al., 2020; Petrini et al., 2022; Azour et al., 2023).
Breast Cancer Digital Repository (BCDR)
The BCDR dataset given by Lopez et al. (2012) consists of mammography and ultrasound images of 1734 patients along with their clinical history, image descriptors, and segmented lesions. These images are adequately annotated and BIRAD classified.
In recent research, various researchers used this dataset to evaluate the performance of several deep learning models (Tiryaki, 2023; Ganesh and Rao, 2023; Asadi and Memon, 2023; Bobeda et al., 2023).
These datasets categorize the mammogram images into benign (the lesion is identified but likely to be non-cancerous), malignant (the identified lesion is cancerous), and normal (no lesion identified in the breast) categories. Table 2 summarizes these datasets.
Table 2. Summary of various mammogram image datasets
Mammogram Dataset |
Number of images |
Images' format |
Resolution (bits/pixels) |
Mini-MIAS (Suckling, 1994) |
322 |
PGM |
8 |
INbreast (Moreira et al., 2012) |
410 |
DICOM |
14 |
DDSM ((Heath et al., 1998), (Michael et al., 2001)) |
10480 |
LJPEG |
8 to 16 |
CBIS-DDSM (Rebecca et al., 2016) |
10239 |
DICOM |
10 |
BCDR (Lopez et al., 2012) |
7315 |
TIFF |
8 to 14 |
2.2. Preprocessing
The screening images used for breast cancer detection contain noise and additional information (Ramani et al., 2013). Heat, electricity, and sensor illumination levels are the main causes of noise. The artifacts and markers are added for identification during capturing, as required during manual analysis. These images may also consist of background and pectoral muscle, whose presence impacts the tumor's detection, so they are treated as noise. Different types of noise can be reduced using conventional filters. A non-linear adaptive median filter may be preferable for the removal of salt and pepper noise while maintaining the edges' information (Shahrokhy, 2004). An adaptive mean filter can reduce the image's opacity, gaussian, speckle, and Poisson noises (Shahrokhy et al., 2004). During the fine-tuning of screened images, the intensity of lower contrast pixels can be enlarged using the CLAHE technique (Zuiderveld et al., 1994). Based on peak detection, a linear low-pass Gaussian filter can reduce the blurriness of edge pixels. A window-based, non-linear hybrid median filter can be used in horizontal, vertical, and diagonal directions to remove impulsive noise while retaining the edges. A wiener filter can minimize the mean square error during the inverse filtering and noise smoothing while retaining the image's sharpness (King et al., 1983).
In addition to the conventional filters discussed above, researchers proposed many preprocessing techniques. Rahmati et al. (2010) merged both CLAHE and fuzzy logic to preprocess the images. It enhanced the performance of the existing CLAHE technique by performing non-linear enhancement to reduce intensity inhomogeneities and noise. When this filter was applied to 50 mammographic images, the authors obtained an average improvement of 14.16% in segmentation accuracy. Based on histogram equalization and contrast enhancement, Gupta and Tiwari (2017) proposed the histogram modified grey relational analysis (HMGRA) technique for mammogram contrast enhancement. The authors used this technique to increase local as well as global contrast enhancement. The performance was evaluated in the structural similarity index measure and peak-signal-to-noise ratio (P-SNR) error metrics. More than 90% of accuracy was achieved for mammograms of the MIAS dataset. Dhamodharan and Pichari (2021) proposed the BPFO-CI technique to overcome the noise amplification, background over transformation, and detail preservation challenges during contrast enhancement. In this technique, the authors used weighted cumulative distribution function (WCF) in which a threshold value controls the background over transformation.
Furthermore, the foreground grey levels are divided into two regions based on mean and median values, using the local intensity adjustment factor, and their weights are computed as WCF. The mammograms' original intensities are mapped to these computed values. A significant performance enhancement is observed for the MIAS dataset.
2.3. Segmentation
After the preprocessing of the screened image, the next task was the identification of its objects and their categorization into ROI and the background. Segmentation means keeping the ROI for further processing and discarding the background region. Segmentation techniques are broadly based on thresholding, region-based, boundary-based, template matching, and deep learning.
Thresholding is a simple, computationally inexpensive, easy to implement, and the most frequently used segmentation technique. Compared to the threshold value, high-intensity pixels are considered part of the foreground region, whereas other pixels are considered background and discarded from further processing. Thresholding is divided into global and local categories. Commonly used thresholding techniques include the minimum error, maximum entropy, and Otsu's thresholding method. In boundary-based segmentation, high pass or gradient (such as the Sobel filter, canny edge detector, and Prewitt and Robert operators) filters are used for edge extraction. Based on these edges, the boundary of ROI is identified. In region-based segmentation, pixels are assigned regions based on their similarity (similar texture, color, and grey level). It is further divided into two categories: the region-growing technique and the splitting and merging technique. In template matching, objects from the images are extracted based on the provided object's templates. According to Talmi et al. (2017), the technique faces challenges when there are changes in scale, background clutter, background illumination, in the presence of occlusion, and in the detection of non-rigid transformations.
Based on these approaches, several segmentation techniques have been proposed by researchers. Byung and Bong (2010) proposed an isocontour map to delineate the boundaries of pectoral muscle, breast, and mass (dense regions) using the topographic and geometric structure representation. These structures are analyzed using an inclusion tree, and any region's saliency was measured based on its minimal value (nesting depth). Further, different scaled features are analyzed using multiscale isocontour maps. The 400 mammogram images from the database of Heath et al. (1998) achieved 90% and 100% detection rates for 2.3 and 3.8 false-positive rates, respectively. Aghdam et al. (2014) proposed the probabilistic adaptive thresholding technique based on the image's texture. It is suitable to remove the issues that occur due to non-uniform background intensities.
To overcome the limitations of segmentation (variation in the breast region, image quality, and need for a large number of dataset images), Sharma et al. (2019) combined deformable image registration with clustering to capture the variations and identify the atlas images. Similar mammograms are segmented using their atlas images and deformable image registration. The performance of the proposal was compared based on the Jaccard index and Hausdorff distance with three advanced segmentation techniques for mini MIAS and DDSM datasets and was found to perform better for 79.50% and 74.22% of images. Taghanaki et al. (2017) proposed a BI-RADS tissue density-based technique to segment the pectoral muscle from mammograms. The region-growing algorithm merged with geometric rules to identify the pectoral muscle (concave, convex, normal and combinatorial). The performance was tested on 872 mammogram images from MIAS, INbreast, and DDSM dataset images, where the authors achieved an acceptable segmentation rate of ~95%, as well as 0.972±0.003 and 0.985±0.001 were the computed Jaccard index and Dice similarity coefficients.
A segmentation technique was proposed based on the modified transition rule (maximum updating of the cell strength) (Anitha and Peter, 2015). The initial level ROI segmentation was done using histogram peak analysis. The average of the computed GLCM was used for the identification of the initial seed point. Further, the seed point, cellular automata, and modified transition rule were used to perform segmentation. 93.48% and 92.25% were the achieved segmentation accuracy and sensitivity percentages for 70 images from the mini-MIAS dataset. Hamad et al. (2022)proposed fuzzy clustering-means and threshold (FCMT) segmentation approach in which fuzzy clustering technique is combined with the thresholding. It can accurately segment the mammogram’s non-infected (normal) and breast tumor regions without needing any prior boundary detection training. An intersection over union (IOU) of 97.34 and an f1-score of 95.39 were achieved for the CBIS-DDSM dataset. Using C-means clustering the ROIs were detected and divided into patches of positive and negative categories (Shamim, 2022). The positive patches trained the U-net segmentation network. The DDSM dataset achieved 98.5%, 97.8%, 97.4%, and 98.2% of f-measure, dice score, Jaccard index, and accuracy, respectively.
To overcome the mass segmentation problems related to low SNR, and more false positives, Rajalakshmi et al. (2020) proposed a mass segmentation technique. The authors merged both the encoder-decoder (U-Net) model and dense conditional random fields (CRFs), such that the encoder captured the region's textual information and the decoder found the spatial location of ROIs. The dense CRF fine-tuned the segmentation process for the identification of edges. For CBIS-DDSM and INbreast datasets, a dice score was achieved of 82.9% and 79%, respectively. Baccouche et al. (2021) proposed a connected-Unet architecture for mammogram mass segmentation. It connected two Unets through enhanced skip connections and integrated them with ASPP (atrous spatial pyramid pooling) to identify the contextual information in encoder-decoder network architecture. It achieved dice scores of 89.52% and 95.28% and intersection over union (IoU) scores of 80.02% and 91.03% on CBIS-DDSM and INbreast datasets, respectively. Inspired by Unets, Alkhaleefah et al. (2022) proposed a segmentation technique called Connected SegNets. In it, two SegNets connected through skip connections, and IoU replaced their cross-entropy loss functions. CLAHE was used for the region's enhancement, followed by its augmentation using the flip and rotation geometric transformations. It achieved dice scores of 92.86% and 96.34% and IoU (intersection over Union) scores of 91.21% and 87.34% on the CBIS-DDSM and INbreast datasets, respectively. Several authors suggested different state-of-the-art ROI segmentation techniques for breast cancer detection (Vidal et al., 2022; Cho and Yoon, 2021; Ravikumar et al., 2023; Alam et al., 2023).
2.4. Data Augmentation and Balancing
It is an optional stage preferred by many researchers in recent studies. Multi-class datasets may have data in an inadequate (lower) amount or an imbalanced form. Using such datasets to evaluate the performance of classifiers may generate unreliable results, as they may be inaccurate.
Data augmentation and balancing techniques are used to overcome these problems. In the augmentation process, additional transformed copies of screened images or their ROIs are generated to increase the dataset images. It is preferable for low-volume datasets to have a lower number of images. A large number of techniques are used for image augmentation, such as position augmentation and color augmentation, which include rotation, shifting, blurring, flipping, sharpening, random cropping/erasing, mixing images, padding, affine transformation, color manipulation, changes in scale/brightness/contrast/hue and addition of noise to the image, etc. In addition, to correctly evaluate the performance of classification models on multi-class datasets, the same volume of data is provided from each class to balance the data.
According to Taylor and Nitschke (2018), image augmentation is necessary for the performance enhancement of deep learning networks on small or imbalanced datasets. The authors proposed the random erasing augmentation technique (Zhong et al., 2020). They selected a rectangular region from the image and replaced it with random values. In the study of Ghiasi (2021), copy-paste augmentation techniques outperformed the segmentation process, and the rare objects were efficiently handled using them. To deal with imbalanced datasets, a novel augmentation tool called imbalanced data augmentation generative adversarial networks (IDA-GAN) was proposed (Yang and Zhou, 2021). In it, the variational autoencoder specifies the distribution of minority and majority classes, followed by using this distribution and generative model for the GAN training. Raj et al. (2022) proposed an augmentation technique (non-linear) based on crossover. It is a non-label preserving technique that uses a two-point crossover approach to synthesize the input images and generate augmented images equal to the number of input images. For mini-MIAS dataset images, a 1.47% increase in classification accuracy was achieved on the VGG-16 model. Sharma and Purwar (2023) proposed a dataset from the extracted ROI images of the mini MIAS dataset's mammogram images. An additional 71 augmented images were generated using flip and rotation augmentation techniques to form a 23256 ROI dataset for each ROI image. Its performance has been evaluated for 24 classification models on five feature vectors and a classification accuracy enhancement of 2.8% to 22.16% was observed.
2.5. Feature extraction
Image features represent the image's content/information, for example, the presence of any structure (object, point, edge, etc.) in it. These features also represent the image's visual information in vector space and make it possible to apply mathematical operations to them, such as the identification of similar feature vectors to find similar images or objects. Image feature extraction techniques are broadly divided into white and black box categories. One or more predefined algorithms can be used for feature extraction in the first category. These are easy to understand, such as image histogram, local binary pattern (LBP), scale-invariant feature transform (SIFT), speeded-up robust features (SURF), binary robust independent elementary features (BRIEF), features from accelerated segment test (FAST) and oriented fast and rotated brief (ORB). All extracted features or their selected/computed subset can be taken as a feature vector (FV). Similar to the model's local properties and logic, the black box methods are not explainable and require additional understanding capabilities. This approach is used in CNN and deep learning models.
Sharma and Purwar (2021) used a combination of a subset of texture features (GLCM and uniform LBP) and smart features extracted from one of the pre-trained deep neural networks (modified Alexnet). To reduce the feature vector size, homogeneity, entropy, contrast, and correlation, the values of GLCM are chosen in feature vector creation, and transfer learning is used to extract the smart features. When evaluated on seven classifiers, the highest classification accuracy of 98.8% was achieved over the ensemble boosted tree classifier, for which 100% and 92.55% are the sensitivity and specificity, respectively.
Zemmal et al. (2019) used a combination of GLCM and LBP features and extracted their mutual information and correlation for feature vector generation. The authors used a Transductive SVM classifier to evaluate the performance of the computed FV and achieved an accuracy of 96.09% on the DDSM dataset. In another work, Sharma and Purwar (2023) used features extracted from HOG, ULBP, intensity histogram (hist), ULBP+HOG, and hist+ULBP+HOG as FV and achieved significant classification performance over 24 classifiers. In a series of studies, the smart features were extracted from a pre-trained deep learning model and combined with ELM, IoT and ensemble techniques and achieved good classification performance (Chakravarthy et al., 2023; Pati et al., 2023; Oza et al., 2023).
2.6. Classification Techniques
These are the machine learning approaches that classify the input-screened image either into cancerous or non-cancerous categories. These models are initially trained using training data, and on the basis of their learning, they classify validation data. Classification techniques are categorized into supervised and unsupervised machine learning (ML) techniques. During performance evaluation, if the input data class is known/labeled, the technique is known as supervised learning, otherwise it is unsupervised. The ML techniques are further categorized into traditional ML and deep neural network based (DNN) techniques based on how the features are extracted and classified. The DNN models have integrated feature extraction and classification stages, whereas these are non-integrated in traditional models. In recent approaches, researchers adopted transfer learning (TL) to incorporate the benefits of both ML techniques. In TL, features are extracted from the intermediate hidden layers of selected pre-trained DNN models (such as Alexnet) and evaluated on other classification models.
According to Li et al. (1984), the decisions in decision tree-based classification are based on the tree structure created for different feature values during the training process. The parent nodes sub-branch is selected on the basis of the matching value of the feature's vector. The process continues until the leaf node (which represents the class) is reached. Based on the flexibility of possible splits, this technique is divided into fine, medium, and coarse trees supporting 100, 20, and 4 approximate splits, respectively. The linear and quadratic discriminant analysis (LDA & QDA) classification techniques can easily compute closed-form solutions in less time, and there is no additional requirement for hyperparameter tuning (Guo et al., 2007; Seber, 2009). The learning process of LDA is limited to linear boundaries only, whereas QDA, being flexible, can also learn quadratic boundaries. Support vector machine (SVM) is based on supervised learning which creates decision boundaries (hyperplane) for the input FV's data, in which classification is done based on the nearest hyperparameter. Broadly, the SVM is classified into linear and non-linear categories. It has been shown that, for different kernel functions and scales, SVM can be further divided into linear, quadratic, fine gaussian, medium gaussian, and coarse gaussian SVM (Christianini and Taylor, 2000; Hastie et al., 2009). Ensemble-based classifiers are complex but provide enhanced performance by combining the results of multiple models (Freund and Schapire, 1997; Schapire et al., 1998; Breiman, 1996; Breiman, 2001). Bagging-based classifiers are based on bootstrap aggregation to reduce the decision tree's variance. In extension to bagging, in a random forest, random attributes are selected at each decision tree node to determine the split.
As suggested by Kaiming et al. (2015), based on the neural network's (NN) input layer size, i.e., 10,25,100, these classifiers are categorized as narrow, medium, and wide NN. Based on the number of fully connected layers, these are categorized as bilayered and trilayered NN classifiers. K-nearest neighbor-based classifiers suggested by Friedman et al. (1977) follows supervised learning and assigns each data point to a similar class (available K classes). Based on the number of neighbors, i.e., 1, 10,100, these are classified into fine, medium, and coarse KNN, whereas, based on distance metric, i.e., cosine and Euclidean, these are classified as cosine and weighted KNN. DNN-based models can automatically extract informative and powerful features from input images. Different pre-trained networks are formed for the different values of the dimension, accuracy, speed, and size of input images.
Petrini et al. (2022) proposed a two-view classifier created using three-level transfer learning. Rotation, zoom, shear, intensity, and horizontal/vertical shift techniques were used to augment the data. The weights of EfficientNet were used to train the patch classifier, whose weights were used to train a single-view classifier, whose weights were further used to train the two-view classifier. Using a 5-fold cross-validation on the CBIS-DDSM dataset, an AUC of 0.93 was achieved. Cheng et al. (2020) proposed spatial enhanced rotation aware network (SERAN) classification model. They used mirroring and rotation to augment the dataset, followed by adopting a residual encoder and decoder for feature extraction, feature fusion, and prediction refinement. To improve the network's training process, the authors adopted inside-outside loss regulation. On the DDSM dataset, it achieved an accuracy of 99.84%, a sensitivity of 87.70%, and a specificity of 99.90%. Azour et al. (2023) integrated the EfficientNet model with other pre-trained models using hard and soft voting of ensemble learning. The proposed ensemble-based learning classifier on the CBIS-DDSM dataset using the 10-fold cross-validation approach achieved an accuracy of 96.05%. Sharma and Purwar (2020) differentiated the pixels of interest from the background using two different thresholding techniques (extended otsu and adaptive threshold computed using histogram peak analysis), which were applied in parallel to preprocessed mammogram images from the mini-MIAS dataset. Their combined resulting images achieved an accuracy of 93.45% on the Alexnet model.
To optimize the classifier's penalty and kernel parameters, Mohanty et al. (2020) proposed an optimized kernel extreme learning machine (KELM) classifier using a weighted chaotic scalp swarm algorithm (WC-SSA). Further, quality features were extracted by merging Shannon's, Tsallis's, and Renyi's entropies with the energy computed using block-based discrete wavelet packet transform (BDWPT). Accuracies of 99.28%, 99.63%, and 99.60% were achieved for MIAS, DDSM, and BCDR datasets, respectively. In the study of Uthoff and Sieren (2018), k-medoids clustering has been used to remove highly intra-correlated features. The combination of gray-level run length (GLRL), grey-level size zone (GLSZ), law's texture energy measures (LTEM), and neighborhood gray-tone difference (NGTD) features extracted from the DDSM dataset using ANN with the ten hidden layers classifier achieved 96.2%, 97.6% and 95.2% of accuracy, sensitivity and specificity, respectively. To improve the accuracy of the SVM classifier for the mammogram images (Loizidou et al., 2020), the temporal subtraction of mammograms has been done post-registration of preprocessed mammograms. For computed shape, intensity-based, FOS, and GLCM features, a 99.5% accuracy was achieved for 80 Dicom images from Cyprus Hospital. MIAS mammogram images were enhanced using full-scale histogram stretching (FSHS), histogram equalization, morphological enhancement, and wavelet transform (Mabrouk et al., 2019). An accuracy of 97% was achieved for the ANN classifier. A multi-feature fusions-based approach has been proposed by Zhang et al. (2020) in which cross-modal pathological semantics among features were used for early fusion. Dynamic weights for features were used for mid-level feature fusion, followed by two voting-based ensemble learning used for late feature fusion. The features computed using LBP, HOG, SIFT, residual network (ResNet), visual geometry group (VGG), and densely connected convolutional networks (DenseNet) achieved a classification accuracy of 90.91% and 87.93% for CBIS-DDSM and INbreast dataset, respectively. Li et al. (2019) used an updated inception structure to replace DenseNet-II neural network's first convolution layer. An accuracy of 94.55% has been achieved on preprocessed and normalized mammogram images.
Li et al. (2021) proposed a DUAL CORENET classification model using two learners. One of these is a locality-preserving learner, focusing on the hierarchical extraction of intrinsic features. In contrast, the other is a conditional graph learner, which generates the geometrical features by pixel-wise modeling (mask correlation). An AUC of 0.85 and 0.93 was achieved for DDSM and INbreast datasets, respectively. Zebari et al. (2021) used an artificial neural networks (ANN) based classifier to classify the computed multi-fractal dimension (M-FD) features. Hybrid, shrink, and soft thresholds were applied to compute the ROI and noise suppression. Good performance was achieved for Mini-MIAS, DDSM, and BCDR datasets. In another approach, Sharma and Purwar (2022), used TL, DCNN computed features were merged with texture features (LBP, GLCM). On the mini-MIAS dataset, the ensemble boosted tree classifier achieved classification accuracy, sensitivity, and specificity of 98.8%, 100%, and 92.55%, respectively.
3. Performance Evaluation Parameters
Any classification model's performance evaluation and comparison is based on universal formulas/matrices. Many such parameters exist, but classification accuracy, specificity, sensitivity/ recall, precision, and F-1 score are commonly used. Some of the existing CAD models of breast cancer detection classify the screening images into two classes, i.e., benign/non-cancerous and malignant/cancerous, whereas others classify them into three classes, including the normal class and two existing classes. So generalized formulas related to their computations are given in this section. In their representation, TP, TN, FP, and FN represent the count of true positive, true negative, false positive, and false negative, respectively.
Accuracy
The ratio of the count of correct predictions to all possible predictions. Accuracy is given as:
Sensitivity/ Recall
It is computed separately for each class by taking the ratio of the count of true predictions made as that class to the actual number of cases of that class. It can be generalized as the ratio of true positives and all actual positives, as given below:
Precision
It is the ratio of the number of true predictions made as that class to the total number of predictions made as that class. It can be generalized as the ratio of true positives and predicted positives, as given below:
Specificity
It is the ratio of the number of true predictions which do not belong to the corresponding class to the sum of other classes' true predictions and false predictions as that class. It can be generalized as the ratio of true negatives and all actual negatives, as given below:
F-1 score
Also known as the harmonic mean of sensitivity and precision of the corresponding class. It can be computed as:
Area Under the Curve (AUC):
AUC represents any classifier's ability to assign the classes to input feature vectors. The larger the value of AUC, the better the classification performance is. Its range is between 0 and 1, where 0 represents all classifications as incorrect, and 1 illustrates all correct classifications.
Based on performance evaluation parameters discussed in this section, the performance of various state-of-the-art classification techniques shown in the previous section (classification techniques) is summarized in Table 3 below:
Table 3. Summarized performance of various classification models
Technique's reference |
Dataset |
Features |
Classification Model |
Performance |
CBIS-DDSM |
|
Two-view classifier created using three-level transfer learning. |
AUC-0.93 |
|
DDSM |
|
Proposed SERAN model. |
Accuracy- 99.84% Sensitivity- 87.70% Specificity- 99.90% |
|
CBIS-DDSM |
|
Ensemble learning. |
Accuracy- 96.05% |
|
Mini-MIAS |
|
Alexnet |
Accuracy- 93.45% |
|
DDSM, INbreast |
|
Proposed model-DUALCORENET. |
AUC (DDSM- 0.85, INbreast- 0.93) |
|
Mini-MIAS, DDSM, BCDR |
Multi-fractal dimension (M-FD). |
ANN |
Mini-MIAS (Accuracy- 96.2%, sensitivity- 96.63%, specificity- 95.37%), DDSM (Accuracy- 98.57%, Sensitivity-98.33%, Specificity- 98.8%), BCDR (Accuracy- 97.82%, Sensitivity-98.57%, Specificity- 96.81%) |
|
Mini-MIAS |
DCNN features merged with LBP and GLCM texture features. |
Ensemble Boosted Tree |
Accuracy-98.8%, Sensitivity-100%, Specificity-92.55% |
|
MIAS, DDSM, BCDR |
Shannon entropy, Tsallis entropy, Renyi entropy, and energy extracted using BDWPT. |
Optimized-KELM using WC-SSA. |
Accuracy (MIAS-99.28%, DDSM-99.63%, BCDR-99.60%) |
|
DDSM |
Combination of GLRL, GLSZ, LTEM, and NGTD features. |
ANN with ten hidden layers. |
Accuracy-96.2%, Sensitivity-97.6%, Specificity-95.2% |
|
Mammogram's DICOM images of 80 patients collected from hospitals in Cyprus. |
Intensity features, Shape features, FOS, and GLCM features. |
SVM |
Accuracy- 99.5% |
|
MIAS |
Texture, Shape, and invariant moment features are integrated. |
ANN |
Accuracy- 97% |
|
CBIS-DDSM, INbreast |
LBP, HOG, SIFT, ResNet, VGG, DenseNet. |
DE-Ada (Discriminant correlation analysis-effective range-based gene selection-Adaptive Boosting algorithm). |
Accuracy- (CBIS-DDSM- 90.91%, INbreast- 87.93%) |
|
Mammogram images from the Hospital of Shanxi Medical University |
|
DenseNet-II neural network. |
Accuracy- 94.55% |
4. Conclusion
This paper presented a literature review of breast cancer detection in mammogram images. The series of stages used in detection are discussed in detail along with a number of image datasets available in the literature.
To achieve good performance, the preprocessing of screened images is necessary for extracting and enhancing regions of interest. Researchers, along with the usage of traditional filters, propose numerous preprocessing techniques. Furthermore, a large number of segmentation techniques have been proposed by researchers and semantic techniques which have been found to be more suitable.
It has been found that researchers apply several augmentation techniques on mammogram images either directly or on ROI-segmented images to generate large-size datasets. Large datasets are providing classifiers with sufficient data and help avoid data underfitting problems.
Earlier CAD models were based on traditional features and conventional classification approaches. These classifiers were simple but not very smart, and their performance was sensitive to externally extracted features. Due to significant improvements, recent deep learning models are replacing conventional classifiers. The depth of these models is increasing tremendously, and many hidden layers provide an enhanced learning environment. Their integrated feature extraction and classification capabilities reduce the overhead of manual feature extraction. Although the performance of these deep learning-based models is very appealing, it involves complex training and architectural issues.
Using transfer learning (TL), researchers recently adopted the benefit of both deep learning and traditional feature extraction techniques. Using TL, the learning of pre-trained deep neural networks is used for quality feature extraction.
A significant performance improvement has been observed after incorporating deep and transfer learning over traditional feature extraction and classification models.
5. Acknowledgment
This work has been done under the Visvesvaraya fellowship scheme of the Government of India (GOI).
6. Conflicts of interests
The authors of this paper would like to declare that they do not have any conflict of interest with any individual (s) or any institution (financial/non-financial).
References
Aghdam, H. H., Puig, D., and Solanas, A. (2014). Adaptive Probabilistic Thresholding Method for Accurate Breast Region Segmentation in Mammograms. IEEE International Conference on Pattern Recognition, 3357–3362. https://doi.org/10.1109/ICPR.2014.578
Alam, T., Shia, W. C., Hsu, F. R., and Hassan, T. (2023). Improving Breast Cancer Detection and Diagnosis through Semantic Segmentation Using the Unet3+ Deep Learning Framework. Biomedicines, 11(6), 1536. https://doi.org/10.3390/biomedicines11061536
Alkhaleefah, M., Tan, T. H., Chang, C. H., Wang, T. C., Ma, S. C., Chang, L., and Chang, Y. L. (2022). Connected-SegNets: A Deep Learning Model for Breast Tumor Segmentation from X-ray Images. Cancers, 14(16), 4030. https://doi.org/10.3390/cancers14164030
American Cancer Society- Cancer facts and figures – ACS. (2013-2022).
Andersson, I., Hildell, J., Muhlow, A., and Pettersson, H. (1978). Number of projections in mammography: influence on detection of breast disease. American Journal of Roentgenology, 130(2), 349–351. https://doi.org/10.2214/ajr.130.2.349
Anitha, J., and Peter, J. D. (2015). Mammogram segmentation using maximal cell strength updation in cellular automata. Medical and Biological Engineering and Computing, 53(8), 737–749. https://doi.org/10.1007/s11517-015-1280-0
Asadi, B., and Memon, Q. (2023). Efficient breast cancer detection via cascade deep learning network. International Journal of Intelligent Networks, 4, 46–52. https://doi.org/10.1016/j.ijin.2023.02.001
Azour, F., and Boukerche, A. (2023). An Efficient Transfer and Ensemble Learning based Computer Aided Breast Abnormality Diagnosis System. IEEE Access, 11, 21199–21209. https://doi.org/10.1109/ACCESS.2022.3192857
Baccouche, A., Garcia-Zapirain, B., Castillo Olea, C., and Elmaghraby, A. S. (2021). Connected-UNets: a deep learning architecture for breast mass segmentation. NPJ Breast Cancer, 7(1), 151. https://doi.org/10.1038/s41523-021-00358-x
Baker, J. A., Rosen, E. L., Lo, J. Y., Gimenez, E. I., Walsh, R., and Soo, M. S. (2003). Computer-aided detection (CAD) in screening mammography: sensitivity of commercial CAD systems for detecting architectural distortion. American Journal of Roentgenology, 181(4), 1083–1088. https://doi.org/10.2214/ajr.181.4.1811083
Bobeda, J., García-Gonzalez, M. J., Pérez-Herrera, L. V., and Lopez-Linares, K. (2023, May). Unsupervised Data Drift Detection Using Convolutional Autoencoders: A Breast Cancer Imaging Scenario. International KES Conference on Innovation in Medicine and Healthcare, 345–354. Singapore: Springer Nature Singapore. https://doi.org/10.1007/978-981-99-3311-2_31
Breiman, L. (1996). Bagging Predictors. Machine Learning, 26, 123–140. https://doi.org/10.1007/BF00058655
Breiman, L. (2001). Random Forests. Machine Learning, 45, 5–32. https://doi.org/10.1023/A:1010933404324
Byung W. H., and Bong S. S. (2010). Segmentation of Regions of Interest in Mam-mograms in a Topographic Approach. IEEE Transactions on Information Technology in Biomedicine, 14(1), 129–139. https://doi.org/10.1109/TITB.2009.2033269
Chakravarthy, S. S., Bharanidharan, N., and Rajaguru, H. (2023). Processing of digital mammogram images using optimized ELM with deep transfer learning for breast cancer diagnosis. Multimedia Tools and Applications, 82(30), 47585–47609. https://doi.org/10.1007/s11042-023-15265-5
Chen, Z., Yang, J., Li, S., Lv, M., Shen, Y., Wang, B., … and Yang, J. (2017). Inva-sive lobular carcinoma of the breast: a special histological type compared with invasive ductal carcinoma. PLoS One, 12(9), e0182397. https://doi.org/10.1371/journal.pone.0182397
Cheng, Y., Gao, Y., Xie, L., Xie, X., and Lin, W. (2020). Spatial enhanced rotation aware network for breast mass segmentation in digital mammogram. IEEE Access, 10, 92559–92570. https://doi.org/10.1109/access.2020.2978009
Cho, P., and Yoon, H. J. (2021). Evaluation of U-net-based image segmentation model to digital mammography. Medical Imaging 2021: Image Processing, 11596, 593–599. SPIE. https://doi.org/10.1117/12.2581401
Christianini, N., and Taylor, J. C. S. (2000). An Introduction to Support Vector Ma-chines and Other Kernel-Based Learning Methods. Cambridge University Press. https://doi.org/10.1017/CBO9780511801389
Dhamodharan, S., Pichai, S. (2021). Background Preserved and Feature-Oriented Contrast Improvement Using Weighted Cumulative Distribution Function for Digital Mammograms. In: Balasubramaniam, P., Ratnavelu, K., Rajchakit, G., Nagamani, G. Mathematical Modelling and Computational Intelligence Techniques. ICMMCIT 2021. Springer Proceedings in Mathematics and Statistics, 376. Springer, Singapore. https://doi.org/10.1007/978-981-16-6018-4_12
Dibden, A., Offman, J., Duffy, S. W., and Gabe, R. (2020). Worldwide Review and Meta-Analysis of Cohort Studies Measuring the Effect of Mammography Screening Pro-grammes on Incidence-Based Breast Cancer Mortality. Cancers, 12(4), 976. https://doi.org/10.3390/cancers12040976
Freund, Y. and Schapire, R. E. (1997). A Decision-Theoretic Generalization of On-Line Learning and an Application to Boosting. Journal of Computer and System Sciences, 55, 119–139. https://doi.org/10.1006/jcss.1997.1504
Friedman, J. H., J. Bentely, and Finkel, R. A. (1977). An Algorithm for Finding Best Matches in Logarithmic Expected Time. ACM Transactions on Mathematical Software 3(3), 209–226. https://doi.org/10.1145/355744.355745
Ganesh, K., and Rao, B. P. (2023). Classification of Breast Cancer from Mammogram Images using DenseNET. Journal of Biomedical Engineering, 40(2), 192–199.
Ghiasi G. (2021). Simple Copy-Paste is a Strong Data Augmentation Method for Instance Segmentation. IEEE/CVF Conference on Computer Vision and Pattern Recognition (CVPR), 2917–2927. https://doi.org/10.1109/CVPR46437.2021.00294
Guo, Y., Hastie, T., and Tibshirani, R. (2007). Regularized linear discriminant analysis and its application in microarrays. Biostatistics, 8(1), 86–100. https://doi.org/10.1093/biostatistics/kxj035
Gupta, B., Tiwari, M. (2017). A tool supported approach for brightness preserving contrast enhancement and mass segmentation of mammogram images using histogram modified grey relational analysis. Multidim Syst Sign Process, 28, 1549–1567. https://doi.org/10.1007/s11045-016-0432-1
Hamad, Y. A., Seno, M. E., Safonova, A. N., & Shakir, S. (2022). Breast Tumor Segmentation on Medical Images using Combination of Fuzzy Clustering and Threshold. Computer Integrated Manufacturing Systems, 28(10), 70–83.
Hastie, T., Tibshirani, R., Friedman, J. H., and Friedman, J. H. (2009). The elements of statistical learning: data mining, inference, and prediction 2, 1–758. New York: springer. https://doi.org/10.1007/b94608_8
Heath, M., Bowyer K., Kopans D., Kegelmeyer P., Moore R., and Chang K. (1998). Current status of the digital database for screening mammography. Digital Mammography. Computational Imaging and Vision, 13, 457–460. https://doi.org/10.1007/978-94-011-5318-8_75
Kaiming, H., Xiangyu, Z., Shaoqing, R., and Jian, S. (2015). Delving deep into rectifiers: Surpassing human-level performance on imagenet classification. IEEE international conference on computer vision, 1026–1034. https://doi.org/10.1109/ICCV.2015.123
King, M. A., Doherty, P. W., Schwinger, R. B., and Penney, B. C. (1983). A Wiener filter for nuclear medicine images. Medical physics, 10(6), 876–880. https://doi.org/10.1118/1.595352
Kulkarni, S., and Rabidas, R. (2023). Fully convolutional network for automated detection and diagnosis of mammographic masses. Multimedia Tools and Applications, 82, 44819–44840 https://doi.org/10.1007/s11042-023-14757-8
Kumar, I., Kumar, A., Kumar, V. A., Kannan, R., Vimal, V., Singh, K. U., and Mahmud, M. (2022). Dense tissue pattern characterization using deep neural network. Cognitive computation, 14(5), 1728–1751. https://doi.org/10.1007/s12559-021-09970-2
Li, B., Friedman, J., Olshen, R., and Stone, C. (1984). Classification and regression trees (CART). Biometrics, 40(3), 358–361. https://doi.org/10.2307/2530946
Li, H., Chen, D., Nailon, W. H., Davies, M. E., and Laurenson, D. I. (2021). Dual convolutional neural networks for breast mass segmentation and diagnosis in mammography. IEEE Transactions on Medical Imaging, 41(1), 3–13. https://doi.org/10.1109/TMI.2021.3102622
Li, H., Zhuang, S., Li, D., Zhao, J., and Ma, Y. (2019). Benign and malignant classification of mammogram images based on deep learning. Biomedical Signal Processing and Control, 51, 347–354. https://doi.org/10.1016/j.bspc.2019.02.017
Loizidou, K., Skouroumouni, G., Nikolaou, C., and Pitris, C. (2020). An automated breast micro-calcification detection and classification technique using temporal subtraction of mammograms. IEEE Access, 8, 52785–52795. https://doi.org/10.1109/ACCESS.2020.2980616
Lopez, M. G., Posada, N., Moura, D. C., Pollan, R. R., Valiente, J. M. F., Ortega, C. S., and Araújo, B. M. F. (2012). BCDR: a breast cancer digital repository. 15th International conference on experimental mechanics, 1215, 1–5. Porto, Portugal.
Mabrouk, M. S., Afify, H. M., and Marzouk, S. Y. (2019). Fully automated computer-aided diagnosis system for micro calcifications cancer based on improved mammographic image techniques. Ain Shams Engineering Journal, 10(3), 517–527. https://doi.org/10.1016/j.asej.2019.01.009
Michael, H., Kevin, B., Daniel, K., Richard, M., and Philip, W. K. (2001). The Digital Database for Screening Mammography. In M. J. Yaffe (ed.), International Workshop on Digital Mammography, 212–218. Medical Physics Publishing.
Misra, S., Solomon, N. L., Moffat, F. L., and Koniaris, L. G. (2010). Screening criteria for breast cancer. Advances In Surgery, 44, 87–100. https://doi.org/10.1016/j.yasu.2010.05.008
Mohanty, F., Rup, S., Dash, B., Majhi, B., and Swamy, M. N. S. (2020). An improved scheme for digital mammogram classification using weighted chaotic salp swarm algorithm-based kernel extreme learning machine. Applied Soft Computing, 91, 106266. https://doi.org/10.1016/j.asoc.2020.106266
Moreira, I. C., Amaral, I., Domingues, I., Cardoso, A., Cardoso, M. J., and Cardoso, J. S. (2012). Inbreast: toward a full-field digital mammographic database. Academic radiology, 19(2), 236–248. https://doi.org/10.1016/j.acra.2011.09.014
Nalawade, Y. V. (2009). Evaluation of breast calcifications. The Indian Journal of Radiology and Imaging, 19(4), 282–286. https://doi.org/10.4103/0971-3026.57208
Oza, P., Sharma, P., and Patel, S. (2023). Deep ensemble transfer learning-based framework for mammographic image classification. The Journal of Supercomputing, 79(7), 8048–8069. https://doi.org/10.1007/s11227-022-04992-5
Patel, J. J., and Hadia, S. K. (2023). Two-Stage Feature Selection Method Created for 20 Neurons Artificial Neural Networks for Automatic Breast Cancer Detection. Trends in Sciences, 20(2), 4027–4027. https://doi.org/10.48048/tis.2023.4027
Pati, A., Parhi, M., Pattanayak, B. K., Singh, D., Singh, V., Kadry, S., and Kang, B. G. (2023). Breast Cancer Diagnosis Based on IoT and Deep Transfer Learning Enabled by Fog Computing. Diagnostics, 13(13), 2191. https://doi.org/10.3390/diagnostics13132191
Petrini, D. G., Shimizu, C., Roela, R. A., Valente, G. V., Folgueira, M. A. A. K., and Kim, H. Y. (2022). Breast Cancer Diagnosis in Two-View Mammography. Using End-to-End Trained EfficientNet-Based Convolutional Network. IEEE Access, 10, 77723–77731. https://doi.org/10.1109/ACCESS.2022.3193250
Rahmati, P., Hamarneh, G., Nussbaum, D., Adler, A. (2010). A New Preprocessing Filter for Digital Mammograms. In A. Elmoataz, O. Lezoray, F. Nouboud, D. Mammass, and J. Meunier (eds.), Image and Signal Processing. ICISP 2010. Lecture Notes in Computer Science, vol. 6134. Springer, Berlin, Heidelberg. https://doi.org/10.1007/978-3-642-13681-8_68
Raj, R., Mathew, J., Kannath, S. K., and Rajan, J. (2022). Crossover based technique for data augmentation. Computer Methods and Programs in Biomedicine, 218, 106716. https://doi.org/10.1016/j.cmpb.2022.106716
Rajalakshmi, N. R., Vidhyapriya, R., Elango, N. and Ramesh, N. (2020). Deeply supervised U-Net for mass segmentation in digital mammograms. International Journal of Imaging Systems and Technology, 31(1), 59–71. https://doi.org/10.1002/ima.22516
Ramani, R., Vanitha, N. S., and Valarmathy, S. (2013). The preprocessing techniques for breast cancer detection in mammography images. International Journal of Image, Graphics and Signal Processing, 5(5), 47. https://doi.org/10.5815/ijigsp.2013.05.06
Ranjbarzadeh, R., Nazanin, T. S., Saeid, J. G., Mohammad, S. E., Mahboub, P., Yaghoub, P., Shokofeh, A., and Malika, B., (2022). MRFE-CNN: Multi-route feature extraction model for breast tumor segmentation in Mammograms using a convolutional neural network. Annals of Operations Research, 1–22. https://doi.org/10.1007/s10479-022-04755-8
Ravikumar, M., Rachana, P. G., and Shivaprasad, B. J. (2023). Segmentation of tumour from mammogram images using U-SegNet: a hybrid approach. Computer Methods in Biomechanics and Biomedical Engineering: Imaging and Visualization, 11(3), 387–398. https://doi.org/10.1080/21681163.2022.2072769
Rebecca, S. L., Francisco, G., Assaf, H., and Daniel, R. (2016). Curated Breast Imaging Subset of DDSM. The Cancer Imaging Archive.
Rmili, M., Moutaouakkil, A. E., and Saleck, M. M. (2022). Hybrid Mammogram Segmentation Using Watershed and Region Growing. In Advances in Information, Communication and Cybersecurity: Proceedings of ICI2C'21 (pp. 23–32). Springer International Publishing. https://doi.org/10.1007/978-3-030-91738-8_3
Schapire, R. E., Freund, Y., Bartlett, P. L., and Lee, W. S. (1998). Boosting the margin: A new explanation for the effectiveness of voting methods. Annals of Statistics, 26(5), 1651–1686. https://doi.org/10.1214/aos/1024691352
Seber, G. A. (2009). Multivariate observations. John Wiley and Sons.
Shahrokhy, S. M. (2004). Visual and statistical quality assessment and improvement of remotely sensed images. ISPRS Proceedings XXXV (950).
Shamim, H. M. (2022). Micro Calcification Segmentation Using Modified U-net Segmentation Network from Mammogram. Journal of King Saud University - Computer and Information Sciences, 34(2), pp. 86–94. https://doi.org/10.1016/j.jksuci.2019.10.014
Sharma, B. P., and Purwar, R. K. (2020). Dual thresholding based Breast cancer detection in Mammograms. IEEE World Conference on Smart Trends in Systems, Security and Sustainability (WorldS4), 589–592). https://doi.org/10.1109/WorldS450073.2020.9210323
Sharma, B. P., and Purwar, R. K. (2022). Ensemble Boosted Tree based Mammogram image classification using Texture features and extracted smart features of Deep Neural Network. ADCAIJ: Advances in Distributed Computing and Artificial Intelligence Journal, 10(4), 419–434. https://doi.org/10.14201/ADCAIJ2021104419434
Sharma, B. P., and Purwar, R. K. (2023). An augmented mammogram image dataset and its performance analysis for various classification models. Multimedia Tools and Applications, 82, 32011–32055. https://doi.org/10.1007/s11042-023-14566-z
Sharma, M. K., Jas, M., Karale, V., Sadhu, A., and Mukhodhyay, S. (2019). Mammogram segmentation using multi-atlas deformable registration. Computers in Biology and Medicine, 110, 244–253. https://doi.org/10.1016/j.compbiomed.2019.06.001
Sickles, E. A., Weber, W. N., Galvin, H. B., Ominsky, S. H., and Sollitto, R. A. (1986). Baseline screening mammography: one vs two views per breast. American Journal of Roentgenology, 147(6), 1149–1153. https://doi.org/10.2214/ajr.147.6.1149
Suckling, J. (1994). The Mammographic Image Analysis Society Digital Mammogram Database Exerpta Medica. International Congress Series 1069, 375–378).
Taghanaki, S. A., Liu, Y., Miles B. and Hamarneh, G. (2017). Geometry-Based Pectoral Muscle Segmentation From MLO Mammogram Views. IEEE Transactions on Biomedical Engineering, 64(11), 2662–2671. https://doi.org/10.1109/TBME.2017.2649481
Talmi, I., Mechrez, R., and Zelnik-Manor, L. (2017). Template matching with deformable diversity similarity. IEEE Conference on Computer Vision and Pattern Recognition, 175–183. https://doi.org/10.1109/CVPR.2017.144
Taylor, L., Nitschke, G. (2018). Improving deep learning with generic data augmentation. IEEE Symposium Series on Computational Intelligence (SSCI), 1542–1547. https://doi.org/10.1109/SSCI.2018.8628742
Tiryaki, V. M. (2023). Mass segmentation and classification from film mammograms using cascaded deep transfer learning. Biomedical Signal Processing and Control, 84, 104819. https://doi.org/10.1016/j.bspc.2023.104819
Uthoff, J., and Sieren, J. C. (2018). Information theory optimization based feature selection in breast mammography lesion classification. IEEE International Symposium on Biomedical Imaging (ISBI 2018), 817–821. https://doi.org/10.1109/ISBI.2018.8363697
Vidal, J., Vilanova, J. C., and Martí, R. (2022). A U-Net Ensemble for breast lesion segmentation in DCE MRI. Computers in Biology and Medicine, 140, 105093. https://doi.org/10.1016/j.compbiomed.2021.105093
Welch, H. G., Prorok, P. C., OMalley, A. J., and Kramer, B. S. (2016). Breast-cancer tumor size, overdiagnosis, and mammography screening effectiveness. New England Journal of Medicine, 375(15), 1438–1447. https://doi.org/10.1056/NEJMoa1600249
Yang, H., and Zhou, Y. (2021). IDA-GAN: A Novel Imbalanced Data Augmentation GAN. International Conference on Pattern Recognition (ICPR). https://doi.org/10.1109/ICPR48806.2021.9411996
Zebari, D. A., Ibrahim, D. A., Zeebaree, D. Q., Mohammed, M. A., Haron, H., Zebari, N. A., and Maskeliunas, R. (2021). Breast cancer detection using mammogram images with improved multi-fractal dimension approach and feature fusion. Applied Sciences, 11(24), 12122. https://doi.org/10.3390/app112412122
Zemmal, N., Azizi, N., Ziani, A., Benzebouchi, N. E., and Aldwairi, M. (2019). An enhanced feature selection approach based on mutual information for breast cancer diagnosis. 2019 6th international conference on image and signal processing and their applications (ISPA), 1–6. IEEE. https://doi.org/10.1109/ISPA48434.2019.8966803
Zhang, H., Wu, R., Yuan, T., Jiang, Z., Huang, S., Wu, J., … and Ji, D. (2020). DE-Ada*: A novel model for breast mass classification using cross-modal pathological semantic mining and organic integration of multi-feature fusions. Information Sciences, 539, 461–486. https://doi.org/10.1016/j.ins.2020.05.080
Zhong, Z., Zheng, L., Kang, G., Li, S., and Yang, Y. (2020). Random Erasing Data Augmentation. Proceedings of the AAAI Conference on Artificial Intelligence, 34(07), 13001–13008. https://doi.org/10.1609/aaai.v34i07.7000
Zuiderveld, K. (1994). Contrast Limited Adaptive Histograph Equalization. Graphic Gems IV, 474–485. San Diego: Academic Press Professional. https://doi.org/10.1016/B978-0-12-336156-1.50061-6