ADCAIJ: Advances in Distributed Computing and Artificial Intelligence Journal
Regular Issue, Vol. 12 N. 1 (2023), e31228
eISSN: 2255-2863
DOI: https://doi.org/10.14201/adcaij.31228
Explainable Heart Disease Diagnosis with Supervised Learning Methods
Tsehay Admassu Assegiea, Sushma S.Jb and Shonazarova Shakhnoza Mamanazarovnac
a Department of Computer Science, Injibara University, Injibara, Ethiopia.
b Department of Electronics and Communication Engineering, GSSS Institute of Engineering and Technology for Women, Mysuru, Karnataka, India.
c Department of Life Safety, Polytechnic Institutes, South Ural State University (National Research University), Russia.
tsehayadmassu2006@gmail.com, enggsush@gmail.com, shonazarova87@inbox.ru
ABSTRACT
The objective of this study is to develop a heart disease diagnosis model with a supervised machine learning algorithm. To that end, random forest (RF), support vector machine (SVM), Naïve Bayes (NB), and extreme boosting (XGBoost) are employed in a medical heart disease dataset to develop a model for heart disease prediction. The performance of the algorithms is investigated and compared for automation of heart disease diagnosis. The best model is selected, and a grid search is applied to improve model performance. The simulation result shows that the XGBoost model outperforms the others, achieving 99.10% accuracy, and receiver operating characteristic curve (AUC score=0.99) compared to RF, SVM, and NB on heart disease detection. Finally, the obtained result is interpreted with Shapley additive model explanation (SHAP) to investigate the effect of each feature on the diagnosis of heart disease. A case study on heart disease diagnosis shows an important insight into the impact of the feature on the diagnosis performance of the supervised learning method. The developed model had an expressively higher prediction accuracy, indicating the utility of supervised learning systems in detecting heart disease in the early stages.
KEYWORDS
XGBboost; interpretable model; interoperable AI; machine learning
1. Introduction
Heart disease refers to various disorders of the heart such as structural abnormalities and the blockage of blood vessels (Abdulaziz Albahr et al., 2021). Heart disease is the major death-causing disease in the world causing over 1.7 million deaths all over the world. Thus, early diagnosis of heart disease is essential to clinical decision-making and proper medication in the early stage. Identifying patients with heart disease is vital for effective healthcare delivery. Because early identification of heart disease and associated heart disease risk factors is important for decision support for further screening. Over the past few years, machine learning has been widely applied for the early diagnosis of heart disease. For instance, Kartik Budholiya et al. (2022) investigated the XGBoost model for early identification of heart disease. The developed model was assessed for its effectiveness in heart disease diagnosis. The assessment of the performance of the XGBoost model for heart disease diagnosis shows promising results achieving 91.8% accuracy.
Similarly, Devansh Shah et al. (2020) investigated the applicability of four machine learning methods for heart disease diagnosis. The study investigated the performance of Naïve Bayes (NB), decision tree (DT), k-neighbors (KNN), and random forest (RF) algorithms. The assessment of the performance of these models for heart disease prediction revealed that KNN permed well on the heart disease dataset compared to the NB, DT, and RF algorithms. The result is a promising algorithm there is still scope for improvement. As shown in the simulation, the NB achieves an accuracy of 88.157%, K-NN=90.789%, DT=80.263%, and RF=86.84%.
Another study evaluated the performance of three supervised learning methods namely, KNN, DT, SVM, and linear regression (LR) on the University of California Irvine (UCI) heart disease dataset (Archana Singh et al., 2020). The evaluation of the performance showcased that a better result was obtained with the SVM algorithm. The SVM model achieved an accuracy of 83%, DT achieved 79%, LR achieved 78%, and the KNN achieved 87%. Thus, the KNN model is a better model for diagnosis of heart disease achieving higher prediction accuracy.
Over the past few years, several studies have been conducted on the problem of heart disease prediction using different supervised learning methods. For instance, an artificial neural network (ANN) based heart disease diagnosis model was developed. The performance of the developed ANN model was evaluated to assess its performance in the early detection of heart disease. The result revealed that the ANN model achieved an accuracy of 85.7% for heart disease prediction. In addition, the performance of the SVM model was evaluated showing an average validation accuracy of 85.5% for heart disease detection (Setyo Nugroho et al., 2022).
While many of the existing supervised heart disease diagnosis models have shown better accuracy and precision in heart disease detection, the interpretation of the prediction to the medical experts is gaining much research interest in recent years. The interpretation of prediction of supervised learning methods and narrowing the gap between accuracy and model complexity, different techniques have been developed for model explanations. Tsehay Admassu Assegie et al. (2022) evaluated the RF model for heart disease diagnosis. The study highlighted that the use of model interoperation methods such as local model agnostic explanations (LIME), and Shapley additive explanations (SHAP) is significantly important to bridge the gap between the complexity and interpretability of supervised learning methods such as ensemble learning, and RF. Thus, this study aims to focus on the evaluation of supervised machine learning methods, DT, RF, SVM, and NB and the explanation of the prediction result of these models. The rest of the study is organized in the following way: Section 2 presents the current work, Section 3 presents the method and materials employed, Section 4 discusses the result and Section 5 presents the conclusion.
2. Literature Review
Currently, various machine learning techniques have been widely applied in the diagnosis of heart disease. XGBoost-based application to predict heart disease was presented by Maria Athanasiou et al. (2020). An explainable model was developed to predict cardiovascular disease (CVD) risk factors by interpreting the prediction of the XGBoost model with SHAP. The developed XGboost model achieved an AUC score of 71.13. The simulation result showcased that SHAP provides insight into the prediction process of ensemble learning methods such as the XGBoost model. The explanation of the XGBoost model was important because it highlighted the underlying effect of the model prediction.
Some of the supervised machine learning methods in heart disease prediction include SVM, RF, and XGBoost. Abdul Saboor et al. (2022) applied these methods and developed a model for heart disease prediction. The study highlighted that the use of supervised machine learning methods in the early detection of heart disease is paramount to avoid heart disease-related complications and mortality. The study trained and validated the XGBoost, RF, and SVM for heart disease diagnosis. The result revealed that SVM achieved higher accuracy (96.72%) compared to the other supervised learning method. While the accuracy of the SVM model is found to be promising, the explanation of the prediction is not investigated in the study. Various types of pre-processing such as standardization and hyperparameter tuning were performed in the study. These pre-processing systems have improved the performance of the SVM, RF, and XGBoost for heart disease prediction. The comparative result of the performance of these supervised learning methods revealed that all of the models permed well on a pre-processed dataset.
In addition, Jae Kwon Kim and Sanggil Kang (2017) applied correlation analysis for improving the performance of a supervised ML model for heart disease prediction. In the study, neural network (NN), and logistic regression models were compared for chronic heart disease risk prediction. The result shows that logistic regression performed with an accuracy of 80.32%, and the NN’s predictive performance had an accuracy of 81.09% on the test set. Thus, the logistic regression model outperformed the NN for heart risk factor prediction.
Similarly, Shumaila Shehzadi et al. (2022) applied different supervised learning methods for developing a predictive model for heart disease diagnosis. Three supervised learning methods namely, LR, NB, and RF were compared for heart disease prediction. The result of the comparative assessment of the accuracy of these models revealed that the RF model performed with higher accuracy (99%) compared to the NB, and LR models. Although the prediction accuracy of the developed model was higher than the previous results found in the literature, the study does not provide an interpretation of the prediction outcome. Interoperability of ensemble methods such as RF is critical to the healthcare expert for better trust and adaptability of such higher-performing models in the healthcare industry. While the development of an automated ML model is multi-objective, meeting high performance and better interpretability, the study does not investigate the interpretation of the prediction outcome of a highly accurate model.
Another study applied different supervised learning algorithms, such as decision tree, random forest, support vector machine, K-nearest neighbor, logistic regression, and Gaussian Naive Bayes, to the Cleveland heart disease dataset (Kaushalya Dissanayake and Gapar Md Johar, 2021). The authors applied chi-squared statistics, and backward propagation for feature selection to improve the performance of the proposed model for heart disease diagnosis. The simulation result of the study revealed that a higher classification accuracy of 88.52% was achieved with backward propagation feature selection.
In the healthcare industry, the interpretability of a decision-supporting prediction system plays a vital role. It is not possible to adopt predictive models for decision-making without an understanding of the internal working of the prediction models used for decision support (Roberto Porto et al, 2021). In the cases where the expert is not able to explain the decision made by the predictive model, the patient may not trust the prediction outcome of the automated model used for heart disease detection. The interpretation of the results of supervised machine learning (SML) is often complicated. For this reason, research has been carried out on the interpretability of SML methods employed in medical decision support and different methods have been developed for providing an interpretation of the prediction outcome of the SML computational methods. In this regard, local model agnostic explanation (LIME), and Shapley additive explanation (SHAP) have been proposed for interpreting the prediction made by SML. The motivation of this research arose from the investigation of improving the prediction outcome of SML such as RF, NB, SVM, and XGBoost with grid search technique for parameter tuning, and to evaluate and apply the SHAP method to develop a model with higher accuracy and better interpretability for heart disease diagnosis.
The existing work presented in the literature survey is summarized in Table 1. As summarized in Table 1, it is evident that supervised learning methods such as RF, ANN, DT, SVM, LR, classification and regression tree (CART), gradient boosting (GB), and KNN algorithms are widely used for heart disease diagnosis. The ANN algorithm outperforms other supervised learning algorithms presented in Table 1. The ANN model is an effective algorithm; supervised learning methods such as RF, and GB models perform with better accuracy for heart disease prediction.
Table 1. Summary of existing research
Nº. |
Authors |
Algorithm employed |
Accuracy achieved (in %) |
1. |
ANN |
96.30% |
|
2. |
RF |
91.8% |
|
3. |
NB, DT, KNN, and RF |
90.78% with K=7 |
|
4. |
KNN, DT, LR, and SVM |
87% with KNN |
|
5. |
SVM |
85.5% |
|
6. |
RF |
85.1% |
|
7. |
ANN |
97.01% |
|
8. |
CART |
96.76% |
|
9. |
ANN, SVM, RF, GB |
86% with RF |
|
10. |
DT, KNN, SVM, GB, RF |
91.34% with GB |
3. Material and Methods
This section presents the experimental results. Firstly, the dataset was collected from a public machine learning data repository. Secondly, the dataset was explored with different statistical analysis methods such as duplicate identification, missing value analysis, and descriptive analysis using correlation and distribution plots. Thirdly, the RF, NB, SVM, and XGBoost model was trained on the cleaned dataset and their performance was analyzed. Then, the best performing model among SVM, NB, RF, and XGBoost models was selected. Finally, hyperparameter tuning with grid search was applied to the selected model. For evaluation purposes, the ROC curve of the selected model was plotted, and the result was analyzed.
3.1. Exploratory Data Analysis
The distribution of features is shown in Figure 1. Statistical methods such as standardization, distribution plot, and descriptive statistics were applied to the heart disease dataset to explore the dataset for feature importance, the variability using descriptive statistics. Table 2 demonstrates the descriptive statistics such as standard deviation (STD), mean, count, and maximum (Max-HR) of the heart disease dataset features.
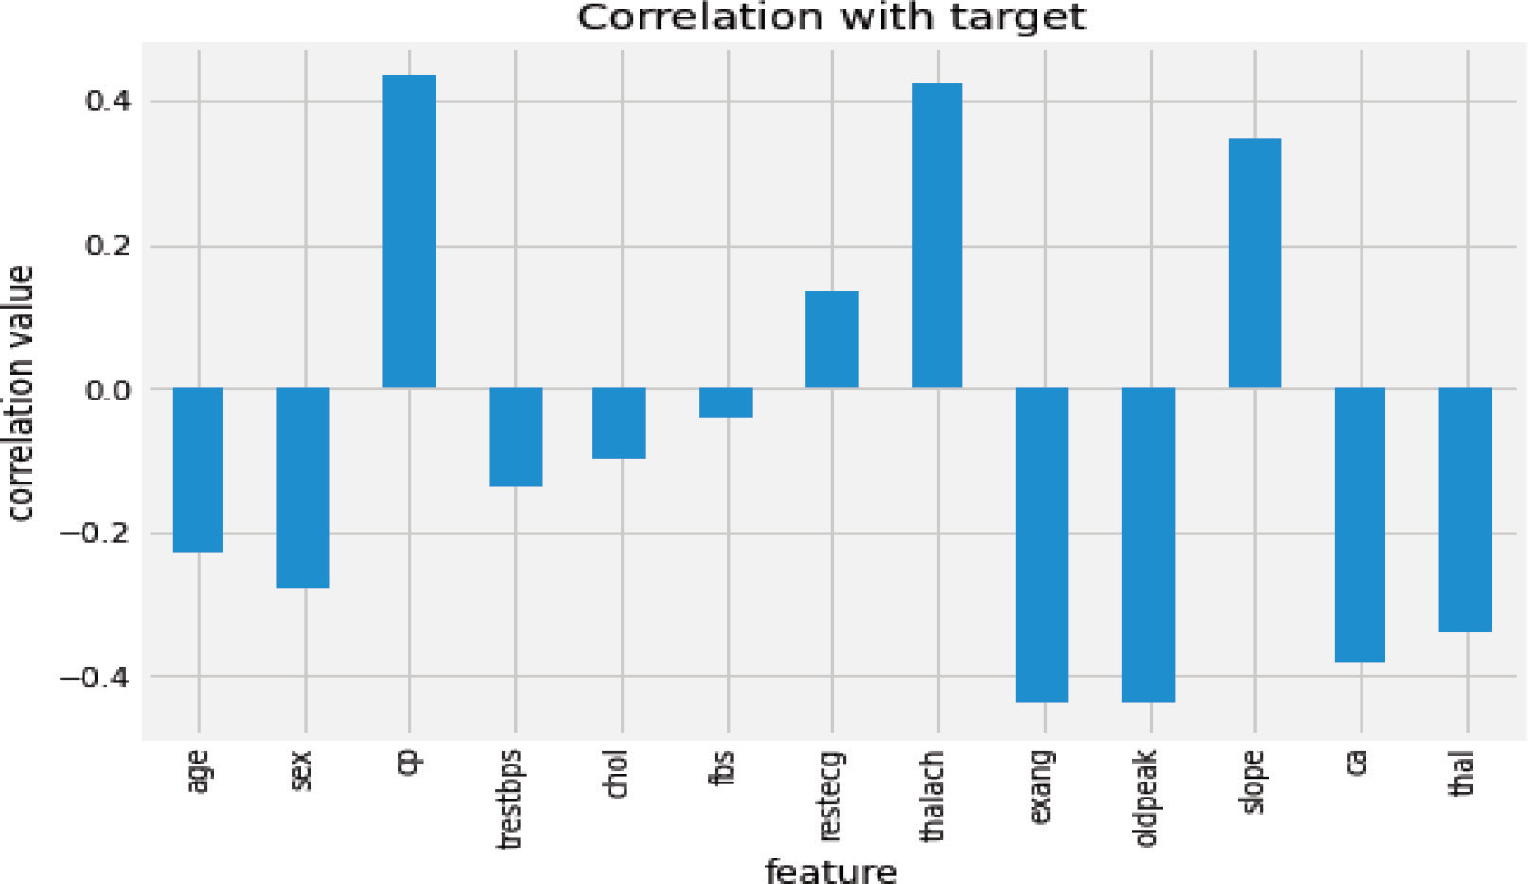
Figure 1. Feature correlation with target variable
Table 2. Descriptive statistics for numeric heart disease dataset feature
No. |
Feature |
Count |
STD |
Mean |
Max |
1. |
Age |
1025 |
6.0722 |
54.43 |
77.00 |
2. |
Resting BP |
1025 |
17.5167 |
131.61 |
200.00 |
3. |
Cholesterol |
1025 |
51.5925 |
246.00 |
564.00 |
4. |
Max-HR |
1025 |
23.0057 |
149.11 |
202.00 |
To explore the correlation between the target feature and the independent features, the correlation between the target and each heart disease feature was analyzed. The chest pain (cp), maximum heart rate achieved (thalach), and the slope have a high positive correlation to the target feature as illustrated in Figure 1. In contrast, ST segment depression (oldpeak), exercise due to angina, and the number of vessels blocked have a strong negative correlation to the target feature or class label as shown in Figure 1.
4. Experimental Results and Discussions
The experimental analysis and evaluation of the results involve pre-processing and the final analysis. The XGBoost was used to predict heart disease based on the dataset collected from the Kaggle data repository. The performance of the four supervised learning algorithms, RF, NB, XGBoost, and SVM is tested on the heart disease dataset. In performance evaluation the best model for heart disease prediction was investigated; accuracy, receiver operating characteristics curve (ROC), accuracy, precision, recall, and F-score were employed as performance metrics. Thus, the performance assessment result for the SVM, RF, NB, and XGBoost model for heart disease detection was demonstrated in Table 3.
Table 3. The performance of supervised learning methods for heart disease prediction
No. |
Model |
Accuracy |
Precision |
Recall |
F-score |
5. |
RF |
96.38% |
84% |
84% |
84% |
6. |
NB |
85.97% |
91% |
90% |
90% |
7. |
SVM |
90.49% |
99% |
93.67% |
99% |
8. |
XGBoost |
99.1% |
99% |
99% |
99% |
Figure 2 demonstrates the performance of the supervised machine learning methods on the heart disease dataset. The simulation result showed that the XGBoost model outperforms the other methods with higher accuracy, precision, recall, and F-score. RF achieved the second highest accuracy, and the NB model has the lowest accuracy among the four supervised learning methods tested on the heart disease dataset.
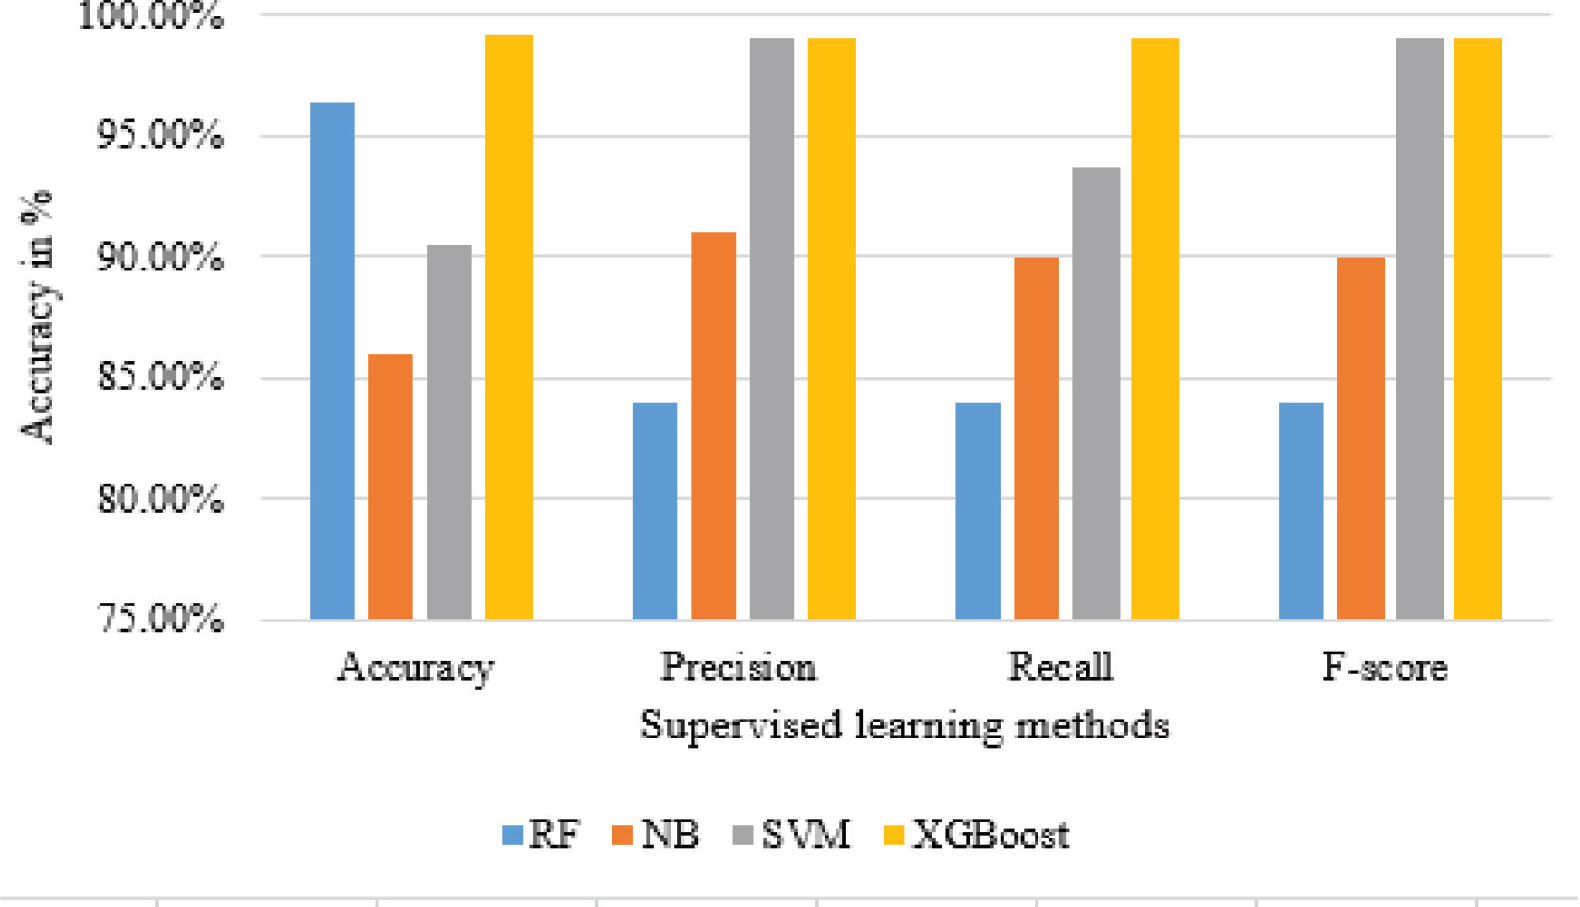
Figure 2. The performance of supervised learning methods for heart disease prediction
Figure 3 demonstrates the receiver operating characteristic (ROC) curve of the XGBoost model for heart disease prediction. The XGBoost model score was 0.99 as demonstrated in Figure 3. The ROC curve and area under the curve show that the model effectively detects the patterns associated with heart disease. Thus, the XGBoost model with different explanation techniques such as SHAP, LIME, and Eli5 can be used in healthcare systems for heart disease diagnosis. The explanation techniques provide the reasons behind each of the predictions made by the model.

Figure 3. ROC curve of XGBoost
4.1. Explanation of Supervised Learning Models
To get an insight into features that are most important for the XGBoost model prediction, the SHAP values plot of every heart disease feature were analyzed. Figure 4 shows heart disease features contributing to the XGBoost model output from the base value (the average model output over the training dataset we passed) to the model output. Features pushing the prediction to class 1 (heart disease) are shown in red, and those pushing the prediction to class 0 (no heart disease) are in blue.
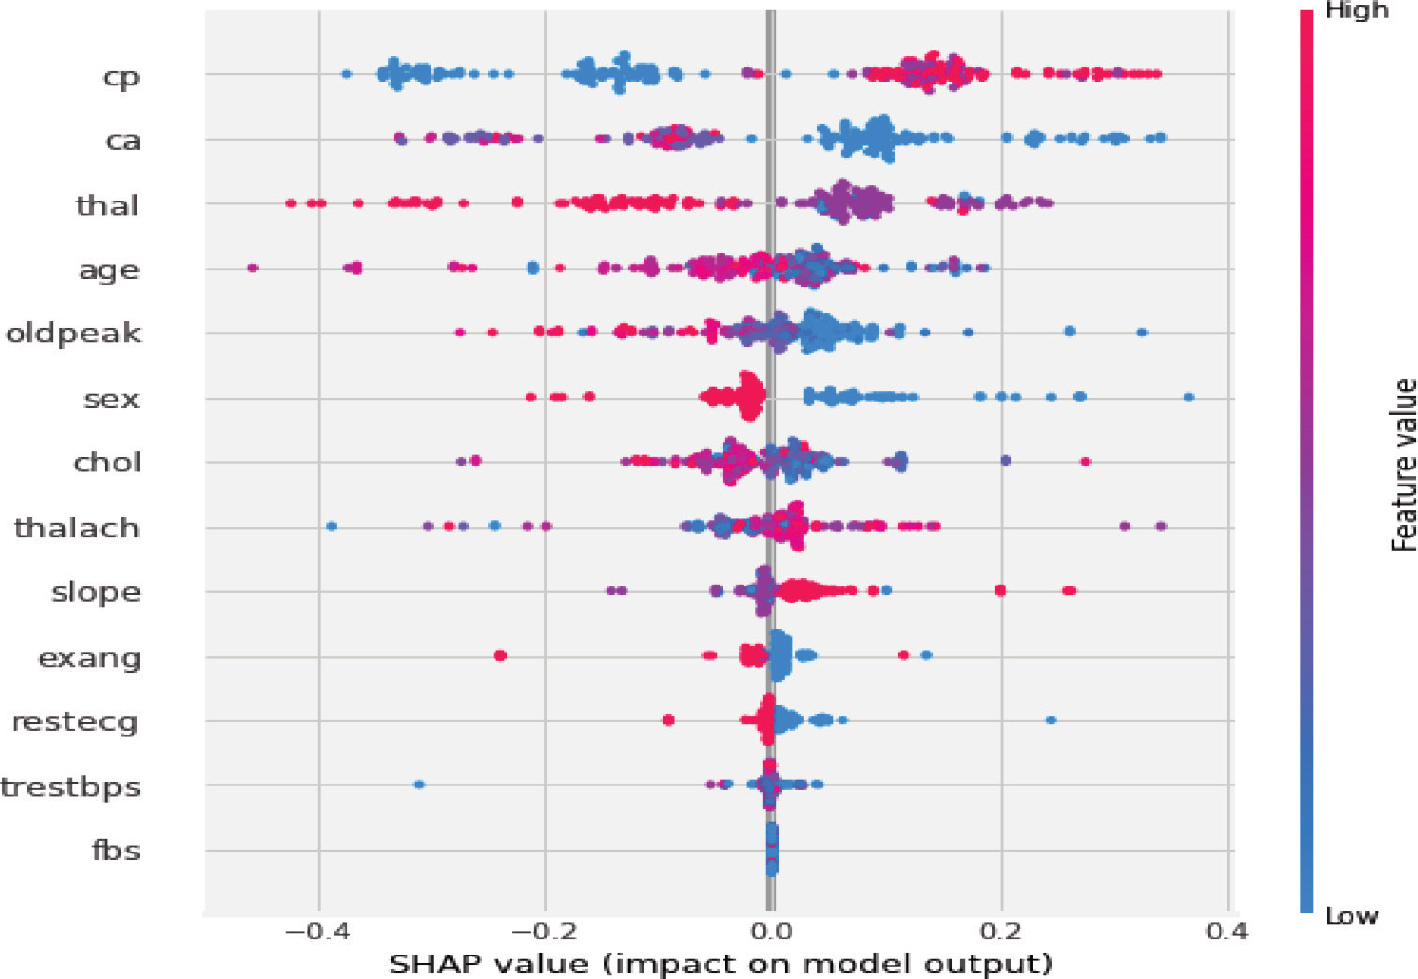
Figure 4. SHAP explanation for the XGBoost model
The results demonstrated in Figure 3 show that the heart disease features such as chest pain, vessels identified by fluoroscopy, thalassemia and age are the most important features. To provide interpretability of the XGBoost model, SHAP analysis was performed. The SHAP feature importance in Figure 3 shows that within the model a chest pain, vessels, thalassemia and age contributed towards heart disease prediction with a non-linear relationship between SHAP values and individual predictor variables. XGBoost model ranked chest pain the highest in terms of the importance of features as characterized by SHAP.
In addition to the SHAP global explanation, local model explanation techniques with the help of eli5, and SHAP local plot were performed to evaluate how the explainers provide interpretation to the XGBoost model for heart disease prediction. The local explanation was performed for the same instance in the dataset which has a positive label. The eli5 explanation of the instance used in testing the XGboost model was shown in Table 4. To interpret the XGBoost model predictions more interpretable, the prediction of the model was presented as a sum of feature contributions and the bias. Table 2 shows how the heart disease features lead to a particular prediction. In Table 4, ELI5 shows the weights for each feature and their actual value. The weights depict how influential each feature has been in contributing to the final prediction decision of the XGBoost. As shown in Table 2, the top three influential features of the XGBoost model prediction, after the bias are age, thalassemia, and maximum heart rate. The ELI5 feature importance shown in Table 4 demonstrates that cholesterol and depression (oldpeak) have a little contribution as compared to the other features for the XGBoost prediction of the instance used in the simulation. The age of the patient has the highest weight contributing the most to the prediction outcome of the model. We conclude that ELI5 is good at explaining the feature weight demonstrating the features contributing to the prediction outcome of the developed XGBoost model for heart disease prediction.
Table 4. Explanation generated by ELI5
No. |
Feature |
Weight |
Actual value |
1. |
Age |
+1.723 |
41 |
2. |
Thalliumtest |
+1.443 |
2 (2=Reversible defect) |
3. |
Maximum heart rate |
+1.193 |
163 |
4. |
|
+0.998 |
0 (0=No vessel blocked) |
5. |
Chest pain |
+0.905 |
1(1=Typical Angina) |
6. |
Sex |
+0.878 |
0(0=Female, 1=Male) |
7. |
Slope |
+0.481 |
2 (2=Flat) |
8. |
Resting blood pressure |
+0.236 |
126 |
9. |
Resting electrocardiogram |
+0.199 |
1(1=Normal) |
10. |
Exercise angina |
+0.144 |
0(0=No angina due to exercise) |
11. |
<BIAS> |
+0.055 |
1 |
12. |
oldpeak |
-0.046 |
0(0=No depression due to exercise) |
13. |
Cholesterol |
-0.143 |
306mg/dl |
The local explanation produced by SHAP for the instances having actual values demonstrated in Table 2, is shown in Figure 5. The actual label of the instance used in the experiment is 1 (showing positive for heart disease; the patient truly suffers from heart disease)
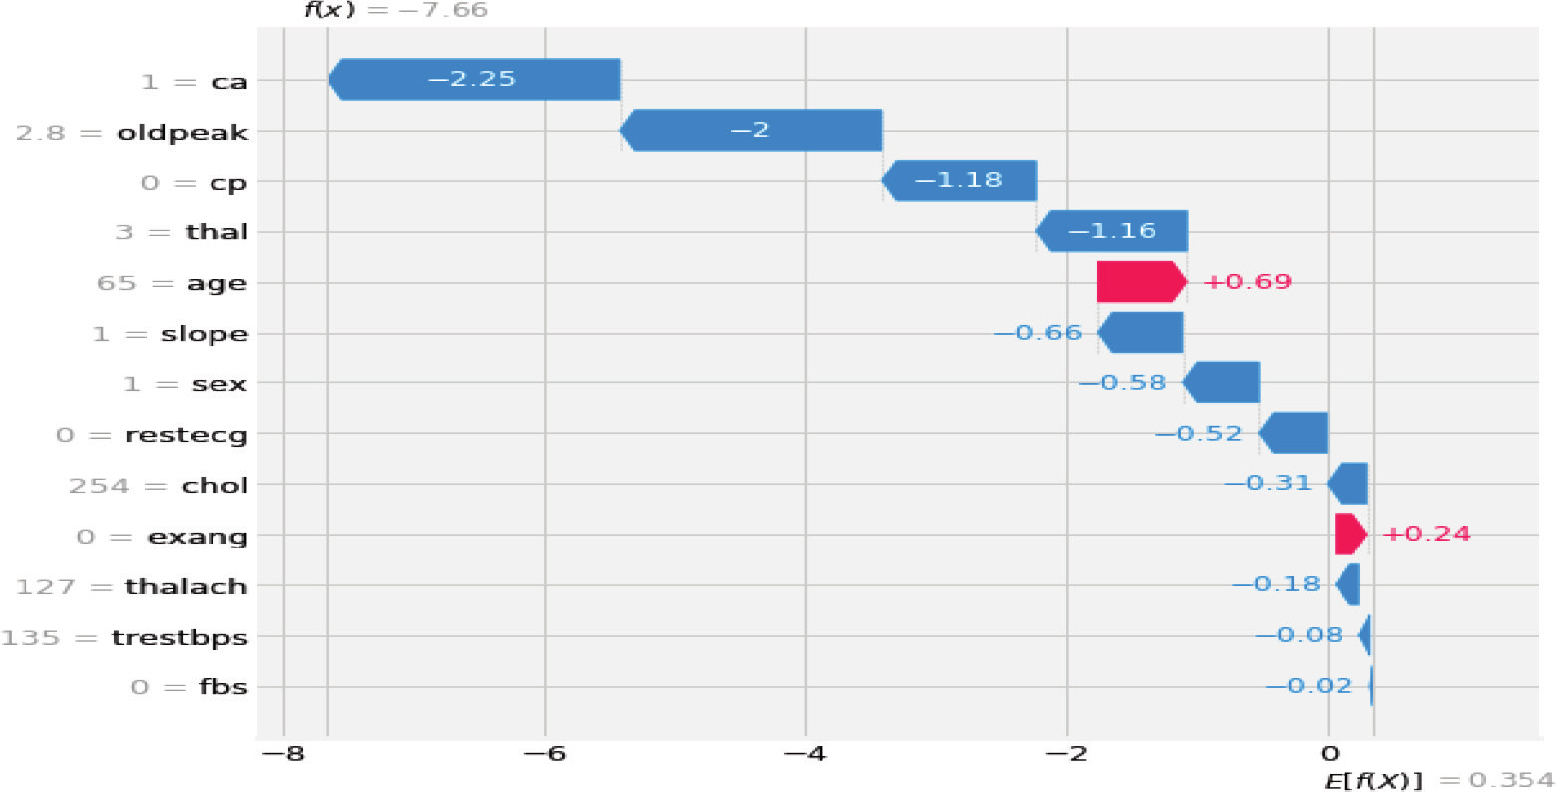
Figure 5. SHAP explanation for the XGBoost model
As demonstrated in Figure 4, the explanation shows each feature contributing to the XGBoost model output from the base value (the average model output over the training dataset). Features pushing the prediction to class 1 (heart disease patient) are shown in red, and those pushing the prediction to class 0 (no heart disease) are shown in blue. The explanation generated by SHAP is demonstrated in Table 5. As shown in Table 5, the blockage of blood vessels is the major interpretation of the SHAP method for the model’s prediction of the test instance being a heart disease patient. Moreover, depression, chest pain, thallium scan, and age are considered the major contributing features to the model prediction according to the SHAP explanation. According to the result obtained from the SHAP explanation, a patient with higher age (age=65), and who is male (sex=1) has a higher chance of getting heart disease.
Table 5. Explanation generated by SHAP
No. |
SHAP ranking |
1. |
Number of vessels blocked |
2. |
Depression |
3. |
Chest pain |
4. |
Thallium scan |
5. |
Age |
6. |
Slope |
7. |
Sex |
8. |
Resting electrocardiogram |
9. |
Cholesterol |
10. |
Angina due to exercise |
11. |
Maximum heart rate |
12. |
Total resting blood pressure |
13. |
Fasting blood sugar |
In addition to the interpretation provided by the SHAP method, local model agnostic explanation (LIME) is employed to interpret the XGBoost prediction of the test instance. Figure 5 demonstrates a LIME-generated explanation for the interpretation of the XGBoost prediction. The explanation provided by LIME and SHAP differs as the SHAP explainer provided the reason for XGBoost prediction of the test instance due to the blockage of blood vessels and the LIME explained the XGBoost prediction of the test instance being a heart disease patient due to thallium scan. According to the LIME explanation, a person with a thallium scan result of the reversible defect (thal=2) has a higher chance of getting heart disease. The second reason for the test instance being predicted as a heart disease patient by the XGBoost model according to the LIME generated explanation is the blockage of blood vessels as demonstrated in Figure 6. According to the SHAP explanation, a higher depression refers that the patient is suffering from heart disease.
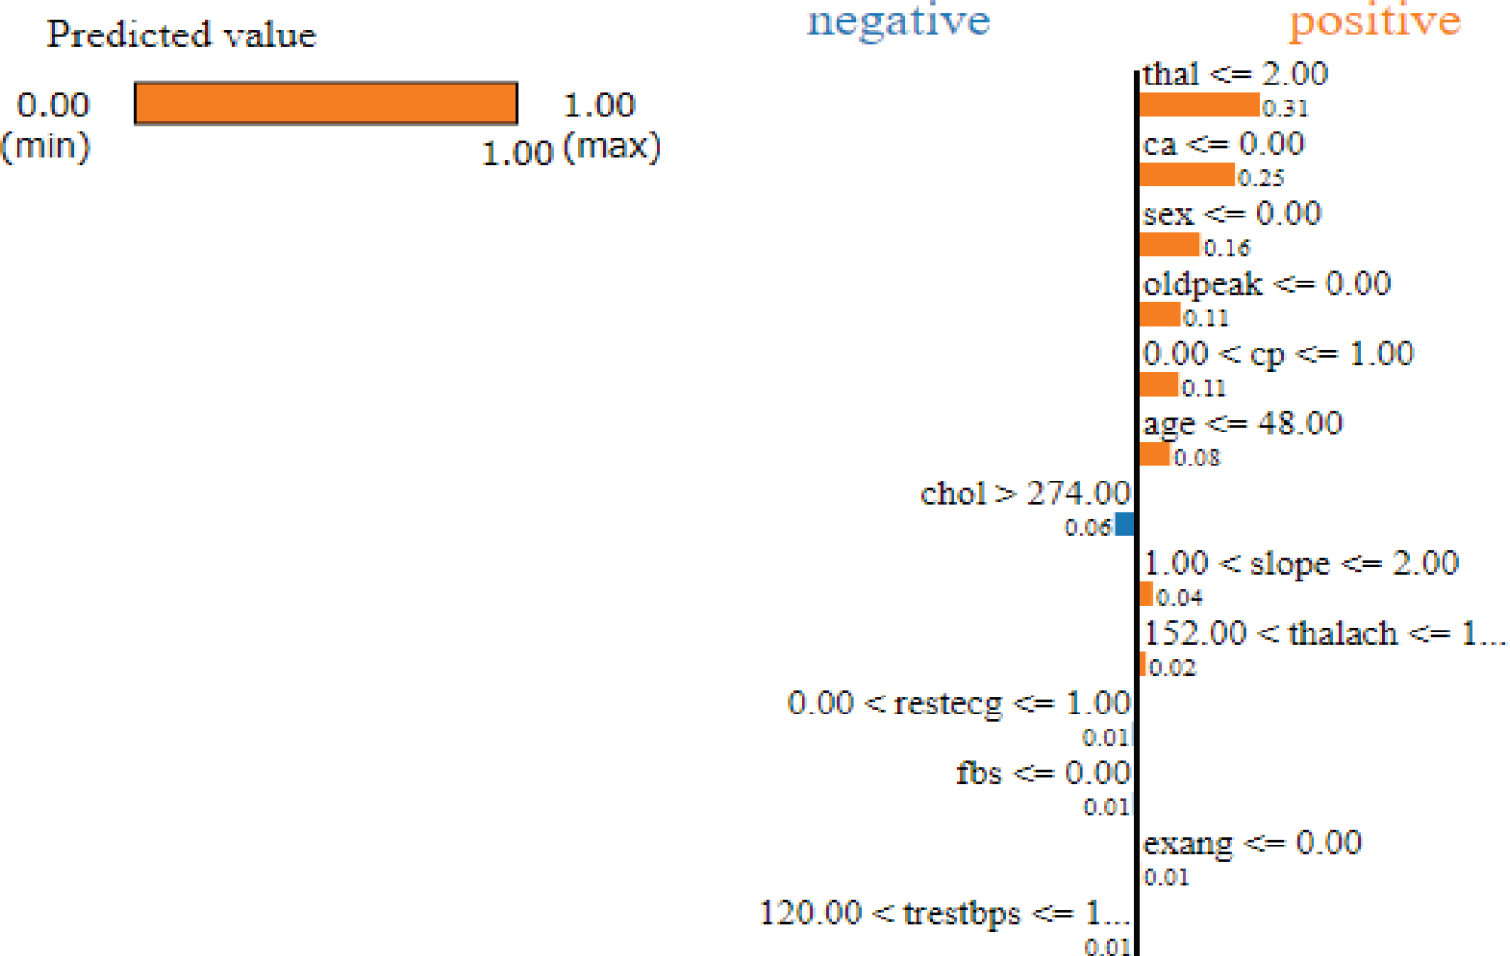
Figure 6. Explanation generated by LIME
As demonstrated in Figure 6, the thallium scan contributed much to the XGBoost model predicting the given instance as a heart disease patient according to the explanation provided by LIME. Likewise, the number of blocked vessels (ca), the gender of the patient (sex), oldpeak, chest pain, and age contribute to the model's prediction pushing the model to predict the instance of the heart disease patient or positive class. In contrast, some of the features such as cholesterol (chol), resting electrocardiogram (restecg), fasting blood sugar (fbs), and total resting blood pressure (trestbps) pushed the model towards the negative or heart disease negative class.
4.2. Comparison of Model Interpretation Methods
This study is original in that it followed a different methodology compared to other works in the literature. The methodological difference between previous studies and this study is that this study investigates the performance of four supervised machine learning methods for heart disease diagnosis and compared model interpretation methods. Table 6 illustrates the methods used for interpreting supervised learning model prediction for heart disease prediction. The interpretation result of the three model explanation methods, namely, LIME, ELI5, and SHAP is discussed in this section. Previous studies do not show the comparison of different model interpretation methods. For example, Taeseob O. et al. (2022) developed a machine learning model for heart disease diagnosis. However, the developed model did not provide an interpretation of the diagnosis outcome. Another study developed a computational model for heart disease (Yar M. et al., 2020). The developed model had better accuracy and ROC curve area, however, the practicality of different model interpretation methods such as LIME, ELI5, and SHAP was not studied. Thus, this study compared these explanation methods for heart disease diagnosis.
Table 6. Comparison of model explanation methods
Feature rank |
ELI5 |
SHAP |
LIME |
1. |
Age |
Number of vessels blocked |
Thallium scan |
2. |
Thallium scan |
Depression |
Number of vessels blocked |
3. |
Maximum heart rate |
Chest pain |
Sex |
4. |
Number of vessels blocked |
Thallium scan |
Depression |
5. |
Chest pain |
Age |
Chest pain |
6. |
Sex |
Slope |
Age |
7. |
Slope |
Sex |
Cholesterol |
8. |
Resting blood pressure |
Resting electrocardiogram |
Slope |
9. |
Resting electrocardiogram |
Cholesterol |
Maximum heart rate |
10. |
Exercise angina |
Angina due to exercise |
Resting electrocardiogram |
11. |
Depression |
Maximum heart rate |
Fasting blood sugar |
12. |
Cholesterol |
Total resting blood pressure |
Angina due to exercise |
13. |
Feasting blood sugar |
Fasting blood sugar |
Total resting blood pressure |
The interpretation of the LIME, ELI5, and SHAP differs as the explanation of each method is different for similar test instances used in the experiment, as depicted in Table 6. The explanation generated by ELI5 provides model interpretation showing that higher age contributes to positive model prediction. However, the SHAP explanation interprets the positive model prediction output to be due to the blockage of blood vessels as the highest contributor or reason for the model’s prediction of the test instance as a heart disease patient.
5. Conclusion
This study evaluated the performance of four different supervised machine learning algorithms, namely, RF, NB, SVM, and XGBoost. The experimental simulation shows that XGBoost outperformed the others with accuracy and recall scores of 99 and 99.1, respectively. Tuning the hyperparameters of XGBoost could increase the accuracy and recall scores of the prediction to 96.2% and 99.1%. The investigation of the model explanation approaches such as eli5 and SHAP showed that the predictive outcome of XGBoost is interpretable and SHAP and eli5 provided a good explanation. The SHAP value plots show that features such as depression induced by exercise relative to rest have the highest contribution to the prediction. Moreover, slope values (up sloping) push the prediction to class 0 (no heart disease), while the flat slope of the peak exercise ST segment pushes the model output to heart disease. Patients with asymptomatic chest pain type, which is encoded to 0 (blue color in the graph) are more likely to have heart disease. Males (encoded to 1) are more likely to have heart disease than females. The higher the exercise angina, the higher the chance of having heart disease.
References
Albahr, A., et al. (2021). Computational Learning Model for Prediction of Heart Disease Using Machine Learning Based on a New Regularizer. Hindawi Computational Intelligence and Neuro science. https://doi.org/10.1155/2021/8628335
Almutairi, S., et al. (2022). A Context-Aware MRIPPER Algorithm for Heart Disease Prediction. Hindawi Journal of Healthcare Engineering. https://doi.org/10.1155/2022/7853604
Alsaffar, M., et al (2021). Machine Learning for Ischemic heart disease diagnosis aided by Evolutionary Computing. Applied Bionics and Biomechanics. https://doi.org/10.1155/2021/6718029
Assegie, T. A. (2022). Evaluation of the Shapley Additive Explanation Technique for Ensemble Learning Methods. Proceedings of Engineering and Technology Innovation, 21, 20–26. https://doi.org/10.46604/peti.2022.9025
Athanasiou M., et al. (2020). An explainable XGBoost–based approach towards assessing the risk of cardiovascular disease in patients with Type 2 Diabetes Mellitus. 2020 IEEE 20th International Conference on Bioinformatics and Bioengineering (BIBE). https://doi.org/10.1109/BIBE50027.2020.00146
Budholiya, K., Shrivastava, S. K., & Sharma, V. (2022). An optimized XGBOOST based diagnostic system for effective prediction of heart disease. Journal of King Saud University – Computer and Information Sciences, 34(7), 1–10. https://doi.org/10.1016/j.jksuci.2020.10.013
Dissanayake K., & Johar, G. M. (2021). Comparative Study on Heart Disease Prediction Using Feature Selection Techniques on Classification Algorithms. Applied Computational Intelligence and Soft Computing. https://doi.org/10.1155/2021/5581806
Kim, K. H., & Kang, S. (2017). Neural Network-Based Coronary Heart Disease Risk Prediction Using Feature Correlation Analysis. Journal of Healthcare Engineering. https://doi.org/10.1155/2017/2780501
Muhammad, Y., Tahir, M., Hayat, M., & Chong, K. T. (2020). Early and accurate detection and diagnosis of heart disease using intelligent computational model. Scientific Reports, 10(1). https://doi.org/10.1038/s41598-020-76635-9
Nugroho K. S., et al. (2022). Effective predictive modelling for coronary artery diseases using support vector machine. IAES International Journal of Artificial Intelligence, 11(1), 345–355. https://doi.org/10.11591/ijai.v11.i1.pp345-355
Oh, T. I., Kim, D., Lee, S., et al. (2022). Machine learning-based diagnosis and risk factor analysis of cardiocerebrovascular disease based on KNHANES. Scientific Reports, 12(1). https://doi.org/10.1038/s41598-022-06333-1
Porto, R., et al. (2021). Minimum Relevant Features to Obtain Explainable Systems for Predicting Cardiovascular Disease Using the Statlog Data Set. Applied Science. https://doi.org/10.20944/preprints202012.0318.v1
Saboor, A., et al. (2022). A method for Improving Prediction of Human Heart Disease Using Machine Learning Algorithms. Mobile Information Systems. https://doi.org/10.1155/2022/1410169
Shah, D., Patel, S., & Bharti, S. K. (2020). Heart Disease Prediction using Machine Learning Techniques. SN Computer Science, 1. https://doi.org/10.1007/s42979-020-00365-y
Shehzadi, S., et al. (2022). Diagnosis of Chronic Ischemic Heart Disease Using Machine Learning Techniques. Computational Intelligence and Neuroscience. https://doi.org/10.1155/2022/3823350
Singh, A., & Kumar, R. (2020). Heart Disease Prediction Using Machine Learning Algorithms. 2020 International Conference on Electrical and Electronics Engineering (ICE3). https://doi.org/10.1109/ICE348803.2020.9122958
Author’s Biography
Mr. Tsehay Admassu Assegie obtained M.Sc., degree from Andhra University. He is currently working as Lecturer at Department of Computer Science, Injibara University, Ethiopia. His research interests include: machine learning, health informatics, Artificial Intelligence, and deep learning. His contributions to the field of Computer Science have been published in prestigious indexed and peer-reviewed international journals. He has published over 47+ scholarly articles in different international journals co-authored by more than 34 authors from different countries such as Nigeria, India, South Africa, and Ethiopia. |
Dr. Sushma S J, is working as Associate Professor, Department of ECE, GSSS Institute of Engineering and Technology for women, Mysuru. She has got 21 years of teaching experience. She has obtained Bachelor of Engineering from Manglore University in the year 2001. In 2007. She obtained Master of Technology and Ph.D from Visveswaraya Technological University, Belagavi, India. She has published 40+ papers in national conferences 16+ in international conference and 50+ in international journal. Her area of interests includes Image Processing, Computational Intelligence, machine learning, data science and Computer Networks. |