ADCAIJ: Advances in Distributed Computing and Artificial Intelligence Journal
Regular Issue, Vol. 12 N. 1 (2023), e28715
eISSN: 2255-2863
DOI: https://doi.org/10.14201/adcaij.28715
A Novel Study for Automatic Two-Class and Three-Class COVID-19 Severity Classification of CT Images using Eight Different CNNs and Pipeline Algorithm
Hüseyin Yaşara, Murat Ceylanb, Hakan Cebecic, Abidin Kılınçerc, Nusret Seherc, Fikret Kanatd and Mustafa Koplayc
a Ministry of Health of Republic of Turkey, Ankara, Turkey.
b Department of Electrical and Electronics Engineering, Faculty of Engineering and Natural Sciences, Konya Technical University, Konya, Turkey.
c Department of Radiology, Selçuk University Faculty of Medicine, Konya, Turkey.
d Department of Chest Diseases, Selçuk University Faculty of Medicine, Konya, Turkey.
mirhendise@gmail.com, mceylan@ktun.edu.tr, hcebeci16@gmail.com, akilincer@yahoo.com, nusretseher@gmail.com, fkanat@selcuk.edu.tr, koplaymustafa@hotmail.com
ABSTRACT
SARS-CoV-2 has caused a severe pandemic worldwide. This virus appeared at the end of 2019. This virus causes respiratory distress syndrome. Computed tomography (CT) imaging provides important radiological information in the diagnosis and clinical evaluation of pneumonia caused by bacteria or a virus. CT imaging is widely utilized in the identification and evaluation of COVID-19. It is an important requirement to establish diagnostic support systems using artificial intelligence methods to alleviate the workload of healthcare systems and radiologists due to the disease. In this context, an important study goal is to determine the clinical severity of the pneumonia caused by the disease. This is important for determining treatment procedures and the follow-up of a patient’s condition. In the study, automatic COVID-19 severity classification was performed using three-class (mild, moderate, and severe) and two-class (non-severe and severe). In the study, deep learning models were used for classification. Also, CT images were utilized as radiological images. A total of 483 COVID-19 CT-image slices, 267 mild, 156 moderate, and 60 severe, were used. These images and labels were used directly for the three classifications. In the two-class classification, the mild and moderate images were accepted as non-severe. A total of eight classifications were made with convolutional neural network (CNN) architectures. These architectures are MobileNetv2, ResNet101, Xception, Inceptionv3, GoogleNet, EfficientNetb0, DenseNet201, and DarkNet53. In the study, the results of the top four CNN architectures with the best performance were combined using a pipeline algorithm. In this way, it is seen that significant improvements have been achieved in the results of the study. Before using the pipeline algorithm for the three-class classification, the results of weighted recall-sensitivity (SNST), specificity (SPCF), accuracy (ACCR), F-1 score (F-1), area under the receiver operating characteristic curve (AUC), and overall ACCR were obtained: 0.7785, 0.8351, 0.8299, 0.7758, 0.9112 and 0.7785, respectively. After using the pipeline algorithm for the three-class classification, the results of these parameters were obtained: 0.8095, 0.8555, 0.8563, 0.8076, 0.9089, and 0.8095, respectively. Before using the pipeline algorithm for the two-class classification, the results of SNST, SPCF, ACCR, F-1, and AUC were obtained: 0.9740, 0.8500, 0.9482, 0.9703, and 0.9788, respectively. After using the pipeline algorithm for the two-class classification, the results of these parameters were obtained: 0.9811, 0.8333, 0.9627, 0.9788, and 0.9851, respectively.
KEYWORDS
computed tomography (CT); convolutional neural network (CNN); COVID-19, deep learning; severity
1. Introduction
SARS-CoV-2 has caused a severe pandemic worldwide. This virus causes respiratory distress syndrome (Huang et al., 2020). The pneumonia caused by the virus in question has been defined as COVID-19 (Coronavirus Disease 2019) (World Health Organization, 2022a). COVID-19 has put excessive workload on the healthcare systems of countries. More than two years have passed since the onset of the pandemic, and the total number of cases worldwide now approaches 540 million (World Health Organization, 2022b). The number of deaths due to the disease is around 6.3 million (World Health Organization, 2022b). Although its treatment has been attempted, no drug developed specifically for the disease exists yet. The development of vaccinations has started in some countries as of the beginning of 2021 (World Health Organization, 2022c), but issues with production, supply, storage, and transportation slow down vaccination procedures. This indicates that it may take years to be able to control the disease (Calina et al., 2020). Another major problem is the mutated versions of the virus; the protection the vaccines provide against these mutations remains unclear. This shows that the effects of the disease will affect countries and societies for a long time.
Computed tomography (CT) imaging provides important radiological information for the diagnosis and clinical evaluation of pneumonia caused by bacteria or a virus. CT imaging is widely utilized in the identification and evaluation of COVID-19. Clinical studies have been published that reveal the radiological symptoms of the disease and the differences between it and other viral or bacterial pneumonia (Wong et al., 2020; Pontone et al., 2021; Pianura et al., 2020; Zhao et al., 2020; Lin et al., 2021). It is important to establish diagnostic support systems using artificial intelligence to alleviate the workload of the healthcare system and radiologists. In this context, many system-design studies that use automatic classification of two or multi-class radiological images such as ultrasound, CT and X-ray have been carried out. Another study goal in this regard is to determine the severity of the pneumonia that occurs due to COVID-19. This is important for determining treatment procedures and follow-up of a patient’s condition. In this section, literature studies in which the severity of COVID-19 is automatically predicted through artificial intelligence and CT images are examined.
Severe and critical COVID-19 cases were classified into pneumonia levels using three-dimensional deep learning by Li et al. (2020a). CT images of a total of 217 patients, including 82 severe and 135 critical patients, were used in the study. These images were divided into174 training images and 43 testing images, and experiments were carried out. As a result of the study, the area under the receiver operating characteristic curve (AUC) value for the training set was between 0.812 and 0.909, while the AUC value for the test set was between 0.787 and 0.861. 1,475 regions of interest (ROI) were determined from 141 CT capture sets of 130 COVID-19 patients by Carvalho et al. (2020). Later, well-aerated regions (472), ground-glass opacity (413), crazy paving and linear opacities (340), and consolidation (250) regions were determined by two radiologists over the said ROI. Pulmonary involvement was obtained by dividing the size of total labelled areas by the total lung volume. In this way, three classes were created, namely mild, moderate, and severe pulmonary involvement. The results of the classification processes, obtained using artificial neural networks, were the following: sensitivity (SNST) was 0.80, specificity (SPCF) 0.86, AUC 0.90, accuracy (ACCR) 0.82, and F-score 0.85. In the severity evaluation study conducted by Xiao et al. (2020), CT images of 408 patients collected from two different hospitals were divided into two groups: 303 patients for education and 105 patients for testing. Convolutional neural network (CNN) architectures (ResNet34, AlexNet, VGGNet, and DenseNet) were utilized in the classification processes carried out as non-severe and severe within the scope of the study. In the tests performed, it was seen that the most successful CNN architecture was ResNet34, and an ACCR level of 0.819 was obtained. In addition, 0.892 AUC was achieved in the tests.
Disease severity classification was performed using CT images of 207 normal, 194 mild, and 15 severe COVID-19 patients by Huang et al. (2021). Deep learning was used in the study and the CNN architecture that was put forward was named fast assessment network (FaNet). In this study, in which the images of 300 patients were designated for training and the images of 116 patients were designated for testing, 0.9483 classification ACCR was obtained. Automatic disease severity classification was performed by Li et al. (2020b) using 95 CT images of 32 severe COVID-19 patients and 436 CT images of 164 non-severe COVID-19 patients. A deep learning approach based on UNet and ResNet34 was used for segmentation processes in the study. SNST, SPCF, and AUC values were 0.9241, 0.9049, and 0.97, respectively. The classification of COVID-19 disease severity—severe and non-severe—was performed by Yu et al. (2020). In the study, 246 severe and 483 non-severe CT image slices collected from 202 COVID-19 patients were used. Four different CNN architectures were used to extract image properties and machine learning methods were used as classifiers. The highest ACCR result was 0.9520 (10-fold cross-validation) using DenseNet-201 and cubic SVM methods.
In the COVID-19 disease severity classification study by Meng et al. (2020), two-class automatic classification, severe and critical, was performed. The de-COVID19-Net architecture was used in the study, which was carried out using 366 CT images—256 severe, and 110 critical. As a result of the study, ACCR was calculated as 0.875 and AUC as 0.943. Using 297 CT images, Ho et al. (2021) performed a two-class classification as low risk and high risk. In the study, experiments were performed using 5-fold cross-validation. As a result of the study using 3D CNN, the highest ACCR was 0.933, while the highest AUC value was calculated as 0.900. Zhu et al. (2021) classified the severity of COVID-19 disease using a total of 408 CT images, 322 non-severe and 86 severe. As a result of the experiments performed with the 5-fold cross-validation method, the ACCR was 0.8569, while the AUC was calculated as 0.8591. An automatic COVID-19 severity classification was performed using three-class (mild, moderate, and severe) and two-class (non-severe and severe). In the study, deep learning models were used for classification. CT images were used as radiological images. A total of 483 COVID-19 CT image slices—267 mild, 156 moderate and 60 severe—were used in the study. These images and labels were used directly for three-class classification. In two-class classification, mild and moderate images were accepted as non-severe. A total of eight CNN architectures were classified—MobileNetv2, ResNet101, Xception, Inceptionv3, GoogleNet, EfficientNetb0, DenseNet201, and DarkNet53. In the study, the results of the top four CNN architectures with the best performance were combined using a pipeline algorithm. The results show that deep learning methods are an important alternative for the detection of COVID-19 severity and follow-up of patients in disease processes.
2. Methods
2.1. Used Data
The CT images used within the scope of the study were collected from the real world via Selçuk University Faculty of Medicine Hospital (Konya, Turkey). Some patients have more than one CT-scan set. These shooting sets were carried out on different days of the disease process. Three CT image slices were selected from each of the CT-acquisition sets. COVID-19 severity was labeled on the CT scans by four radiologists. If lobar involvement was between 1 and 25%, it was defined as mild, if it was between 25 and 50%, it was moderate, and if it was >50%, it was severe. Information about the gender of the patients, the day of the CT scan, and the severity of the disease are provided in Table 1; M stands for male, F for female, Mi for mild, Mo for moderate, and S for Severe.
Table 1. Information about the images utilized in the study
Case |
Gender |
First CT Result (Dav) |
Second CT Result (Dav) |
Third CT Result (Dav) |
Fourth CT Result (Dav) |
Fifth CT Result (Dav) |
Case-1 |
M |
Mo(l) |
S(5) |
S(10) |
S(15) |
Mo(45) |
Case-2 |
M |
Mo(l) |
Mo(5) |
S(10) |
No |
No |
Case-3 |
M |
Mi(l) |
Mi(5) |
Mi(10) |
Mi(30) |
No |
Case-4 |
M |
S(l) |
S(7) |
No |
No |
No |
Case-5 |
F |
Mi(l) |
Mi(5) |
Mi(10) |
Mi(30) |
No |
Case-6 |
F |
Mi(l) |
Mi(5) |
No |
No |
No |
Case-7 |
F |
Mi(1) |
Mi(5) |
Mi(10) |
No |
No |
Case-8 |
F |
Mi(l) |
Mi(5) |
Mi(20) |
No |
No |
Case-9 |
M |
Mo(l) |
S(5) |
Mo(20) |
No |
No |
Case-10 |
M |
Mi(l) |
Mo(7) |
Mo(15) |
No |
No |
Case-11 |
M |
Mi(l) |
Mi(5) |
No |
No |
No |
Case-12 |
F |
Mo(l) |
Mo(5) |
No |
No |
No |
Case-13 |
F |
S(l) |
S(5) |
Mo(15) |
No |
No |
Case-14 |
F |
Mo(l) |
S(5) |
S(15) |
No |
No |
Case-15 |
F |
Mi(l) |
Mi(10) |
Mi(15) |
No |
No |
Case-16 |
M |
Mi(l) |
S(5) |
Mo(10) |
Mi(30) |
No |
Case-17 |
M |
Mi(l) |
Mi(5) |
No |
No |
No |
Case-18 |
F |
Mi(l) |
Mo(5) |
Mo(10) |
No |
No |
Case-19 |
M |
Mi(l) |
Mi(7) |
Mi(10) |
No |
No |
Case-20 |
M |
Mi(l) |
Mi(5) |
No |
No |
No |
Case-2l |
M |
Mo(l) |
S(7) |
Mo(15) |
Mo(45) |
No |
Case-22 |
M |
Mo(l) |
Mo(10) |
Mo(15) |
No |
No |
Case-23 |
M |
Mo(l) |
Mo(5) |
No |
No |
No |
Case-24 |
F |
Mi(l) |
Mo(5) |
No |
No |
No |
Case-25 |
M |
S(l) |
S(5) |
No |
No |
No |
Case-26 |
F |
Mi(l) |
Mi(10) |
Mi(15) |
No |
No |
Case-27 |
M |
Mi(l) |
Mo(10) |
Mo(15) |
Mo(20) |
No |
Case-28 |
F |
Mi(l) |
Mi(5) |
Mi(15) |
Mi(22) |
No |
Case-29 |
M |
Mi(l) |
Mo(5) |
No |
No |
No |
Case-30 |
M |
Mi(l) |
Mi(10) |
No |
No |
No |
Case-31 |
F |
Mi(l) |
Mi(5) |
Mo(10) |
Mi(15) |
Mi(30) |
Case-32 |
M |
Mo(l) |
Mo(5) |
Mi(10) |
No |
No |
Case-33 |
M |
Mi(l) |
Mi(7) |
Mi(10) |
No |
No |
Case-34 |
M |
Mo(l) |
Mo(5) |
Mo(10) |
Mo(15) |
No |
Case-35 |
M |
Mi(l) |
Mo(5) |
No |
No |
No |
Case-36 |
F |
Mi(l) |
Mi(5) |
Mi(10) |
No |
No |
Case-37 |
F |
Mi(l) |
Mo(5) |
No |
No |
No |
Case-38 |
F |
Mi(l) |
Mo(10) |
No |
No |
No |
Case-39 |
F |
Mi(l) |
Mo(5) |
Mi(10) |
No |
No |
Case-40 |
F |
Mi(l) |
Mi(5) |
Mi(10) |
No |
No |
Case-41 |
F |
Mi(l) |
Mo(5) |
Mo(10) |
No |
No |
Case-42 |
M |
Mo(5) |
No |
No |
No |
No |
Case-43 |
M |
Mo(1) |
S(7) |
No |
No |
No |
Case-44 |
M |
Mi(l) |
Mi(5) |
No |
No |
No |
Case-45 |
M |
Mi(l) |
Mo(5) |
Mi(10) |
No |
No |
Case-46 |
F |
S(l) |
Mo(10) |
No |
No |
No |
Case-47 |
M |
Mi(l) |
S(5) |
No |
No |
No |
Case-48 |
F |
Mi(l) |
Mi(8) |
Mi(30) |
No |
No |
Case-49 |
F |
Mi(l) |
Mi(7) |
No |
No |
No |
Case-50 |
F |
Mi(l) |
Mi(5) |
No |
No |
No |
Case-51 |
F |
Mi(l) |
Mi(7) |
Mi(15) |
Mi(30) |
No |
Case-52 |
F |
M(7) |
No |
No |
No |
No |
Case-53 |
F |
S(l) |
S(5) |
Mo(10) |
No |
No |
Case-54 |
F |
Mi(l) |
Mi(5) |
Mo(15) |
No |
No |
Case-55 |
M |
Mi(l) |
Mo(5) |
No |
No |
No |
Case-56 |
M |
Mi(l) |
Mo(5) |
Mo(10) |
Mi(30) |
No |
Case-57 |
M |
Mi(l) |
Mo(10) |
No |
No |
No |
Case-58 |
F |
Mi(l) |
Mo(5) |
Mi(15) |
No |
No |
Automatic COVID-19 severity classification was carried out using three-class (mild, moderate, and severe) and two-class (non-severe and severe). A total of 483 COVID-19 CT image slices—267 mild, 156 moderate and 60 severe—were used in the study. These images and labels were used directly for three-class classification. In two-class classification, mild and moderate images were accepted as non-severe. Examples of images utilized in the study are given in Figure 1.
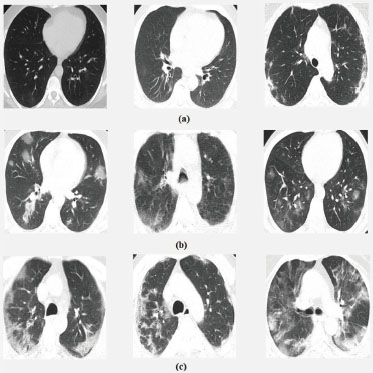
Figure 1. Examples of images classified as (a) mild, b) moderate, c) severe) in the study
The CT sets used within the scope of the study were in DICOM format. Three CT slices selected from each CT set were converted to JPG format. These CT images were then framed to include the lung region, and the portion containing the actual radiological information was obtained. After this stage, the image dimensions were arranged and recorded at eight-bit gray-level depth. A total of eight CNN architectures—MobileNetv2, ResNet101, Xception, Inceptionv3, GoogleNet, EfficientNetb0, DenseNet201, and DarkNet53—were used. There are some differences in the input image sizes of the CNN architectures used. Therefore, the CT image row and column lengths have been standardized in accordance with the CNN architecture used. Table 2 shows the dimensions to which the CT images were adjusted according to the CNN architectures. In Table 2, the first two variables in the sizes column represent the pixel values and the third variable represents the number of color spaces (gray level image since it is 1).
Table 2. Image sizes used in the study for different CNN types
CNN Type |
Sizes |
MobileNetv2 |
224 pixels × 224 pixels × 1 |
ResNet101 |
224 pixels × 224 pixels × 1 |
Xception |
299 pixels × 299 pixels × 1 |
Inceptionv3 |
299 pixels × 299 pixels × 1 |
GoogleNet |
224 pixels × 224 pixels × 1 |
EfficientNetb0 |
224 pixels × 224 pixels × 1 |
DenseNet201 |
224 pixels × 224 pixels × 1 |
DarkNet53 |
256 pixels × 256 pixels × 1 |
2.2. Convolutional Neural Network
A convolutional neural network (CNN) was utilized for the extraction and automatic classification of CT images in the study. CNN is a deep learning method widely used in the extraction and analysis of the features of images in recent years. A special CNN architecture was not designed, but some architectures, which were previously put forward and tested, were transferred. Eight CNN architectures—MobileNetv2 (Sandler et al., 2018), ResNet101 (He et al., 2016), GoogleNet (Szegedy et. al., 2015), Xception (Chollet, 2017), DenseNet201 (Huang et al., 2017), EfficientNetb0 (Tan and Le, 2019), Inceptionv3 (Szegedy et al., 2016), and DarkNet53 (Redmon, 2018)—were used in the study. The original versions of the architectures in question have thousands of outputs and perform the automatic classification of thousands of classes. Automatic classification into three-class (mild, moderate, and severe) and two-class (non-severe and severe) was carried out. Another difference is the third dimension of the entrance images. The value of the third dimension of the entrance images of these CNN architectures is three. That is, input images in RGB format were used. The CT images used within the scope of the study were gray-level. So, the value of the third dimension of the images was one. For this reason, some arrangements have been made in these CNN architectures for them to be used within the scope of the study. The first arrangement made in this context was to change the CNN-input image dimensions, as shown in Table 2. The second was to make changes in the last layers of the CNN architectures so that the output class was two and three.
The software was created on the Matlab 2020 (b) platform. The software was run using an Intel (R) Xeon (R) E-2274G 4.00 GHz CPU with 16 GB of RAM, and CPU runtimes were also measured. CNN architectures were transferred within the scope of the study and later, the necessary changes were made. However, the transfer process was limited only to the transfer of the CNN architecture. No transfer was performed for the training of starting weights. All CNN training processes were initiated with starting weights randomly assigned by the Matlab platform. 10-fold cross-validation was used in experiments in the study. At this stage, we focused on the inclusion of three image slices taken from the same CT acquisition set together in the training or test set. In other words, it is not possible to have an image slice taken from the same CT acquisition set in the training set while another image slice is in the test set.
To avoid overfitting during the training process, the initial learning rate was set to be 0.01. In addition, the training set was mixed in each iteration during the training. For this, the option for data shuffling in Matlab’s 2020 (b) training options was determined to be every-epoch. The solver for training network, maximum number of epochs and the size of mini-batch options used in the training processes were determined as stochastic gradient descent with momentum (SGDM), 30 and 16, respectively. Apart from this, no additional arrangements were made in the training options; they were left as default.
2.3. Pipeline Algorithm
The pipeline algorithm used in the study has two inputs. In the said algorithm, a new result is obtained by combining the numerical average of the inputs (50%-50%). For example, suppose that the probabilities of being mild, moderate, and severe for an image were obtained as 0.16, 0.60, and 0.24, using the first CNN architecture, and 0.70, 0.14, and 0.16, using the second CNN architecture. When combining using the pipeline algorithm, the pipeline result would be 0.43, 0.37, and 0.20. Similar to the three-class classification, it is possible to combine the two-class classification. For example, suppose that the probabilities of being non-severe and severe for an image were 0.56 and 0.44, using the first CNN architecture and 0.74 and 0.26, using the second CNN architecture. When combining using the pipeline algorithm, the pipeline result would be 0.65 and 0.35. The working structure of the pipeline algorithm was visualized in Figure 2. Yasar and Ceylan have used the pipeline algorithm mentioned above, in their studies (Yasar and Ceylan, 2021a; Yasar and Ceylan, 2021b) for diagnosing COVID-19 disease from CT and X-ray images.
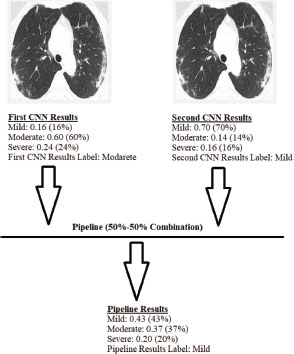
Figure 2. Working structure of the pipeline algorithm
2.4. Evaluation Criteria of Classification Results
Many comparison parameters were used to evaluate the results obtained in the study. The most basic of these parameters were the confusion-matrix results. The true positive (TrPs), false positive (FlPs), true negative (TrNg), and false negative (FlNg) results obtained in all classification experiments were given in the study. Sensitivity (SNST), specificity (SPCF), accuracy (ACCR), and F-1 score (F-1) were calculated using the results of the confusion matrix. The formulas for the mathematical calculation of SNTS, SPCF, ACCR, and F-1 are included in equations (1–4).
Similarly, these parameters are found in two and multi-class classification operations. However, in multi-class classification, unlike two-class classification, these parameters are calculated separately for each class label. In multi-class classification, weighted SNST, SPCF, ACCR, and F-1 values can be calculated by weighting according to the number of images used in the class labels. Additionally, overall ACCR can be found by dividing the sum of correctly classified samples by the total number of test samples. Another comparison parameter used in the study is receiver operating characteristic curve (ROC) analysis and AUC values. In the multi-class classification process, the weighted AUC values were calculated in a similar way to the other calculated parameters.
3. Results
In the study, an automatic COVID-19 severity classification was performed in three-class (mild, moderate, and severe) and two-class (non-severe and severe). A total of eight CNN architectures were classified. These CNN architectures were MobileNetv2, ResNet101, Xception, Inceptionv3, GoogleNet, EfficientNetb0, DenseNet201, and DarkNet53. Table 3 shows the experimental results obtained by using these CNN architectures for three-class classification. Table 4 contains the experimental results obtained for two-class classification. Table 5 presents the acquisition times per image in CPU time, including training and testing for two-class and three-class classification. While evaluating these herds with other studies, the software platform (Matlab 2020 (b)), training-test approach (10-fold cross-validation), and training options should be considered.
Table 3. Comparison of COVID-19 severity classification results obtained using CT image slices for three-class classification (mild, moderate, and severe) before using the pipeline algorithm
CNN Architecture |
Class |
TrPs |
FlNg |
TrNg |
FlPs |
SNST |
SPCF |
ACCR |
F-1 |
AUC |
Overall ACCR |
MobileNetv2 |
Mild |
224 |
43 |
156 |
60 |
0.8390 |
0.7222 |
0.7867 |
0.8131 |
0.8706 |
0.7039 |
Moderate |
75 |
81 |
265 |
62 |
0.4808 |
0.8104 |
0.7039 |
0.5119 |
0.7478 |
||
Severe |
41 |
19 |
402 |
21 |
0.6833 |
0.9504 |
0.9172 |
0.6721 |
0.9472 |
||
Overall (weighted) |
0.7039 |
0.7790 |
0.7762 |
0.6983 |
0.8405 |
||||||
ResNet101 |
Mild |
213 |
54 |
168 |
48 |
0.7978 |
0.7778 |
0.7888 |
0.8068 |
0.8681 |
0.7329 |
Moderate |
98 |
58 |
256 |
71 |
0.6282 |
0.7829 |
0.7329 |
0.6031 |
0.7779 |
||
Severe |
43 |
17 |
413 |
10 |
0.7167 |
0.9764 |
0.9441 |
0.7611 |
0.9714 |
||
Overall (weighted) |
0.7329 |
0.8041 |
0.7901 |
0.7353 |
0.8518 |
||||||
Xception |
Mild |
235 |
32 |
150 |
66 |
0.8801 |
0.6944 |
0.7971 |
0.8275 |
0.8981 |
0.7267 |
Moderate |
70 |
86 |
283 |
44 |
0.4487 |
0.8654 |
0.7308 |
0.5185 |
0.7871 |
||
Severe |
46 |
14 |
401 |
22 |
0.7667 |
0.9480 |
0.9255 |
0.7188 |
0.9508 |
||
Overall (weighted) |
0.7267 |
0.7812 |
0.7916 |
0.7142 |
0.8688 |
||||||
Inceptionv3 |
Mild |
234 |
33 |
169 |
47 |
0.8764 |
0.7824 |
0.8344 |
0.8540 |
0.9301 |
0.7785 |
Moderate |
97 |
59 |
279 |
48 |
0.6218 |
0.8532 |
0.7785 |
0.6445 |
0.8573 |
||
Severe |
45 |
15 |
411 |
12 |
0.7500 |
0.9716 |
0.9441 |
0.7692 |
0.9673 |
||
Overall (weighted) |
0.7785 |
0.8288 |
0.8299 |
0.7758 |
0.9112 |
||||||
GoogleNet |
Mild |
225 |
42 |
128 |
88 |
0.8427 |
0.5926 |
0.7308 |
0.7759 |
0.8044 |
0.6315 |
Moderate |
46 |
110 |
261 |
66 |
0.2949 |
0.7982 |
0.6356 |
0.3433 |
0.6278 |
||
Severe |
34 |
26 |
399 |
24 |
0.5667 |
0.9433 |
0.8965 |
0.5763 |
0.9072 |
||
Overall (weighted) |
0.6315 |
0.7026 |
0.7207 |
0.6114 |
0.7602 |
||||||
EfficientNetb0 |
Mild |
223 |
44 |
157 |
59 |
0.8352 |
0.7269 |
0.7867 |
0.8124 |
0.8559 |
0.6977 |
Moderate |
72 |
84 |
269 |
58 |
0.4615 |
0.8226 |
0.7060 |
0.5035 |
0.7357 |
||
Severe |
42 |
18 |
394 |
29 |
0.7000 |
0.9314 |
0.9027 |
0.6412 |
0.9475 |
||
Overall (weighted) |
0.6977 |
0.7832 |
0.7751 |
0.6914 |
0.8285 |
||||||
DenseNet201 |
Mild |
228 |
39 |
157 |
59 |
0.8539 |
0.7269 |
0.7971 |
0.8231 |
0.8967 |
0.7308 |
Moderate |
88 |
68 |
265 |
62 |
0.5641 |
0.8104 |
0.7308 |
0.5752 |
0.8014 |
||
Severe |
37 |
23 |
414 |
9 |
0.6167 |
0.9787 |
0.9337 |
0.6981 |
0.9571 |
||
Overall (weighted) |
0.7308 |
0.7851 |
0.7927 |
0.7275 |
0.8734 |
||||||
DarkNet53 |
Mild |
218 |
49 |
176 |
40 |
0.8165 |
0.8148 |
0.8157 |
0.8305 |
0.8909 |
0.7702 |
Moderate |
108 |
48 |
267 |
60 |
0.6923 |
0.8165 |
0.7764 |
0.6667 |
0.8151 |
||
Severe |
46 |
14 |
412 |
11 |
0.7667 |
0.9740 |
0.9482 |
0.7863 |
0.9571 |
||
Overall (weighted) |
0.7702 |
0.8351 |
0.8195 |
0.7721 |
0.8746 |
||||||
Table 4. Comparison of COVID-19 severity classification results obtained using CT image slices for two-class classification (non-severe and severe) before using the pipeline algorithm
CNN Architecture |
TrPs |
FlNg |
TrNg |
FlPs |
SNST |
SPCF |
ACCR |
F-1 |
AUC |
MobileNetv2 |
409 |
14 |
49 |
11 |
0.9669 |
0.8167 |
0.9482 |
0.9703 |
0.9744 |
ResNet101 |
402 |
21 |
50 |
10 |
0.9504 |
0.8333 |
0.9358 |
0.9629 |
0.9781 |
Xception |
411 |
12 |
45 |
15 |
0.9716 |
0.7500 |
0.9441 |
0.9682 |
0.9715 |
Inceptionv3 |
406 |
17 |
51 |
9 |
0.9598 |
0.8500 |
0.9462 |
0.9690 |
0.9788 |
GoogleNet |
392 |
31 |
29 |
31 |
0.9267 |
0.4833 |
0.8716 |
0.9267 |
0.8661 |
EfficientNetb0 |
412 |
11 |
38 |
22 |
0.9740 |
0.6333 |
0.9317 |
0.9615 |
0.9620 |
DenseNet201 |
410 |
13 |
45 |
15 |
0.9693 |
0.7500 |
0.9420 |
0.9670 |
0.9734 |
DarkNet53 |
404 |
19 |
49 |
11 |
0.9551 |
0.8167 |
0.9379 |
0.9642 |
0.9634 |
Table 5. Comparison of run time (CPU time/second) for two-class and three-class classification before using the pipeline algorithm
CNN Architecture |
Three-class Classification |
Two-class Classification |
MobileNetv2 |
5.2469 |
5.2425 |
ResNet101 |
13.9730 |
14.0405 |
Xception |
8.9762 |
9.0075 |
Inceptionv3 |
14.0511 |
13.4820 |
GoogleNet |
3.3325 |
2.8096 |
EfficientNetb0 |
17.5531 |
15.9924 |
DenseNet201 |
35.4577 |
34.7756 |
DarkNet53 |
11.6518 |
11.6380 |
Upon examining Table 3, which includes three-class classification results—mild, moderate, and severe—it is clear that the most successful four CNN architectures are Inceptionv3, DarkNet53, ResNet101, and DenseNet201, respectively. In the study, the classification results obtained by combining the most successful CNN results for the three-class classification using the pipeline algorithm are given in Table 6. Upon examining Table 4, which includes the classification results of two-class, non-severe and severe, it is clear that the most successful four CNN architectures are MobileNetv2, Inceptionv3, Xceptionv3, and DenseNet201, respectively. In the study, the classification results obtained by combining the most successful CNN results for the two-class classification using the pipeline algorithm are given in Table 7.
Table 6. Comparison of COVID-19 severity classification results obtained using CT image slices for three-class classification (mild, moderate, and severe) after using the pipeline algorithm
CNN Architecture |
Class |
TrPs |
FlNg |
TrNg |
FlPs |
SNST |
SPCF |
ACCR |
F-1 |
AUC |
Overall ACCR |
Inceptionv3-DarkNet53 |
Mild |
240 |
27 |
177 |
39 |
0.8989 |
0.8194 |
0.8634 |
0.8791 |
0.9212 |
0.8095 |
Moderate |
106 |
50 |
285 |
42 |
0.6795 |
0.8716 |
0.8095 |
0.6974 |
0.8574 |
||
Severe |
45 |
15 |
412 |
11 |
0.7500 |
0.9740 |
0.9462 |
0.7759 |
0.9782 |
||
Overall (weighted) |
0.8095 |
0.8555 |
0.8563 |
0.8076 |
0.9077 |
||||||
Inceptionv3-ResNet101 |
Mild |
240 |
27 |
170 |
46 |
0.8989 |
0.7870 |
0.8489 |
0.8680 |
0.9253 |
0.7971 |
Moderate |
101 |
55 |
284 |
43 |
0.6474 |
0.8685 |
0.7971 |
0.6733 |
0.8538 |
||
Severe |
44 |
16 |
414 |
9 |
0.7333 |
0.9787 |
0.9482 |
0.7788 |
0.9786 |
||
Overall (weighted) |
0.7971 |
0.8372 |
0.8445 |
0.7940 |
0.9089 |
||||||
Inceptionv3- DenseNet201 |
Mild |
234 |
33 |
167 |
49 |
0.8764 |
0.7731 |
0.8302 |
0.8509 |
0.9252 |
0.7764 |
Moderate |
97 |
59 |
278 |
49 |
0.6218 |
0.8502 |
0.7764 |
0.6424 |
0.8472 |
||
Severe |
44 |
16 |
413 |
10 |
0.7333 |
0.9764 |
0.9462 |
0.7719 |
0.9712 |
||
Overall (weighted) |
0.7764 |
0.8233 |
0.8272 |
0.7737 |
0.9057 |
||||||
Darknet53-ResNet101 |
Mild |
223 |
44 |
167 |
49 |
0.8352 |
0.7731 |
0.8075 |
0.8275 |
0.9105 |
0.7598 |
Moderate |
100 |
56 |
267 |
60 |
0.6410 |
0.8165 |
0.7598 |
0.6329 |
0.8414 |
||
Severe |
44 |
16 |
416 |
7 |
0.7333 |
0.9835 |
0.9524 |
0.7928 |
0.9802 |
||
Overall (weighted) |
0.7598 |
0.8133 |
0.8101 |
0.7603 |
0.8968 |
||||||
DarkNet53- DenseNet201 |
Mild |
231 |
36 |
164 |
52 |
0.8652 |
0.7593 |
0.8178 |
0.8400 |
0.9067 |
0.7660 |
Moderate |
97 |
59 |
273 |
54 |
0.6218 |
0.8349 |
0.7660 |
0.6319 |
0.8302 |
||
Severe |
42 |
18 |
416 |
7 |
0.7000 |
0.9835 |
0.9482 |
0.7706 |
0.9785 |
||
Overall (weighted) |
0.7660 |
0.8115 |
0.8173 |
0.7642 |
0.8909 |
||||||
ResNet101- DenseNet201 |
Mild |
232 |
35 |
162 |
54 |
0.8689 |
0.7500 |
0.8157 |
0.8391 |
0.9000 |
0.7619 |
Moderate |
94 |
62 |
274 |
53 |
0.6026 |
0.8379 |
0.7619 |
0.6205 |
0.8086 |
||
Severe |
42 |
18 |
415 |
8 |
0.7000 |
0.9811 |
0.9462 |
0.7636 |
0.9800 |
||
Overall (weighted) |
0.7619 |
0.8071 |
0.8146 |
0.7591 |
0.8804 |
||||||
Table 7. Comparison of COVID-19 severity classification results obtained using CT image slices for two-class classification (non-severe and severe) after using the pipeline algorithm
CNN Architecture |
TrPs |
FlNg |
TrNg |
FlPs |
SNST |
SPCF |
ACCR |
F-1 |
AUC |
MobileNetv2-Inceptionv3 |
415 |
8 |
50 |
10 |
0.9811 |
0.8333 |
0.9627 |
0.9788 |
0.9851 |
MobileNetv2-Xception |
412 |
11 |
47 |
13 |
0.9740 |
0.7833 |
0.9503 |
0.9717 |
0.9790 |
MobileNetv2- DenseNet201 |
412 |
11 |
47 |
13 |
0.9740 |
0.7833 |
0.9503 |
0.9717 |
0.9797 |
Inceptionv3-Xception |
411 |
12 |
49 |
11 |
0.9716 |
0.8167 |
0.9524 |
0.9728 |
0.9776 |
Inceptionv3-DenseNet201 |
412 |
11 |
49 |
11 |
0.9740 |
0.8167 |
0.9545 |
0.9740 |
0.9816 |
Xception-DenseNet201 |
411 |
12 |
45 |
15 |
0.9716 |
0.7500 |
0.9441 |
0.9682 |
0.9765 |
4. Discussion
In the study, the experimental results obtained for two-class and three-class classification using CT image slices are shown in Tables 3 and 4, respectively. Similarly, the results following the application of the pipeline algorithm are shown in Table 6 and Table 7. In this section, the presented results are compared.
Upon examining Table 3, which includes three-class classification results—mild, moderate, and severe—it is clear that the most successful four CNN architectures are Inceptionv3, DarkNet53, ResNet101, and DenseNet201, respectively. The highest weighted SNST, ACCR, F-1, AUC, and overall ACCR values were obtained using Inceptionv3 architecture: 0.7785, 0.8299, 0.7758, 0.9112, and 0.7785, respectively. The highest weighted SPCF value, 0.8351, was obtained by using the DarkNet53 architecture. The ROC analysis curve obtained using Inceptionv3 is included in Figure 3(a). When the four most successful CNN architectures are compared in terms of classification times, including training test per image, the order is DarkNet53, ResNet101, Inceptionv3, and DenseNet201, from fastest to slowest.
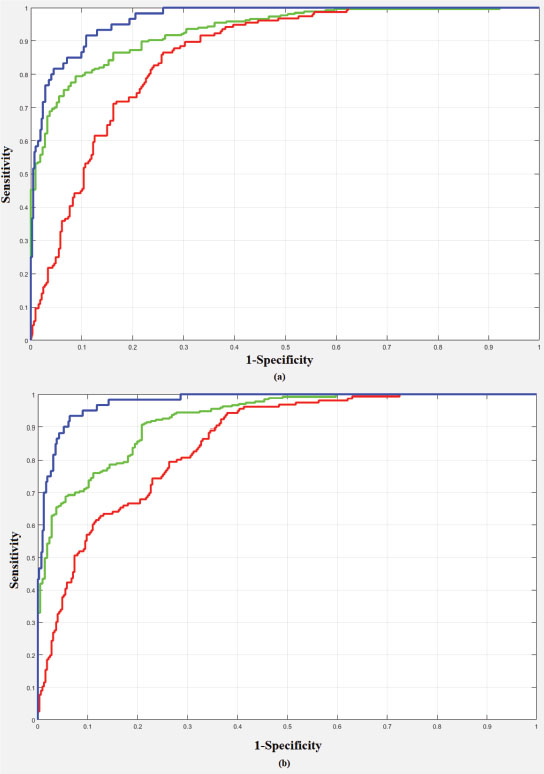
Figure 3. ROC curve for three-class classification (green line: mild class; red line: moderate class; blue line: severe class) a) using Inceptionv3 b) Inceptionv3-ResNet101 pipeline combination
Upon examining Table 4, which includes the classification results of two-class, non-severe and severe, it is clear that the most successful four CNN architectures are MobileNetv2, Inceptionv3, Xceptionv3, and DenseNet201, respectively. The highest SNST value obtained was 0.9740 using the EfficientNetb0 architecture. The highest SPCF and AUC values, obtained using Inceptionv3, were 0.8500 and 0.9788, respectively. The highest ACCR and F-1 values, 0.9482 and 0.9703, respectively, were obtained using MobileNetv2. The ROC analysis curve was obtained using the Inceptionv3 architecture, which provides the highest AUC value within the scope of the study, as shown in Figure 4(a). When the four most successful CNN architectures are compared, in terms of classification times, including training-test per image, the order is MobileNetv2, Xceptionv3, Inceptionv3, and DenseNet201, from fastest to slowest.
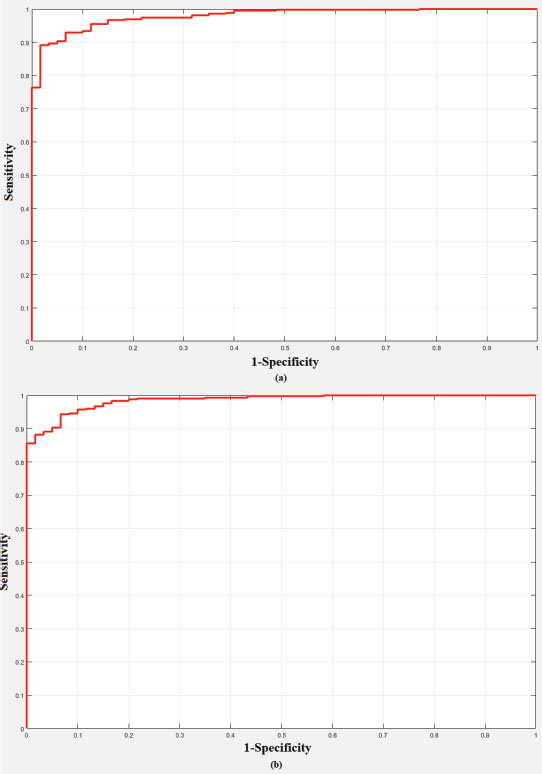
Figure 4. ROC curve for two-class classification a) using Inceptionv3 b) MobileNetv2-Inceptionv3 pipeline combination
The classification results obtained by combining the most successful CNN results for the three-class classification using the pipeline algorithm are given in Table 6. Upon examining Table 6, which includes three-class classification results—mild, moderate, and severe—it is clear that the most successful two pipeline combinations are Inceptionv3-DarkNet53, Inceptionv3-ResNet101, respectively. The highest weighted SNST, SPCF, ACCR, F-1, and overall ACCR values were obtained using the Inceptionv3-DarkNet53 pipeline combination: 0.8095, 0.8555, 0.8563, 0.8076, and 0.8096, respectively. The highest weighted AUC value, 0.9089, was obtained by using the Inceptionv3-ResNet101 pipeline combination. The ROC analysis curve obtained using Inceptionv3-ResNet101 pipeline combination is included in Figure 3(b).
The classification results obtained by combining the most successful CNN results for the two-class classification using the pipeline algorithm are given in Table 7. Upon examining Table 7, which includes the classification results of two-class, non-severe and severe, it is clear that the most successful pipeline combination is MobileNetv2-Inceptionv3. The highest SNST, SPCF, ACCR, F-1, AUC, and overall ACCR values were obtained using MobileNetv2-Inceptionv3 pipeline combination: 0.9811, 0.8333, 0.9627, 0.9788, and 0.9851, respectively. The ROC analysis curve obtained using the MobileNetv2-Inceptionv3 pipeline combination is included in Figure 4(b).
5. Conclusion
In the study, an automatic classification of COVID-19 pneumonia severity in three and two classes, namely mild, moderate, severe, and non-severe, was carried out. A total of eight architectures were used for automatic classification, namely MobileNetv2, ResNet101, Xception, Inceptionv3, GoogleNet, EfficientNetb0, DenseNet201, and DarkNet53. CT images were used as radiological images.
A total of 483 COVID-19 CT image slices—267 mild, 156 moderate, and 60 severe—were used in the study. These images and labels were used directly for the three-class classification. In the two-class classification, mild and moderate images were accepted as non-severe. Comprehensive results were obtained with the experiments performed according to the 10-fold cross-validation approach. Also, in the study, the results of the top four CNN architectures with the best performance were combined using a pipeline algorithm.
The comparison of the results obtained for the three-class classification of COVID-19 pneumonia severity as well as the results obtained in previous studies are presented in Table 8. It is understood that higher results were obtained than in Carvalho et al.’s (2020) study, in which the same class labels were used. The comparison of the results obtained for the two-class classification of COVID-19 pneumonia severity as well as those obtained in previous studies are presented in Table 9. It is understood that higher results were obtained than in the studies of Li et al. (2020a), Xiao et al. (2020), and Li et al. (2020b), in which the same class labels were used. However, the results were lower than those obtained by Yu et al. (2020). The CNN architectures used by Yu et al. (2020) were included in our study, and their highest results were obtained by using the DenseNet-201 architecture. In our study, DenseNet-201 was also used in the classification, and higher results were obtained with other CNN architectures. Therefore, it can be said that our results are more successful than those of Yu et al. (2020), although numerically lower.
Table 8. Comparison of our results with those obtained in previous studies for three-class (mild, moderate, and severe) classification
Study |
Number of Classes |
No. of Images |
Methods |
Test Methods |
Results |
3 Classes (Mild, Moderate and, Severe) |
1,000 ROIs images |
Computer-Aided Diagnosis |
Train: 700 ROIs, Validation: 150 and, Test: 150 |
0.80 (SNST), 0.86 (SPCF), 0.82 (ACCR),0.85 (F-1), 0.90 (AUC) |
|
3 Classes (Normal, Slight and, Severe) |
416 images (207 Normal, 194 Slight and, 15 Severe) |
Convolutional Neural Network (Fast assessment network (FaNet)) |
Train: 300 images and Test: 116 images |
0.9483 (ACCR) |
|
Our Study (Before Pipeline) |
3 Classes (Mild, Moderate and, Severe) |
483 images (267 Mild, 156 Moderate and, 60 Severe) |
Convolutional Neural Network (MobileNetv2, ResNet101, Xception, Inceptionv3, GoogleNet, EfficientNetb0, DenseNet201, DarkNet53) |
10-fold |
0.7785 (SNST), 0.8351 (SPCF), 0.8299 (ACCR), 0.7758 (F-1), 0.9112 (AUC), 0.7785 (Overall-ACCR) |
Our Study (After Pipeline) |
3 Classes (Mild, Moderate and, Severe) |
483 images (267 Mild, 156 Moderate and, 60 Severe) |
Convolutional Neural Network and Pipeline Algorithm |
10-fold |
0.8095 (SNST), 0.8555 (SPCF), 0.8563 (ACCR), 0.8076 (F-1), 0.9089 (AUC), 0.8095 (Overall-ACCR) |
Table 9. Comparison of our results with those obtained in previous studies for two-class (non-severe and severe) classification
Study |
Number of Classes |
No. of Images |
Methods |
Test Methods |
Results |
2 Classes (Severe and Critical) |
217 images (82 Severe and, 135 Critical) |
Radiomic Features Model, Deep Learning Model and, Merged Model |
80% Train-20% Test (Train: 174 images, Test: 43 images) |
0.750-0.875 (SNST), 0.741-0.778 (SPCF), 0.744-0.814 (ACCR), 0.787-0.861 (AUC) |
|
2 Classes (Non-Severe and Severe) |
408 images |
Convolutional Neural Network (ResNet34, AlexNet, VGGNet and, DenseNet) |
Train: 303 images and Test: 105 images |
0.819 (ACCR), 0.892 (AUC) |
|
2 Classes (Non-Severe and Severe) |
531 images (436 Non-Severe and 95 Severe) |
Convolutional Neural Network (Unet and ResNet34) |
Unspecified |
0.9241 (SNST), 0. 9049 (SPCF), 0.97 (AUC) |
|
2 Classes (Non-Severe and Severe) |
729 images (483 Non-Severe and 246 Severe) |
Pre-trained Convolutional Neural Network |
Holdout, 10-fold and, Leave-one-out |
0.9187 (SNST), 0.9687 (SPCF), 0.9520 (ACCR), 0.99 (AUC) |
|
2 Classes (Severe and Critical) |
366 images (256 Severe and, 110 Critical) |
Convolutional Neural Network (De-COVID19-Net) |
Train: 246 images and Test: 120 images |
0.917-1.000 (SNST), 0.802-0.864 (SPCF), 0.842-0.875 (ACCR), 0.943 (AUC) |
|
2 Classes (Low Risk and High Risk) |
297 images |
3D Convolutional Neural Network |
5-fold |
0.694-0.783 (SNST), 0.927-0.965 (SPCF), 0.916-0.933 (ACCR), 0.814-0.900 (AUC) |
|
2 Classes (Non-Severe and Severe) |
408 images (322 Non-Severe and 86 Severe) |
Regression, Optimization, Convergence Analysis |
5-fold |
0.7697 (SNST), 0.8802 (SPCF), 0.8569 (ACCR), 0.8591 (AUC) |
|
Our Study (Before Pipeline) |
2 Classes (Non-Severe and Severe) |
483 images (423 Non-Severe and 60 Severe) |
Convolutional Neural Network (MobileNetv2, ResNet101, Xception, Inceptionv3, GoogleNet, EfficientNetb0, DenseNet201, DarkNet53) |
10-fold |
0.9740 (SNST), 0.8500 (SPCF), 0.9482 (ACCR), 0.9703 (F-1), 0.9788 (AUC) |
Our Study (After Pipeline) |
2 Classes (Non-Severe and Severe) |
483 images (423 Non-Severe and 60 Severe) |
Convolutional Neural Network and Pipeline Algorithm |
10-fold |
0.9811 (SNST), 0.8333 (SPCF), 0.9627 (ACCR), 0.9788 (F-1), 0.9851 (AUC) |
Another conclusion obtained within the scope of the study is that the study results can be increased significantly by using the pipeline algorithm. For example, when the results obtained for the three-class classification of COVID-19 pneumonia severity before and after using the pipeline algorithm are examined, it is seen that the weighted results were improved by 3% thanks to the pipeline algorithm. Similarly, when the results obtained for the two-class classification of COVID-19 pneumonia severity are examined, it is understood that improvements at the level of 1% have been achieved. In this context, it is seen that the approach of using the pipeline algorithm, which has produced successful results (Yasar and Ceylan, 2021a; Yasar and Ceylan, 2021b) in the studies of automatic diagnosis of COVID-19 disease from X-ray and CT images, has also increased the results for COVID-19 pneumonia severity classification.
Future studies should aim to use different CNN architectures, especially complex-valued ones. In addition, we plan to diversify the images used with image-feature-extraction methods. Also, the proposed method is planned to be transformed directly and in real time into a diagnosis-decision support system that classifies patients with severe COVID-19 pneumonia.
6. Acknowledgements
Conflicts of interest
The authors declare no conflicts of interest.
Ethics Committee Statement
Ethics committee decision dated 27.07.2020 and numbered 220/327 was taken from Selcuk University Medical Faculty Hospital for conducting the study and collecting data.
7. References
Calina, D., Docea, A. O., Petrakis, D., Egorov, A. M., Ishmukhametov, A. A., Gabibov, A. G., & Tsatsakis, A. (2020). Towards effective COVID-19 vaccines: Updates, perspectives and challenges. International journal of molecular medicine, 46(1), 3–16. https://doi.org/10.3892/ijmm.2020.4596
Carvalho, A. R. S., Guimarães, A., Werberich, G. M., de Castro, S. N., Pinto, J. S. F., Schmitt, W. R., & Rodrigues, R. S. (2020). COVID-19 chest computed tomography to stratify severity and disease extension by artificial neural network computer-aided diagnosis. Frontiers in Medicine, 7, 577609. https://doi.org/10.3389/fmed.2020.577609
Chollet, F. (2017). Xception: Deep learning with depthwise separable convolutions. IEEE conference on computer vision and pattern recognition (CVPR), pp. 1251–1258. IEEE. https://doi.org/10.1109/CVPR.2017.195
He, K., Zhang, X., Ren, S., & Sun, J. (2016). Deep residual learning for image recognition. IEEE conference on computer vision and pattern recognition (CVPR), pp. 770–778. IEEE. https://doi.org/10.1109/CVPR.2016.90
Ho, T., Park, J., Kim, T., Park, B., Lee, J., Kim, J. Y., & Choi, S. (2021). Deep learning models for predicting severe progression in COVID-19-infected patients: Retrospective study. JMIR medical informatics, 9(1), e24973. https://doi.org/10.2196/24973
Huang, C., Wang, Y., Li, X., Ren, L., Zhao, J., Hu, Y., & Cao, B., (2020). Clinical features of patients infected with 2019 novel coronavirus in Wuhan, China. The lancet, 395(10223), 497–506. https://doi.org/10.1109/CVPR.2017.243
Huang, G., Liu, Z., Van Der Maaten, L., & Weinberger, K. Q. (2017). Densely connected convolutional networks. IEEE Conference on Computer Vision and Pattern Recognition (CVPR), 4700–4708. IEEE. https://doi.org/10.1109/CVPR.2017.243
Huang, Z., Liu, X., Wang, R. Zhang, M., Zeng, X., Liu, J., & Hu, Z. (2021). FaNet: fast assessment network for the novel coronavirus (COVID-19) pneumonia based on 3D CT imaging and clinical symptoms. Applied Intelligence, 51(5), 2838–2849. https://doi.org/10.1007/s10489-020-01965-0
Li, C., Dong, D., Li, L., Gong, W., Li, X., Bai, Y., & Tian, J. (2020a). Classification of severe and critical covid-19 using deep learning and radiomics. IEEE journal of biomedical and health informatics, 24(12), 3585–3594. https://doi.org/10.1109/JBHI.2020.3036722
Li, Z., Zhong, Z., Li, Y., Zhang, T., Gao, L., Jin, D., & Tang, Y. (2020b). From community-acquired pneumonia to COVID-19: a deep learning–based method for quantitative analysis of COVID-19 on thick-section CT scans. European radiology, 30(12), 6828–6837. https://doi.org/10.1007/s00330-020-07042-x
Lin, L., Fu, G., Chen, S., Tao, J., Qian, A., Yang, Y., & Wang, M. (2021). CT manifestations of coronavirus disease (COVID-19) pneumonia and influenza virus pneumonia: A comparative study. American Journal of Roentgenology, 216(1), 71–79. https://doi.org/10.2214/AJR.20.23304
Meng, L., Dong, D., Li, L., Niu, M., Bai, Y., Wang, M., & Tian, J. (2020). A deep learning prognosis model help alert for COVID-19 patients at high-risk of death: a multi-center study. IEEE journal of biomedical and health informatics, 24(12), 3576–3584. https://doi.org/10.1109/JBHI.2020.3034296
Pianura, E., Di Stefano, F., Cristofaro, M., Petrone, A., Fusco, N., Albarello, F., & Schininà, V. (2020). Coronavirus-HKU1 Pneumonia and Differential Diagnosis with COVID-19. Radiology: Cardiothoracic Imaging, 2(2), e200162. https://doi.org/10.1148/ryct.2020200162
Pontone, G., Scafuri, S., Mancini, M. E., Agalbato, C., Guglielmo, M., Baggiano, A., & Rossi, A. (2021). Role of computed tomography in COVID-19. Journal of cardiovascular computed tomography, 15(1), 27–36. https://doi.org/10.1016/j.jcct.2020.08.013
Redmon, J. (2018). Darknet: Open Source Neural Networks in C; 2016. http://pjreddie.com/darknet.
Sandler, M., Howard, A., Zhu, M., Zhmoginov, A., & Chen, L. C. (2018). Mobilenetv2: Inverted residuals and linear bottlenecks. IEEE conference on computer vision and pattern recognition, 4510–4520. IEEE. https://doi.org/10.1109/CVPR.2018.00474
Szegedy, C., Liu, W., Jia, Y., Sermanet, P., Reed, S., Anguelov, D., & Rabinovich, A. (2015). Going deeper with convolutions. IEEE conference on computer vision and pattern recognition, 1–9. IEEE. https://doi.org/10.1109/CVPR.2015.7298594
Szegedy, C., Vanhoucke, V., Ioffe, S., Shlens, J., & Wojna, Z. (2016). Rethinking the inception architecture for computer vision. IEEE conference on computer vision and pattern recognition, 2818–2826. IEEE. https://doi.org/10.1109/CVPR.2016.308
Tan, M., & Le, Q. (2019). Efficientnet: Rethinking model scaling for convolutional neural networks. In International conference on machine learning, 6105–6114. PMLR.
Wong, M. D., Thai, T., Li, Y., & Liu, H. (2020). The role of chest computed tomography in the management of COVID-19: A review of results and recommendations. Experimental Biology and Medicine, 245(13), 1096–1103. https://doi.org/10.1177/1535370220938315
World Health Organization (WHO). (2022a). World experts and funders set priorities for COVID-19 research. https://www.who.int/newsroom/.
World Health Organization (WHO). (2022b). WHO Coronavirus (COVID-19) Dashboard. https://covid19.who.int/.
World Health Organization (WHO). (2022c). COVID-19 vaccines. https://www.who.int/emergencies/diseases/novel-coronavirus-2019/covid-19-vaccines.
Xiao, L. S., Li, P., Sun, F., Zhang, Y., Xu, C., Zhu, H., & Zhu, H. (2020). Development and validation of a deep learning-based model using computed tomography imaging for predicting disease severity of coronavirus disease 2019. Frontiers in bioengineering and biotechnology, (8), 898. https://doi.org/10.3389/fbioe.2020.00898
Yasar, H., & Ceylan, M. (2021a). A new deep learning pipeline to detect Covid-19 on chest X-ray images using local binary pattern, dual tree complex wavelet transform and convolutional neural networks. Applied Intelligence, 51(5), 2740–2763. https://doi.org/10.1007/s10489-020-02019-1
Yasar, H., & Ceylan, M. (2021b). Deep Learning–Based Approaches to Improve Classification Parameters for Diagnosing COVID-19 from CT Images. Cognitive Computation, 1–28. https://doi.org/10.1007/s12559-021-09915-9
Yu, Z., Li, X., Sun, H., Wang, J., Zhao, T., Chen, H., & Xie, Z. (2020). Rapid identification of COVID-19 severity in CT scans through classification of deep features. BioMedical Engineering OnLine, 19(1), 1–13.
Zhao, D., Zheng, F. Y. L. W. L., Guo, Y. G. J. Y. F., & Gao, H. Z. R. (2020). Comparative study on the clinical features of COVID-19 pneumonia to other pneumonias. Clinical Infectious Diseases, 71(15), 756–761.
Zhu, X., Song, B., Shi, F., Chen, Y., Hu, R., Gan, J., & Shen, D. (2021). Joint prediction and time estimation of COVID-19 developing severe symptoms using chest CT scan. Medical image analysis, 67, 101824.