
Regular Issue, Vol. 11 N. 1 (2022), 65-80
eISSN: 2255-2863
DOI: https://doi.org/10.14201/adcaij.27896
|
ADCAIJ: Advances in Distributed Computing and Artificial Intelligence Journal
Regular Issue, Vol. 11 N. 1 (2022), 65-80 eISSN: 2255-2863 DOI: https://doi.org/10.14201/adcaij.27896 |
Prosumers Flexibility as Support for Ancillary Services in Low Voltage Level
Ricardo Faiaa, Tiago Pintoa, Fernando Lezamaa, Zita Valeb, Juan Manuel Corchadoc,d and Alfonso González-Brionesc,d,e
a GECAD Research Group, Polytechnic of Porto (ISEP/IPP) Portugal
b Polytechnic of Porto (ISEP/IPP), Portugal
c BISITE Research Group, University of Salamanca (USAL), Spain
d Air Institute, IoT Digital Innovation Hub, Spain
e GRASIA Research Group, Complutense University of Madrid (UCM), Spain rfmfa@isep.ipp.pt, tcp@isep.ipp.pt, flz@isep.ipp.pt, zav@isep.ipp.pt, corchado@usal.es, alfonsogb@ucm.es
ABSTRACT
The prosumers flexibility procurement has increased due to the current penetration of distributed and variable renewable energy sources. The prosumers flexibility is often able to quickly adjust the power consumption, making it well suited as a primary and secondary reserve for ancillary services. In the era of smart grids, the role of the aggregator has been increasingly exploited and considered as a player that can facilitate small prosumers’ participation in electricity markets. This paper proposes an approach based on the use of prosumers flexibility by an aggregator to support ancillary services at a low voltage level. An asymmetric pool market approach is considered for flexibility negotiation between prosumers and the local marker operator (aggregator). From the achieved results it is possible to conclude that the use of flexibility can bring technical and economic benefits for network operators.
KEYWORDS
ancillary; services; flexibility; low voltage level; prosumers
1. Introduction
Ancillary services (AS), in electricity system operation, refer to services supporting the transmission of electrical power between generation and load, maintaining a satisfactory level of operational security and quality of supply. This definition is proposed by the Agency for the Cooperation of Energy Regulators (ACER) in the guidelines on electricity system operations (Gerad et al., 2018). The AS are necessary for the operation of transmission or distribution systems, including balancing and non-frequency AS, and excluding congestion management (European Union Emissions Trading Scheme, 2019). Considering the liberalization of the markets, the transmissions system operator (TSO) can contract AS from selected grid users that qualify for providing these services. The AS contracted by TSO can be divided into two types, frequency AS and non-frequency AS. Frequency AS are used for control the frequency balance of the system, whereas non-frequency AS are used for steady state voltage control, fast reactive current injections, the inertia for local grid stability, short-circuit current, black start capability and island operation capability (European Commision, 2016). The directive of reference (European Commision, 2016) proposes rules for TSO and distributed system operators (DSO) procurement of AS considering demand response providers and independent aggregators, in a non-discriminatory way.
The active power reserves and reactive power reserves are the main elements that constitute a given AS. On the other hand, these elements can be acquired from the flexibility available in the system. The flexibility available in the system has been increasing due to the penetration of distributed energy resources (DER) installed into the distribution grid. The presence of DER in the distribution grid results into new opportunities for system operators, both TSO and DSO, which might benefit from their efficient use. End-users can also benefit from the flexibility they have if they use it correctly. In reference (Faia et al., 2019), it is demonstrated the financial benefits that can be obtained from the correct use of the flexibility using equipment already installed in the household. In fact, according to the Third Energy Package directive of the European Commission, TSO and DSO will face some challenges in the acquisition of AS due to the separation between transmission and distribution systems (Hancher and Winters, 2017). Thus, the flexibility available in the distribution system may arrive from the lower level, i.e., the prosumers' houses connected in low voltage.
The acquisition of AS in distribution grids has attracted some interest recently, with some published studies around the topic. In reference (Gerad et al., 2018), the authors propose five different mechanisms of coordination between TSO and DSO for AS acquisition in the distribution grid. In all of the scenarios, the Aggregator is identified as a player for flexibility resources aggregation. Building HVAC systems, providing flexibility for secondary frequency control, are one of the options explored for AS provision presented in (Qureshi and Jones, 2018). An aggregation of domestic fridge-freezer load to support AS is proposed in (Martin Almenta et al., 2016). In this case, the authors control the operation of multiple fridge-freezers to optimize wind power integration (i.e., system load balancing). Commercial buildings can also be another source for AS, as referred in (Lymperopoulos et al., 2015). In this study, the authors focused on the Swiss AS market and an automatic Frequency Restoration Reserve (aFRR). The grid operator procures about ± 400 MW in a weekly auction for every hour of the following week from a set of pre-qualified AS providers, which can be either loads or generators. The grid operator activates the reserve in real-time operation, by sending signals in parallel to all AS providers accepted in an action market.
Table 1 presents a literature overview related to AS application. The asset column represents the AS providers. The AS product can be divided into two major categories: the Frequency Restoration Reserve (FRR) and Non-Frequency. The FRR product can have two different subcategories, the aFRR and manual FRR (mFRR). The AS type is related to the control reserve bid, e.g., Primary Control Reserve (PCR), Secondary Control Reserve (SCR) and Tertiary Control Reserve (TCR). The AS variable represents the service control for the management of the power system. For instance, FRR is used for frequency control, whereas non-frequency can be used for reactive power and harmonic compensation or spinning reserves. For AS negotiation type, the literature analyzed considers two different mechanisms based on pre-qualified action or incentives.
Table 1. AS overview in literature
Ref. |
Asset |
AS Product |
AS type |
AS variable |
AS negotiation type |
Commercial Building |
aFRR |
SCR |
Frequency |
Pre-qualified action |
|
Distributed solar batteries |
FRR |
PCR |
Frequency |
Pre-qualified action |
|
Electric Vehicles |
aFRR |
PCR, SCR, TCR |
Frequency |
Incentives |
|
DC community |
Non frequency |
|
Reactive Power |
|
|
Photovoltaic inverters |
Non frequency |
SCR |
Reactive Power, Harmonic Current compensation |
|
|
HVAC systems |
FRR |
|
Frequency |
|
|
Domestic fridge freezer |
Non frequency |
|
Spinning reserve |
Pre-qualified action |
In this paper, we propose a methodology for AS acquisition on the level of domestic prosumers. The references (Xavier et al., 2018), (Qureshi and Jones, 2018) and (Martin Almenta et al., 2016) also considered the acquisition of AS at domestic level using a specific appliance, e.g., a fridge-freezer. Different from those works, the proposed methodology does not consider a particular type of appliance. Instead, it is assumed that the prosumer can change its consumption by a certain percentage. As in references (Sasidharan and Singh, 2017), (Xavier et al., 2018) and (Martin Almenta et al., 2016), the proposed methodology is used for Non-frequency AS products we don't define the AS type due to the minimum limits that are required by each category. For AS variable, the proposed methodology considers the voltage control in ± 5 % range related to the optimal value in each bus of the grid. The negotiation type is regarded as a pre-qualified auction as used in references (Qureshi and Jones, 2018), (Lymperopoulos et al., 2015) and (Hollinger et al., 2016). For the proposed methodology, a low voltage (LV) distribution network is used as described in the case study.
This paper is divided into five sections. After this introductory section, section 2 presents the proposed methodology divided into three subsections. Subsection 2.1 presents the procedure and a pseudo-code of the proposed methodology. Later, subsection 2.2 presents the bidding formulation as input to the market model while subsection 2.3 presents the scenario for application. Section 3 presents the numerical results. Finally, Section 4 the conclusions of the work are presented.
2. Proposed Methodology
The acquisition of AS at the domestic or LV level is proposed considering coordination between the DSO, Aggregator (AGG) and Prosumer. As previously mentioned, the Non-Frequency AS is used by TSO or DSO for steady-state voltage control, fast reactive current injections, inertia, and black start capabilities. Thus, the proposed methodology considers an AS, available from prosumers in the LV networks, used by the DSO for voltage control.
The proposed coordination mechanism and involved players are presented in Figure 1. In the coordination, it is considered two different times for operation, namely the day-ahead and real-time. It is assumed that the DSO is responsible for the management of the distribution network. For the day-ahead planning, the DSO performs the power flow (PF) for the next 24 hours considering the forecast of all variables. With the results of the PF, the DSO identifies the periods when violation of the allowed voltage levels may occur. With the knowledge of periods with violations, the DSO is able to request the AS to the AGG. The AGG acts as a market operator, organizing the auction with LV users and selecting the AS providers. The qualification of providers is performed considering an asymmetric pool model where the AGG makes an amount request and the providers submit bid. The accepted bids are qualified for AS providers. In the next 24 hours after the qualified auction, the LV users must provide flexibility if the DSO requests for it. The AGG receives the auction results and is able to communicate the available AS to the DSO. All of these steps are performed for a day-ahead, and the DSO checks in real-time (i.e., at every period) the grid operation. The DSO is expecting a need for using the AS in the periods already detected, although these have been identified using forecasts and there might be changes in the variables. Taking into account these deviations, as the figure 1 shows, a PF validation is performed again with the updated forecasts. Thus, if the AS is really needed, the DSO will send an activation signal to the AGG, which in turn will pass the same signal to the providers pre-qualified in the auction already held. The AS is ready to be delivered, and the AGG communicates the results to the DSO. The DSO can do the settlement in every month with all accumulated values.
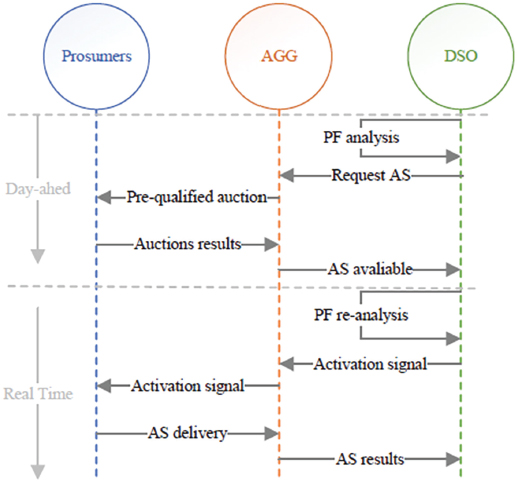
Figure 1. Coordination mechanism
The AGG plays an essential role in this methodology, establishing the interaction between DSO and prosumers with available flexibility. It is considered that the AGG has contracts with the prosumers for flexibility reserve. The AGG operates at a localized level of the distribution grid and therefore, the DSO can assess the impact that aggregated flexibility can have as AS. In the coordination example of Figure 1, it is assumed that the DSO also has its own resources and other contracted AS (e.g., with small industries). When the AS is requested to the AGG, a local market with asymmetric pool model is considered for the flexibility price determination.
2.1. Procedure
In this subsection, the procedure of the proposed methodology, and the pseudocode for correction of voltage violations (algorithm 1), are presented. Equation 1 represents the voltage limits:
where represents the minimum voltage magnitude limit in each bus, represents the maximum voltage magnitude limit in each bus, and represent the voltage magnitude in each bus.
Considering algorithm 1, a radial PF model from (Thukaram et al., 1999) is used for PF analysis. This radial PF was used by the authors in reference (Soares et al., 2013) to calculate the PF in a radial distribution network with high penetration of DERs and electrical vehicles (EVs). The algorithm 1 can be divided into two different operation times, namely day-ahead and real-time. In the day-ahead, action numbers 1 - 9 are performed while real-time execute the action 10 - 16.
| Algorithm 1. Voltage Violations Corrections | ||
1: |
DSO run PF |
For the next 24 hours |
2: |
DSO check all violations |
Magnitude voltage limits |
3: |
IF Violations are found THEN |
|
4: |
Request the AS to AGG |
|
5: |
AGG preforms the pre-qualifications actions |
|
6: |
Procedure Asymmetric Pool |
|
7: |
Prosumers submit bids of flexibility |
|
8: |
Accepted bids determine AS providers |
|
9: |
AGG communicates to DSO the list of AS providers |
|
10: |
DSO runs PF again |
In real Time |
11: |
IF Violations continue THEN |
|
12: |
DSO activates the AS to AGG |
|
13: |
AGG sends the activations signal to AS providers |
|
14: |
The AS is deliverable by the providers |
|
15: |
ELSE IF Violations mitigated THEN |
|
16: |
AS is not activated |
|
17: |
ELSE IF There are no violations THEN |
|
18: |
System is ok |
|
The day-ahead starts with the execution of the PF by the DSO. The violations of the voltage magnitude are obtained with the application of equation 1. If any bus has the magnitude of voltage out of limits, correction is needed. The AS providers are qualified with the results of the asymmetric auction. In an asymmetric auction, a request is performed and the bids are submitted. Each bid is constituted by two components, the price and the amount of energy (flexibility). The bids are sorted by price with ascending order and the sum of the bids (flexibility amount) is performed. When the cumulative sum of flexibility intersects the requested amount, the bid intersecting will determine the price, bids with lower price are also accepted.
2.2. Bidding Formulation
This subsection presents the equations to create the bids. The creation of bids is done randomly considering no intelligence. Equation 2 presents the bid formulation:
where is considered the bid for bus i. Notice that only only buses with end-consumers connected are able of proposing bids. The energy amount is represented by and the price is represented by . The equation 3 represents the amount bid creation:
where rand(0,1) is a random number uniformly distributed between 0 and 1. The 0.1×Si means that the power amount for reduce can only reach 10% of the apparent power Si of bus i The equation 4 represents the price bid creation:
where is a random number taken of a normal distribution with mean 0.095 and standard deviation of 0.05. The mean value of 0.095 is chosen considering the price of energy sales for consumers connect to the low voltage network in Portugal. The can only takes values between 0 and 0.25 €/kWh. The upper limit for bid creation is imposed to comply with the restrictions that the DSO imposes on the payment of flexibility. Otherwise, the price could tend to infinity and it would be more economically viable for the DSO to pay the cost of the violations. Figure 2 shows the normal distribution representation used in this work for price formation.
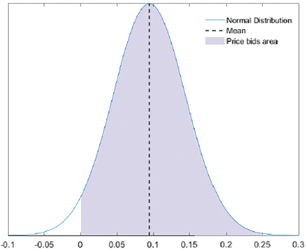
Figure 2. Price probability
In Figure 2, the shadow area represents the possible values for price bids. As can be seen in Figure 4, there is a high probability that the price value will be close to the average. It is considered that there is a 1.8% of probability that the price will be 0.
2.3. Case Study
This section presents the case study and the scenario in which the proposed methodology is implemented. Figure 3 shows the LV network used in this work to perform the simulation.
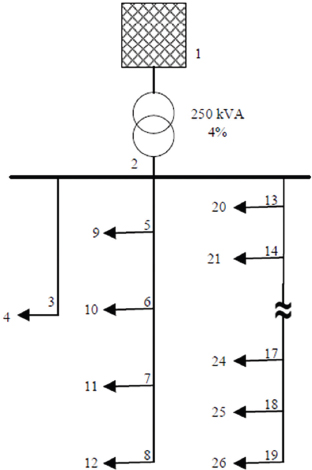
Figure 3. Network Example, 26 buses
It is considered that the network operates on 0.4 kV and consist of 26 buses, from which 12 have households connected. The buses description is present below:
• Bus 1 - External source;
• Bus 2 - Bus bar;
• Buses {3,5,6,7,8,13,14,15,16,17,18,19} - Transfer buses;
• Buses {4,9,10,11,12,20,21,22,23,24,25,26} - Households loads;
• Buses {9,10,12,23,24} - Distributed generators.
The transfer buses are used for a reduction of cable dimensions. As the network used is characteristic of a rural area, the size of the cable is decreased as households may be far from the main cable, thus reducing the costs of installation. It is also assumed that the distributed generators installed in the network are PV generators and belong to the households of specific buses. The description of transformer and lines are present below:
• Transformer {1-2} - 0.25 MVA 20/0.4 kV;
• Line {2-3} - length 260 m, type NAYY 4x150mm2;
• Line {2-5,5-6,6-7,7-8} - length 133 m, type NAYY 4x150mm2;
• Line {2-13,13-14,14-15,15-16,16-17} - length 68 m, type NAYY 4x150mm2;
• Line {17-18,18-19}- length 68 m, type NAYY type NAYY 4x120mm2;
• Line {Households connections} - length 29 m (average), type NAYY 4x50mm2.
The households connections consist in lines between transfer buses and the household. Table 2 presents the characteristics of the lines.
Table 2. Line Characteristics
Type of lines |
||
NAYY 4x50mm2 |
0.642 |
0.083 |
NAYY 4x120mm2 |
0.225 |
0.08 |
NAYY 4x150mm2 |
0.208 |
0.08 |
Notice that lines characteristics in Table 2 are presented in . For PF analysis, the length of the line must be taken into account. The column of r represents the resistance of the line, and the x column represents the reactance of the lines. Figure 4 presents the voltage analysis for buses with loads connected and reference bus number 1.
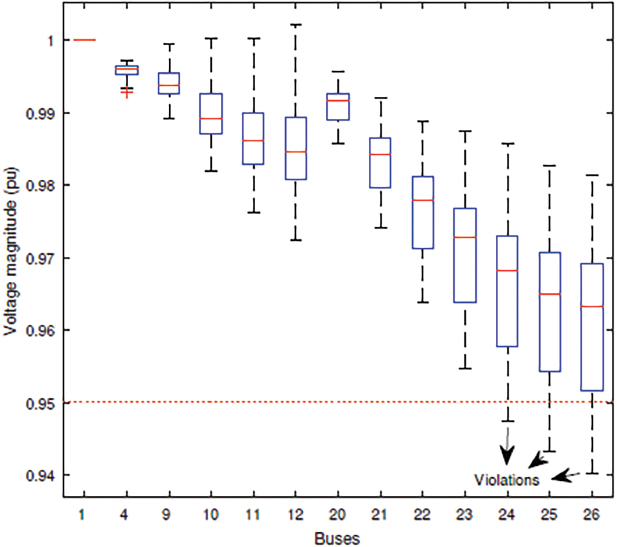
Figure 4. Voltage analyze
As can be seen in Figure 4, the analysis of voltage is performed with the boxplots images. The boxplots of all buses presented in Figure 4 is constructed considering the results for all periods analysed, which are 24. In this case was detected violations in three buses, numbers 24,25,26. Figure 5 shows the magnitude voltage analysis for all periods in buses where violations were identified.
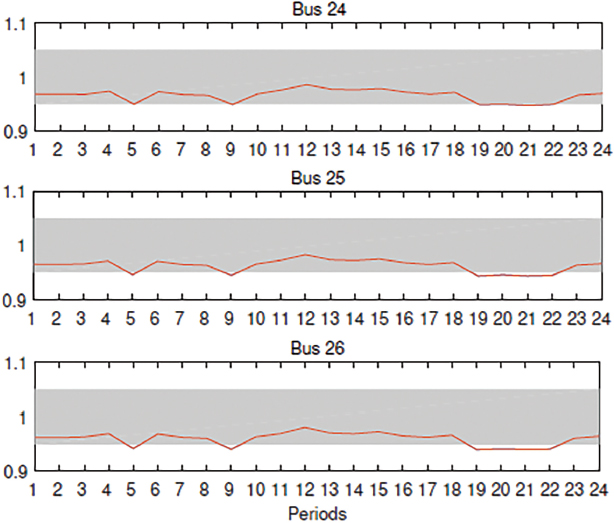
Figure 5. Voltage of Buses {24,25,26}
The red line in Figure 5 represents the voltage magnitude, and the shadow area represents the limits of the voltage magnitude. These limits are defined by equation 1. The buses {24,25,26} are out of limits in periods 5,9,19,20,21 and 22. These periods, with exception of 5, represent peak consumption periods.
3. Numerical results
In this section, the numerical results of the proposed methodology are presented. Considering the algorithm 1, the DSO request AS to the AGG after identified the violations. The AGG performs the pre-auctions qualifications. The results of the pre-auctions qualification in periods that have violations are presented in Table 3.
Table 3. The Effect of Explanatory Variables and Significance
N.º |
Per. |
Req. kWh |
Req. Acc. |
Price €/kWh |
Cost € |
1 |
5 |
26.4 |
10 of 12 |
0.14 |
3.75 |
2 |
9 |
27.1 |
7 of 12 |
0.09 |
2.56 |
3 |
19 |
42 |
12 of 12 |
0.22 |
9.28 |
4 |
20 |
26.8 |
5 of 12 |
0.10 |
2.81 |
5 |
21 |
35 |
12 of 12 |
0.16 |
5.61 |
6 |
22 |
21.1 |
6 of 12 |
0.08 |
1.97 |
As can be observed, all 12 households make bids. There is a trend between the quantity that the AGG requires and the closing price of the market, with the increase of the request also increases the closing price. The action from 19th period is the one that registered a highest request and the highest price, in this auction all bids were accepted (12 of 12). On the other hand, the action of 22nd period was the one with the smallest request and also the smallest piece. In Figure 6 is presented with more detail the pre-auction results for 20th period.
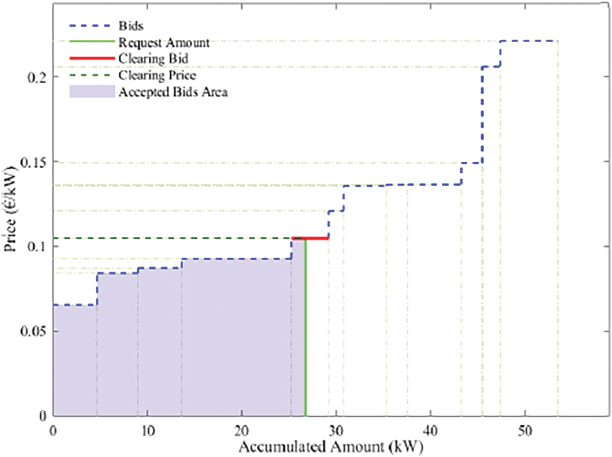
Figure 6. Pool result for 20
Table 5 presents the results in detail for the 20th period. Making an information crossing between Table 5 and Figure 6, it is possible to analyze the accepted bids of the pre-auction in more detail.
As can be seen in Figure 6, the clearing price corresponds to the last accepted bid. With Table 5, it is possible to see that this bid belongs to the household of bus 22. Notice that the quantity of the last bid accepted is not fully covered because the accumulate flexibility exceeds the requested flexibility by the AGG. In fact, only 38% of the quantity amount of this bid is covered. The last accepted bid determines the clearing price, so this bid is clearing bid, and for 20th period, as Table 5 shows, this price is 0.105 €/kWh. On the other hand, the bids from buses {4,11,21,22 and 26} are fully accepted. In the pre-auction, the household of bus 4 has the bid with the smallest price 0.066 €/kWh, and the bus 24 has the bid with highest price 0.221 €/kWh. The smallest quantity is bided by household of bus 20 (1.60 kWh) and the household of bus 26 has the bid with the highest quantity 11.65 kWh.
After all pre-actions are performed, results are presented in the Table 3. Notice that the DSO may or may not perform the AS activation. To determine this, the DSO performs the PF again and checks if violations are present. In this case study, all violations firstly identified were verified in real-time so that it was necessary to activate the pre-contracted AS. During periods when violations persist, AS is activated. Activation as already stated is accomplished by sending a signal to the AGG which it transmits to the prosumers.
Figure 7 presents the box plots for the voltage magnitude of all buses. As can be seen, Figure 7 is obtained after the application of the methodology. All buses have the minimum values between the limits imposed by equation 1.
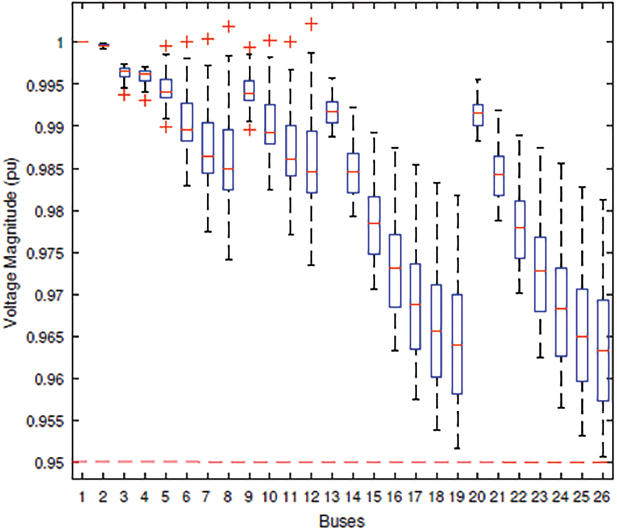
Figure 7. Voltage magnitude after methodology application
Table 5 presents the differences between the application of the proposed methodology and the base case. The Table 4 shows the periods when the activation of AS has occurred and the average of the magnitude voltage. The average of the magnitude voltage is presented as the initial (without application of the presented methodology) an after (application of the methodology). All period have increased the value of magnitude voltage average. From the analysis of Table 4, it is observed that period 19th was the one with the highest increase, 2.65E-03 (pu).
Table 4. Summarized results for magnitude voltage analyses
Periods |
Mag. ave. initial (pu) |
Mag. ave. after (pu) |
Increase |
5 |
0.994 |
0.995 |
3.36E-04 |
9 |
0.994 |
0.994 |
3.45E-04 |
19 |
0.961 |
0.964 |
2.65E-03 |
20 |
0.991 |
0.991 |
6.07E-04 |
21 |
0.983 |
0.984 |
1.14E-03 |
22 |
0.976 |
0.978 |
1.57E-03 |
Table 5. Bids submitted by each bus. Detailed results corresponding to the 20th period
Player |
Quantity kWh |
Price € |
Result |
Closed price €/kWh |
Sale quantity kWh |
Revenue € |
Observation |
Bus 4 |
4.72 |
0.066 |
Accept |
0.105 |
4.72 |
0.49 |
|
Bus 9 |
2.25 |
0.137 |
Excluded |
0.105 |
0 |
0 |
|
Bus 10 |
1.9 |
0.206 |
Excluded |
0.105 |
0 |
0 |
|
Bus 11 |
4.33 |
0.084 |
Accept |
0.105 |
4.33 |
0.45 |
|
Bus 12 |
5.68 |
0.137 |
Excluded |
0.105 |
0 |
0 |
|
Bus 20 |
1.60 |
0.121 |
Excluded |
0.105 |
0 |
0 |
|
Bus 21 |
4.59 |
0.088 |
Accept |
0.105 |
4.59 |
0.48 |
|
Bus 22 |
3.94 |
0.105 |
Accept |
0.105 |
1.51 |
0.16 |
Last bid accepted |
Bus 23 |
4.54 |
0.136 |
Excluded |
0.105 |
0 |
0 |
|
Bus 24 |
6.13 |
0.221 |
Excluded |
0.105 |
0 |
0 |
|
Bus 25 |
2.23 |
0.149 |
Excluded |
0.105 |
0 |
0 |
|
Bus 26 |
11.65 |
0.096 |
Accept |
0.105 |
11.65 |
1.22 |
|
In this case and considering the results of the presented methodology, the DSO needs to pay 25.32€ for 182 kWh of flexibility when the AS is used in all periods. In this case, the mean price per kWh is 0.14€, if comparing a tariff for Portuguese electricity user in network sales is 0.951€/kWh, the price of this methodology is profitable for the end-user. On the other hand, for the network operator, in this case the DSO could contract the AS to a combined heat and power (CHP) generator and get a better price. However, this network's connection to the CHP is performed in median or high voltage and required a very high investment.
4. Conclusion
In this work a methodology for acquiring AS from prosumers flexibility located on the LV network is proposed. The coordination and communication between the agents are an important part of this methodology, allowing AS to be contracted at the lowest voltage level of network. As we can show with the results for the presented case study, the voltage level was restored within limits with the aid of AS from the prosumers flexibility. This flexibility acquisition presented here is accomplished through a pre-auction, pool-based model, that is often used in energy markets (e.g., the spot market). Such approaches are in line with the roadmap defined by the EU, in which the electricity consumer should be at the center of the system and have an active participation on it.
It is important to notice that different assumptions were made in this paper and should be explored in future works. One of such assumptions is the method of creating bids that is used to define the bids on the market by prosumers. This method should be intelligent and distributed so that each prosumer (agent) can do its best bid on the market and on the other hand can have the ability of learn from the results obtained over time.
5. Acknowledgements
This work has received funding from the European Union's Horizon 2020 research and innovation programme under project DOMINOES (grant agreement No 771066), from FEDER Funds through COMPETE program and from National Funds through (FCT) under the project UID/EEA/00760/2019, and Ricardo Faia is supported by national funds through FCT with PhD grant reference SFRH/BD/133086/2017.
References
European Commision. 2016. Directive of the European Parliament and ofthe Council on the internal market for electricity (recast).
European Union Emissions Trading Scheme. 2019. Ancillary services (electricity market). In Emissions-EUETS.com. https://www.emissions-euets.com/internal-electricity-market-glossary/368-ancillary-services
Faia, R., Faria, P., Vale, Z., and Spinola, J. 2019. Demand response optimization using particle swarm algorithm considering optimum battery energy storage schedule in a residential house. Energies, 12(9). https://doi.org/10.3390/en12091645
Gerard, H., Rivero Puente, E. I., and Six, D. 2018. Coordination between transmission and distribution system operators in the electricity sector: A conceptual framework. Utilities Policy, 50, 40–48. https://doi.org/10.1016/j.jup.2017.09.011
Hancher, L., and Winters, B. 2017. The EU Winter Package. Allen & Overy, February. http://fsr.eui.eu/wp-content/uploads/The-EU-Winter-Package.pdf
Hollinger, R., Diazgranados, L. M., Braam, F., Erge, T., Bopp, G., and Engel, B. 2016. Distributed solar battery systems providing primary control reserve. IET Renewable Power Generation, 10(1), 63–70. https://doi.org/10.1049/iet-rpg.2015.0147
Huda, M., Aziz, M., and Tokimatsu, K. 2018. Potential ancillary services of electric vehicles (vehicle-to-grid) in Indonesia. Energy Procedia, 152, 1218–1223. https://doi.org/10.1016/j.egypro.2018.09.172
Lymperopoulos, I., Qureshi, F. A., Nghiem, T., Khatir, A. A., and Jones, C. N. 2015. Providing ancillary service with commercial buildings: The Swiss perspective. IFAC-PapersOnLine, 28(8), 6–13. https://doi.org/10.1016/j.ifacol.2015.08.149
Martin Almenta, M., Morrow, D. J., Best, R. J., Fox, B., and Foley, A. M. 2016. Domestic fridge-freezer load aggregation to support ancillary services. Renewable Energy, 87, 954–964. https://doi.org/10.1016/j.renene.2015.08.033
Qureshi, F. A., and Jones, C. N. 2018. Hierarchical control of building HVAC system for ancillary services provision. Energy and Buildings, 169, 216–227. https://doi.org/10.1016/j.enbuild.2018.03.004
Sasidharan, N., and Singh, J. G. 2017. A resilient DC community grid with real time ancillary services management. Sustainable Cities and Society, 28, 367–386. https://doi.org/10.1016/j.scs.2016.10.007
Soares, J., Morais, H., Sousa, T., Vale, Z., and Faria, P. 2013. Day-ahead resource scheduling including demand response for electric vehicles. IEEE Transactions on Smart Grid, 4(1), 596–605. https://doi.org/10.1109/TSG.2012.2235865
Thukaram, D., Wijekoon Banda, H. M., and Jerome, J. 1999. A robust three phase power flow algorithm for radial distribution systems. Electric Power Systems Research, 50(3), 227–236. https://doi.org/10.1016/S0378-7796(98)00150-3
Xavier, L. S., Cupertino, A. F., and Pereira, H. A. 2018. Ancillary services provided by photovoltaic inverters: Single and three phase control strategies. Computers and Electrical Engineering, 70, 102–121. https://doi.org/10.1016/j.compeleceng.2018.03.010
__________________________
1 Defined by the Portaria nº 115/2019
Author’s Biography

RICARDO FAIA received the bachelor’s in Renewable Energies Engineering from Institute Polytechnic of Bragança in 2013 and M.Sc. degrees in Power Systems from the Polytechnic Institute of Porto in 2016. He is currently Ph.D. student from the University of Salamanca, Salamanca, Spain. He is also a Researcher at Research Group on Intelligent Engineering and Computing for Advanced Innovation and Development (GECAD), Polytechnic Institute of Porto. His research interests include electricity markets, local electricity markets, optimizations problem, metaheuristics, and decision support systems.

TIAGO PINTO (Member, IEEE) received the B.Sc. and M.Sc. degrees from the Polytechnic Institute of Porto, Porto, Portugal, in 2008 and 2011, respectively, and the Ph.D. degree from the University of Trás-os-Montes e Alto Douro, Vila Real, Portugal, in 2016. He is also an Invited Assistant Professor with the School of Engineering, Polytechnic Institute of Porto (ISEP/IPP), and a Researcher with the Research Group on Intelligent Engineering and Computing for Advanced Innovation and Development (GECAD). His research interests include multiagent simulation, machine learning, automated negotiation, smart grids, and electricity markets.

FERNANDO LEZAMA (M’14) received the Ph.D. in ICT from the ITESM, Mexico, in 2014. Since 2017, he is a researcher at GECAD, Polytechnic of Porto, where he contributes in the application of computational intelligence (CI) in the energy domain. Dr. Lezama is part of the National System of Researchers of Mexico since 2016, Chair of the IEEE CIS TF 3 on CI in the Energy Domain, and has been involved in the organization of special sessions, workshops, and competitions (at IEEE WCCI, IEEE CEC and ACM GECCO), to promote the use of CI to solve complex problems in the energy domain.

ZITA VALE (Senior Member, IEEE) received the Ph.D. degree in electrical and computer engineering from the University of Porto, Porto, Portugal, in 1993. She is currently a Professor with the Polytechnic Institute of Porto, Porto. Her research interests focus on artificial intelligence applications, smart grids, electricity markets, demand response, electric vehicles, and renewable energy sources.

JUAN M. CORCHADO (Member, IEEE) was born in Salamanca, Spain, in 1971. He received the Ph.D. degree in computer sciences from the University of Salamanca and the Ph.D. degree in artificial intelligence from the University of the West of Scotland. He was the Vice President for Research and Technology Transfer, from 2013 to 2017, and the Director of the Science Park with the University of Salamanca, where he was also the Director of the Doctoral School, until 2017. He has been elected twice as the Dean of the Faculty of Science with the University of Salamanca. He has been a Visiting Professor with the Osaka Institute of Technology, since 2015, and a Visiting Professor with University Technology Malaysia, since 2017. He is the Director of the Bioinformatics, Intelligent Systems, and Educational Technology (BISITE) Research Group, which he created, in 2000. He is the President of the IEEE Systems, Man and Cybernetics Spanish Chapter and the Academic Director of the Institute of Digital Art and Animation, University of Salamanca, where he is currently a Full Professor. He also oversees the master's programs in digital animation, security, mobile technology, community management, and management for TIC Enterprises with the University of Salamanca. He is a member of the Advisory Group on Online Terrorist Propaganda of the European Counter Terrorism Centre (EUROPOL). He is also an Editor and the Editor-in-Chief of specialized journals such as the Advances in Distributed Computing and Artificial Intelligence Journal, the International Journal of Digital Contents and Applications, and the Oriental Journal of Computer Science and Technology.

ALFONSO GONZÁLEZ-BRIONES holds a Ph.D. in Computer Engineering from the University of Salamanca since 2018, his thesis obtained the second place in the 1st SENSORS+CIRTI Award for the best national thesis in smart cities (CAEPIA 2018). At the same university, he obtained his Bachelor of Technical Engineer in Computer Engineering (2012), Degree in Computer Engineering (2013), and Masters in Intelligent Systems (2014). Alfonso was Project Manager of Industry 4.0 and IoT projects in the AIR Institute, Lecturer at the International University of La Rioja (UNIR), and also “Juan De La Cierva” Postdoc at University Complutense of Madrid. Currently, he is Assistant Professor at the University of Salamanca in the Department of Computer Science and Automatics. He has published more than 30 articles in journals, more than 60 articles in books and international congresses and has participated in 10 international research projects. He is also Member of the scientific committee of the Advances in Distributed Computing and Artificial Intelligence Journal (ADCAIJ) and British Journal of Applied Science & Technology (BJAST) and Reviewer of international journals (Supercomputing Journal, Journal of King Saud University, Energies, Sensors, Electronics or Applied Sciences, among others). He has participated as Chair and Member of the technical committee of prestigious international congresses (AIPES, HAIS, FODERTICS, PAAMS, KDIR).