
Regular Issue, Vol. 11 N. 2 (2022), 207-235
eISSN: 2255-2863
DOI: https://doi.org/10.14201/adcaij.27430
 |
ADCAIJ: Advances in Distributed Computing and Artificial Intelligence Journal
Regular Issue, Vol. 11 N. 2 (2022), 207-235 eISSN: 2255-2863 DOI: https://doi.org/10.14201/adcaij.27430 |
Efficient Content Based Video Retrieval System by Applying AlexNet on Key Frames
Altaf Hussaina,b, Mehtab Ahmada, Tariq Hussaina,c*, and Ijaz Ullahd
a Institute of Computer Science & IT (ICS/IT), The University of Agriculture Peshawar, Pakistan
b Department of Accounting & Information Systems, College of Business and Economics, Qatar University, Doha, Qatar
c School of Computer Science and Information Engineering, Zhejiang Gongshang University Hangzhou, China
d University of Rennes 1, France
altafkfm74@gmail.com, mehtab@aup.edu.pk, uom.tariq@gmail.com, ijaz_flair@yahoo.com
*Correspondence: uom.tariq@gmail.com
ABSTRACT
The video retrieval system refers to the task of retrieving the most relevant video collection, given a user query. By applying some feature extraction models the contents of the video can be extracted. With the exponential increase in video data in online and offline databases as well as a huge implementation of multiple applications in health, military, social media, and art, the Content-Based Video Retrieval (CBVR) system has emerged. The CBVR system takes the inner contents of the video frame and analyses features of each frame, through which similar videos are retrieved from the database. However, searching and retrieving the same clips from huge video collection is a hard job because of the presence of complex properties of visual data. Video clips have many frames and every frame has multiple properties that have many visual properties like color, shape, and texture. In this research, an efficient content-based video retrieval system using the AlexNet model of Convolutional Neural Network (CNN) on the keyframes system has been proposed. Firstly, select the keyframes from the video. Secondly, the color histogram is then calculated. Then the features of the color histogram are compared and analyzed for CBVR. The proposed system is based on the AlexNet model of CNN and color histogram, and extracted features from the frames are together to store in the feature vector. From MATLAB simulation results, the proposed method has been evaluated on benchmark dataset UCF101 which has 13320 videos from 101 action categories. The experiments of our system give a better performance as compared to the other state-of-the-art techniques. In contrast to the existing work, the proposed video retrieval system has shown a dramatic and outstanding performance by using accuracy and loss as performance evaluation parameters.
KEYWORDS
CNN; K-Mean, CBVR; color histogram; accuracy; loss; BoW; AlexNet
1. Introduction
The worldwide connectivity grows day by day, it is important to index and retrieve the video data competently to combat the information explosion. The common system of video indexing and retrieval is usually achieved by manual annotations. Allowing more data to be generated and collected, a growing portion of that data will be real-time information, according to IDC (International Data Council). By 2025, nearly 30 percent of the so-called «global data sphere» will be real-time information. Currently, digital data has reached 281 exabytes. Furthermore, according to the IDC report, the digital data is to be 44 times larger in 2020 than in 2009. Currently, most of the data is unstructured such as images, video, text, and music. In information retrieval, content-wise video retrieval is the basic problem (Iqbal et al., 2018). The related video retrieval denotes the work of retrieving the same video gathering, by the user input query to the system. Multimedia resources get wide benefits from vigorous video retrieval schemes such as news channel analysis of videos, broadcasting of desired videos, analysis of marketable videos, modern museum-like digital, and action of surveillance in videos. In the previous years, the collections of videos small and video retrieve were placed manual annotation. The current high growth of digital data is increasing day by day, due to this increase the advanced technology will be supported in multimedia schemes. Manual annotation has been no more reliable in the retrieval of videos. As a result, it makes a great request for automatic video retrieval systems. User input query and retrieve video from the database using a specific model query. The submitted query information is annotating in a new advanced method and this information saves inefficient way. Due to the digital universe of different cultures and multimedia interaction, content-based image and video retrieval have a wide area of inventions. While the digital data increasing year by year.it is a very big problem to annotate the digital data content with keywords (Thanh et al., 2014).
For graphical content extraction, the Convolutional Neural Network (CNN) is used and CNN is artificial intelligence. For object recognition and human action recognition Convolutional neural network is very powerful and outstanding. Neuron includes convolutional Neural Networks and these are which have weights learnable and preferences. With nonlinearity in start one by one neuron load with digital values and calculate with dot product and follow till the processed completion. Convolutional Neural Network design provide a correct statement on behalf of stating inputs digital data and call the network to compile these properties to the design. A reduce the number of parameters to the next function makes that more efficient to implement the network (Iqbal et al., 2018). In the current era of information technology, digital data is played a vital role in law enforcement, office work, and entertainment, and everywhere in life. The internet and offline systems are big sources of videos. On the internet and offline databases have big data and all users access these data through an index. All the mention resources use indexing retrieval. Somehow in Google using content-based image retrieval but does not have video retrieval. Formulation of the query annotation is generally the automation of content instead of indexing annotation. Content analysis is very difficult to work in the video but in the image, so not hard. In a single image, annotation is very easy through handcrafting. Nowadays the video is generally limited to simple content-based features for researches.
Human action recognition is a very hard task in research, and video data is available everywhere. In the present videos and cameras, human action recognition is a very difficult task. And in the data set, there are a lot of human actions on which we train machines. Featured based video retrieval is a very difficult job. A big reason is a high variation in videos in which the meaning full idea can occur in multiple conditions shot setting, lightning. i.e. a man in the video riding on a bicycle has a variation like multiple points, resolution, advents, type of bicycle, and movement of the camera. Almost all the researchers aimed at these challenges. Hence some features will be needed to match two videos (Jones and Shao, 2013).
1.1. Motivation and Background
The primary use of the system is to retrieve similar videos that are present in the database, such as retrieving the whole movie from its trailer. And this system can also use for database management, just search a video in the database and store it in categories wise. But once the system is implemented it can be used for diversified applications just by changing the algorithms. For example, if we change the algorithm to object detection. There are some other applications of the content-based video retrieval system. Searching videos in a large database is a very useful application in this environment because through the text they may retrieve fake names videos. From news, the archive retrieves news on demand. This research can also use for security purposes to detect a specific event. In education searching lecture related data. In the shopping mall, we can use for product information. Searching the desired video in a big database by text may have a fake name or wrong name so you will be retrieved undesired video. Hence content-based video retrieval can use in any digital environment.
Resourceful video retrieval has been applied earlier on the videos but to the best of our knowledge, it was neither efficient nor accurate. It has some limitations and the first one is that it was taking a long time i.e., it has the highest time complexity at the time of process when video data was being called by their contents. The existing work uses some approaches for the sake of improvements of the CBVR system. At the early stage, the video query was obtained. Then the feature extraction was taken into account. Then the query of the target file of the video was forwarded for a similar matching of the contents based on keyframes and some identical terms. On the other hand, the video collection and then the extraction were taken into account. These all were then checked into their created database and that database was linked directly with the similarity matching and at the end, retrieved videos were to be obtained as requested by the earlier video at the time of searching into the database. Unlike the existing work, the proposed work possesses the advantage of using an efficient video extraction system. The main difference between the existing work and the proposed work is that the proposed work takes less time at the time of processing the video retrieval and gives an efficient and robust result which is remarkably an outstanding performance as compared to the existing work. Additionally, the proposed work performs well by using multiple feature extraction and getting or merging the positive features of these CBVR models.
1.2. Problem Statement
Text-based video retrieval systems mostly retrieve incorrect video because people namely caption the videos with a fake title. When users are searching for the desired video they are not found the desired video due to the fake. Manual annotation becomes very hard and expensive. Manual annotations also take more time to search for desired videos. If the videos are organized in a well-known manner the text-based retrieval will be a better option. But without annotation the retrieval of videos is inefficient. The previous research on this area was not used a good framework and algorithm. If someone used CNN they were not used good handcrafted methods for features extraction and benchmark datasets. And used RGB2GRAY for feature extraction and the videos are most colorful. For this purpose, the grayscale cannot achieve good performance on color videos. In light of the above-mentioned problem with the CBVR in the existing work, the proposed work will be using the best features of the CNN model for accurate extraction of the videos based on contents and mainly the graphical representation of the videos. The proposed CNN model has the best accuracy in contrast with the existing used models.
1.3. Research Contributions
1. To develop a Content-Based Video Retrieval system using an AlexNet model on keyframes.
2. To evaluate the proposed method based on AlexNet in terms of accuracy and loss with FC6, FC7, and FC8 layers of the CNN model.
2. Literature Review
In this section, the related works of the proposed research work have been discussed along with different perspectives from the author’s point of view. The majority of the researchers have worked on contents based video retrieval scheme for the sake of improvements in contents feature extraction in video files. Along with these some open research issues and challenges have been also discussed and their solution. Research gaps have been revealed from the majority of the related works from which the performance evaluations have been carried out by using simulation-based techniques. In short, this section gives a thorough review of the related work with the contrast of the proposed work to find the research gap and also to find out the level of percentage of accuracy of the existing works.
Zhang et al. (2019) authors suppose that to solve the problem of large-scale video retrieval by an image query. They were given a top k image video query. After that, they combined the CNN for short and BoVW for short modules to construct a system for video frame information extraction and representation. For a large scale, video retrieval needed they proposed a visual weight inverted index and algorithm for the improvement of performance and accuracy of the process. And the suggested system got an improvement in the state of the approaches with better accuracy. They found the top k image for query and retrieved the top most related videos from the database. And experimentally they achieved good result from the state of the art methods with respect to accuracy. Bolettieri et al. (2019) the authors suggested a vision system for video retrieval. It contained a content-based analysis and module of retrieval. They were contained searching through the keywords. and on the base of object search and content matching search. Euclidean matching was the most approach. And the suggested method is based on deep learning for the analysis of contents. Actually, they covered all the textual and visual descriptors extracted from the videos into textual combinations. They were representing the version of vision in the image retrieval system used to search for videos.
Chen et al. (2017) proposed and investigate the problem of personalized keyframe recommendations; they overcome the above problem. They designed a new keyframe recommender that was instantaneously model textual and visual features in an integrated structure. They posted comments on previously personalized base review frames, in an integrated multi-modal space they were able to encode deferent user benefits, and they would thus select keyframes in a modified method, which, according to his knowledge, it was the first time work in the research field of video content analysis. On various measures and experimental results show that has method accomplishes better than its challengers. Algorithms of clustering were having a very great point of research; they were suggested a real scheme for clustering by added important assets of video to collect the same frames into clusters. In the last, whole clusters’ the center cluster was selected as static video summarization. Has work recognized a high relevant frame from the cluster of frames automatically compared to previous work, they test and the train has worked and compare with some traditional clustering techniques. The experimental result that has the proposed method has better accuracy and performance. They proposed VRHDPS based on HDPS, there was no need to mention the clusters, as the algorithm of clusters. HDPS was trusted on the centroid cluster frame and was considered by a great value than their adjacent and by a high difference were very low density to the centroid frame. In HDPS some structures of video summarization have not been measured. Thus, they proposed the VRHDPS clustering algorithm, which was more reliable for video summarization.
Ouadrhiri et al. (2017) suggested using spatial-temporal types to describe videos. Bounded Coordinate of Motion Histogram was acquainting to describe and match video subsequences in a reduced calculation interval. Furthermore, the suggested method was adaptive: presented a training procedure. And on a database of 1707 movie clips the cost was expressed in comparison measurement has its accuracy improved by more than double (approximately 38%) in association with extended fast dynamic time distorting method. the challenge was, to make the related signatures built on gesture and, and other was a very fast similarity measure must, therefore, be used to matched video subsequences. A novel solution was proposed in this research: for classification and matching, videos subsequences in a compact calculation time Bounded Coordinate of Motion Histogram was introduced. Sedighi and Fridrich, (2017) suggested the possibility behind the CNN to used present structure to improve the structure of kernels linear pixel analysts in feature-based coding. In CNN the additional objective function in the form of some scalar classifier performance condition by the missing function. For the optimization, the job provided a method for histograms within a CNN that could be powerful gradient descend systems. Thus, the first step, for the Caffe CNN suite they were to deploy a histogram layer. As the structure blocks of this layer to get an appropriate backflow of gradients over the layer and to enable learning of the parameters behind this layer using mean shifted Gaussian functions. In PSRM, each SRM kernel was trained on fifty-five arbitrary two-dimensional kernels and they are rotated and mirrored forms. The result of a large number of projections was the higher the detection rate of this feature was set, high the computational costs came. This problem could provide a powerful feature set impracticable for applications with restricted time and computational power. The proposed study also hints at the opportunity to extract more information in the last layers of CNNs to get the way for better network projects. Asha et al. (2018) used multiple features for a realistic content-based video retrieval system (CBVR) to retrieve videos expertly. The proposed method converts videos into scenes, using keyframes that were extracted and the algorithm of histogram-based scene change detection. Straight forward rules were used for keyframes multiple feature extractions. They used the Euclidean distance formula to measure the values in feature vector and query. The CBVR systems were compared with the proposed system with a single feature. After the experiment shows that from the single feature system the multiple feature system performs better.
Iqbal et al. (2018) used the digital image processing method (Eigenface, the histogram of gradients, active appearance model, and Haar features) on Query Process Model that retrieved a list of videos from a database. And clustering method (k mean, SVM, and K-Nearest Neighbor) and consequence (testing and training) are with their confusion matrix (specificity and Sensitivity). As compared to convolutional Neural Network result with other clustering techniques the CNN was outstanding. According to inefficient hardware, they did not achieve a better result. For more research in this area of objection recognition, the complex convolution neural network will be used. And dropout architecture used unlimited hardware resources (TPU or GPU) in Deep Belief Network (DBN) with multiple hidden layers are used. Sikos (2018) excogitated that low-level feature extraction does not correspond to the concept. Events and persons are shown in videos, As well as to decrease the semantic Gap, the shown concepts and their spatial relations were described in a computational form used formal descriptions from designed data resources. Events and actions information was described as inefficient rule-based mechanisms. For the computational spatiotemporal annotation of complex video scenes that were suitable structured with audio and textual description, the annotation of videos was manually or panoramically done, and the presented research can be used in scene interpretation, and content-based video retrieval, and video understanding. Song et al. (2018) proposed a framework named Self Supervised Video Hashing (SSVH). That was able in hash fashion manner to capture the time base nature of the videos in the end to end learning. Two main problems specifically they addressed: 1) how to design converter and reconverted system to generate for video a binary code; and 2) how for accurate video retrieval train the binary codes with the ability. FCVID and YFC are two data sets on which the results were tested. And show that has SSVH approach has suggestively outclassed the state of the art systems and achieve the presently best result on the task.
Tarigan et al. (2018) invented an implementation of CBVR using SURF. In query give an image, the system search videos in database and retrieve similar videos with query image that matched with video frames. The objective of the authors was to measure performance. Through precision and recall, the performance of the proposed system was measured. Two sets of samples not in frame and in-frame were used for performance testing. Also, they limit five categories of simple only: pets, kitchen, body parts, fruits, and eating utensils. The test shows the program gives the performance on 37.5% precision and on recall 57.75% average value for not in frame tested, while the in-frame test gives precision 59% and for recall 51%. There is no relation between not in the frame and in the frame and speed Complexity depends upon the length of the video and query image. Lingam and Reddy (2019) described an RPCA framework for keyframe extraction. In unstructured user videos, they focused on the interesting application of extracting keyframes from the videos. By the observation, the proposed framework was motivated that RPCA enters data into (1) the features of the dataset a low-position segment that uncovers the methodical data over the framework, and (2), in the equivalent dataset a lot of inadequate parts every one of which contains unmistakable data. The two data types were consolidated into a solitary '1-standard based non-arched advancement issue to recover the needed number of keyframes. Besides, the answer to the advancement issue they were plans another iterative calculation. The proposed RPCA based system doesn't require shot(s) division, semantic comprehension, or acknowledgment of the key film. At long last, on the client video, the tests were performed. A correlation of the outcomes acquired by has a strategy with related best in class and the ground truth calculations obviously show the attainability of the proposed RPCA based structure. As appeared to assess the multifaceted nature they surveyed the normal preparing time per outline. As indicated by these trials, to process a solitary edge has HIP put together method took 1.469 seconds with respect to average, with 0.233 seconds per outline for the RPCA decay of the info signal into low position and meager segments, and advancement issue fathomed then the on normal 1.236 seconds per outline. The referenced number was reliant on the computational intensity of the hidden equipment. Intel Core E7500 2.93 GHz stages were utilized in his work. Diminished the normal handling time per outline by an element, and the picture size similar to the size of 80x60, which they were utilized in has tried. For example, 1frame/sec utilized a pre-testing rate and diminished to 0.0612 sec/outline the normal time per a single frame.
3. The Proposed Methodology
In this section, the research methodology of the proposed work has been discussed. The methodology of the research work consists of proposed work which is the core contribution. Along with these the related methods and techniques have been discussed that how the proposed work has been carried out by using simulation. The performance evaluation parameters have been proposed for the research work by which the evaluation can be made with the state of the art solutions. This section also gave a thorough idea about the step by step methodology for the proposed work. In which the first step is the proposed framework that is the core of this research.
3.1. Proposed Research Framework
Video processing like indexing, browsing, and retrieval is a procedure of marking videos and sorting out them in an actual way for quick browsing and recovery. Computerization of video indexing can altogether lessen preparing cost while eradicating dull effort. The conventional features utilized as a part of the vast majority of the current video retrieval frameworks are the features, for example, color, texture, shape, movement, face, sound, etc. Clearly more the number of features used to present the information, the better the retrieval precision. In any case, as the feature vector measurement increments with an expanding number of features, there is an exchange off between the retrieval accuracy and complexity. So it is fundamental to have insignificant features present in the videos, slightly. In this research we talk about Video key frames, indexing, extract CNN features through deep learning used for video indexing, browsing, and retrieval.
Our proposed CBVR (Content-Based Video Retrieval) system, architecture shows a novel procedure for similar information retrieval. Our proposed framework includes multiple modules or steps. In the first step, we read the video and convert it into multiple frames, in the next step we are extracted handcrafted features from all frames and select key-frames through unsupervised learning, clustering technique. After selection of keyframes, we extract CNN (ConvNets) features using deep learning from key-frames and save that features in a single feature vector, the above process is used for query video as well as for videos database, at the end we find the difference between query video and database through distance measurement equation (distance matrix) to calculate the distance. And retrieve most similar videos to the query video from the database. The overall architecture is shown in Figure 1.
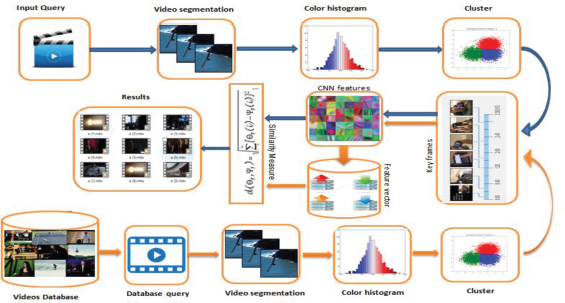
Figure 1. The Proposed Framework
3.1.1 Video Reading
The proposed search engine reads a video through reading video(), function, and find the total duration as well as frame rating of the given video, which is helpful to read video frame by frame through a depicting coding I any environment.
3.1.2 Framing
Every video has a sequence of images, which concatenate with each other in video form. We see a video in television or in any other device it is actually a sequence of the frame, the same sequence of frames makes a shot, and more than one-shots make a scene and some scene is together to make a video.
3.1.3 Color Histogram
In the field of digital image processing, a color histogram is one of the best feature representation techniques that represent all colors in every pixel of an image. The color histogram represents the fixed length of the color range in each and every pixel of the image. Through this technique, we represent or extract the color information from images or from a sequence of the frame and store the given information in a vector.
3.1.4 Hand Crafted Features
The set of handcrafted features contains features concerned with color and edges, to present special information and motion for temporal information. The shot regional properties will describe by color features, such as the average or median color of a specific region. The edge features think about the local dissemination just as directionality of edges. At long last, the movement features produce local histograms of the direction of development. A total list of the handcrafted features realized in the CBVR framework is exhibited underneath. All handcrafted features utilize the quadratic Euclidean matrix for the correlation of feature vectors. The distances are adapted into a comparability score utilizing a direct change for which the most extreme is resolved exactly. The aftereffects of the single component modules are joined to a solitary lucid outcome set by recording a weighted average over the similarity scores (Rossetto et al., 2015).
3.1.5 High-Level Features
These types of features are extracted through deep learning, utilizing a specific model for feature extraction. There are two types’ features, one is special and the other is temporal for motion in video shots. Such deep learning approaches are used to efficiently extract the features and other characteristics, which are performed than another conventional method.
3.1.6 Key Frame Extraction
The color histogram features have been used as a part of the key-frames selection step, however, the video movement has not been considered as a feature. In the key-frames extraction, we must calculate the color histogram of each frame and save it, after calculating the histogram, we apply the clustering technique and then find the centroid of each cluster and find the distance from the cluster of a center and select the nearest frame to the center of the cluster and select that frame as a keyframe, we follow this process and select the one frame from each cluster as a keyframe. We use the k mean clustering algorithm for the selection of keyframe, the main advantage of the k means clustering algorithm is that the method is efficient for the proposed work to implement and evaluate the performance of the suggested method is suitable. The steps followed in the k mean clustering algorithm are;
Initialize: randomly select k of the n information focuses as the mean.
Assignment step: Relate every datum point to the nearest mean.
Update step: For each mean m and every datum point o related to m swap m and o and process the aggregate cost of the design (that is, the normal divergence of o to every one of the information directs related toward m). Select the mean o with the most reduced cost of the configuration.
Repeat substituting stages 2 and 3 until there is no adjustment in the assignments.
The methodology took after for extraction of key edges from a video comprises of the following stages;
Algorithm 1. Pseudo code for K-Mean Clustering
Step1:eachcasingofinfovideoextricateCH
featurevector.Hf=inputimage;
Step2:Acquirefewbunchesutilizingk-meanclusteringalgorithm,
thefeaturevectorsextricated∈
step1.K-numberofclusters∈video;
Step3:Discoveronefeaturevectortheprinciplegroupwhichis
closertherelatingclustercenter.Cframe=(kframe,I);
Step4:Announcethecomparingvector’sframeaskey-frameofthe
firstcluster.Kf=cframe;
Step5:Applystage3∧stage4onremainingclusters∧
concentratekey-frameskf=(1,2,3,kn);End;
Figure 2 represents the diagrammatical illustration of key-frame extraction.
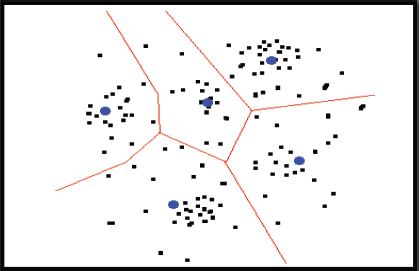
Figure 2. Key-frame extraction
Figure 2 applying clustering method and then find the centroid of each cluster and find the distance from the cluster of a center and select the nearest point to the center of the cluster and select that point as a centroid, we follow this process and select the one point from each cluster as a centroid. We use the k mean clustering algorithm for the selection of centroid point, the main advantage of the k means clustering algorithm is that the method is efficient for the proposed work to implement and evaluate the performance of the suggested method is suitable.
3.1.7 Convolutional Neural Network (CNN)
Convolutional Neural Network is the branch of deep learning which takes the image in input and assigns most importance to several features/objects in the image and capable to distinguish one from the other. In convert, the required processing is lower as compared to other methods. After the training, they have the ability to learn the characteristics.
For computer visual contents detection the convolutional neural network becomes more dominant and CNN is the branch, a class of Ai. The design of CNN is designed to take automatically and adaptively learn three-dimensional orders of features through backpropagation by using multiple building blocks, pooling layers convolution layers, and fully connected layers. Through the mention layers, input data are converting to output propagation. 2D-CNN described pooling and convolution operations. For three-dimensional, these operations were also performed.
3.1.7.1 AlexNet Model Architecture
This design contained around 650,000 neurons and 60 million parameters. AlexNet design comprises fourteen layers, of which seven are convolution layers, four are Max-Pooling layers and three are fully connected layers. In every convolution layer, there are product channels utilized. The third, fourth, and fifth layers which are associated straightforwardly are called convolutional layers. The fifth convolutional layer is connected to the maximum tricking layer and the last three completely associated layers are utilized for the point of the arrangement. Figures 3 and 4 shows the AlexNet engineering.
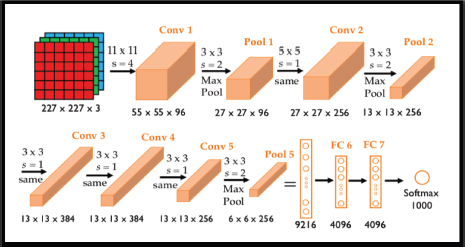
Figure 3. CNN architecture (Han et al. (2015))
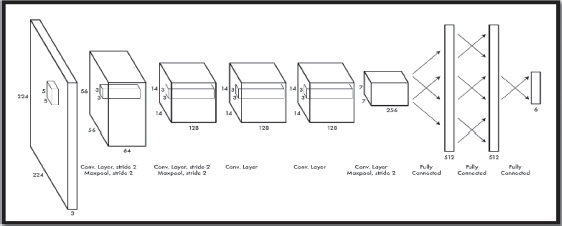
Figure 4. AlexNet Architecture
The proposed AlexNet model consists of fourteen layers, of which seven are convolution layers, four are Max-Pooling layers and three are fully connected layers. The summary of the proposed Alex net model is shown in Table 1.
Table 1. Detail Summary of Proposed Alexnet Model
|
Layer |
Kernel Size |
Padding |
Stride |
Activation |
Input |
Output |
1 |
Convolution |
3*3 |
P=Same |
S=1 |
Relu |
(50,50,3) |
(48,48,128) |
2 |
B-Normalization |
----- |
-------- |
-------- |
-------- |
(48,48,128) |
(48,48,128) |
3 |
Max Pooling |
2*2 |
P=Same |
S=1 |
-------- |
(48,48,128) |
(47,47,128) |
4 |
Dropout = 0.10 |
----- |
-------- |
-------- |
-------- |
(47,47,128) |
(47,47,128) |
5 |
Convolution |
3*3 |
P=Same |
S=1 |
Relu |
(47,47,128) |
(45,45,256) |
6 |
B-Normalization |
----- |
-------- |
-------- |
-------- |
(47,47,128) |
(45,45,256) |
7 |
Max Pooling |
2*2 |
P=Same |
S=1 |
-------- |
(45,45,256) |
(44,44,256) |
8 |
Dropout = 0.10 |
----- |
-------- |
-------- |
-------- |
(44,44,256) |
(44,44,256) |
9 |
Convolution |
3*3 |
P=Same |
S=1 |
Relu |
(44,44,256) |
(42,42,256) |
10 |
B-Normalization |
----- |
-------- |
-------- |
-------- |
(42,42,256) |
(42,42,256) |
11 |
Max Pooling |
2*2 |
P=Same |
S=1 |
-------- |
(42,42,256) |
(41,41,256) |
12 |
Dropout = 0.10 |
----- |
-------- |
-------- |
-------- |
(41,41,256) |
(41,41,256) |
13 |
Convolution |
3*3 |
P=Same |
S=1 |
Relu |
(41,41,256) |
(39,39,256) |
14 |
B-Normalization |
----- |
-------- |
-------- |
-------- |
(39,39,256) |
(39,39,256) |
15 |
Dropout = 0.10 |
----- |
-------- |
-------- |
-------- |
(39,39,256) |
(39,39,256) |
16 |
Convolution |
3*3 |
P=Same |
S=1 |
Relu |
(39,39,256) |
(37,37,256) |
17 |
B-Normalization |
----- |
-------- |
-------- |
-------- |
(37,37,256) |
(37,37,256) |
18 |
Dropout = 0.10 |
----- |
-------- |
-------- |
-------- |
(37,37,256) |
(37,37,256) |
19 |
Convolution |
3*3 |
P=Same |
S=1 |
Relu |
(37,37,256) |
(35,35,256) |
20 |
B-Normalization |
----- |
-------- |
-------- |
-------- |
(35,35,256) |
(35,35,256) |
21 |
Dropout = 0.10 |
----- |
-------- |
-------- |
-------- |
(35,35,256) |
(35,35,256) |
22 |
Convolution |
3*3 |
P=Same |
S=1 |
Relu |
(35,35,256) |
(33,33,512) |
23 |
B-Normalization |
----- |
-------- |
-------- |
-------- |
(33,33,512) |
(33,33,512) |
24 |
Max Pooling |
2*2 |
P=Same |
S=1 |
-------- |
(33,33,512) |
(32,32,512) |
25 |
Dropout = 0.30 |
----- |
-------- |
-------- |
-------- |
(32,32,512) |
(32,32,512) |
26 |
Flatten |
----- |
-------- |
-------- |
-------- |
(32,32,512) |
(524288) |
27 |
Dense1 |
----- |
-------- |
-------- |
-------- |
(524288) |
(1024) |
28 |
B-Normalization |
----- |
-------- |
-------- |
-------- |
(1024) |
(1024) |
29 |
Dropout=0.50 |
----- |
-------- |
-------- |
-------- |
(1024) |
(1024) |
30 |
Dense2 |
----- |
-------- |
-------- |
-------- |
(1024) |
(2000) |
31 |
B-Normalization |
----- |
-------- |
-------- |
-------- |
2000 |
2000 |
32 |
Dropout=0.50 |
----- |
-------- |
-------- |
-------- |
2000 |
2000 |
33 |
Dense3 |
-------- |
-------- |
-------- |
-------- |
2000 |
2 |
In Table 1 shown seven convolutions, four Max-Pooling, three fully connected layers, and Relu as activation. The input image of size (50, 50, 3) is used in which the height of the image is 50, the width of the image is also 50 and channels are three. In all seven convolution layers, the size of the kernel window is kept (3,3), the stride is kept 1 and padding is the same.in four max-pooling layers kernel window size is kept (2,2) and stride of 1. Batch normalization is also used throughout each layer in order to normalize values and increase network speed. In convolution layers drop out of 0.30 is used while in two fully connected layers drop out of 0.5 were used in order to reduce the overfitting problem and the last fully connected layers are used for SoftMax operation.
FC stands for Fully Connected in the given expression which is a layer in the CNN for feature extraction providing an appropriate arrangement for segregation and classification process of images and other associated contents in the videos etc. FC6, FC7, and FC8 are layers that have diverse features in contrast with one another that is achieved by the required task. In short, these are the levels of fully connected layers as mentioned 6, 7, and 8 which denote that each level has an improvement as compared to the second last one. FC7 is an improved and extension of FC6 and FC8 is an improved and extension of FC7. In the FC6 layer, there exist units which connect it with additional features to be carried out. For the fully connected layers, let Ni, Pi, and Ui be the number of output units, parameters (weights), and connections of layer Li.
• ReLU Nonlinearity
Instead of the tanh function, AlexNet uses Rectified Linear Units. This was very famous and standard at the time. The advantage of ReLU’s is its time of training; a 25% error was CNN using ReLU on the CIFAR-10 dataset six times faster than a CNN using tanh.
• Multiple GPUs
GPUs are working back in the day around three GBs of space; the training had 1.2 million pictures they were especially bad. AlexNet can operate on multiple GPUs they put half neuron of the model on one system and a half on another system. This is not enough to train the bigger model but it also Not only does mean that a bigger model can be trained, but it also counts down the training time.
• Overlapping Pooling
At the point when the creators create the cover, they saw a decrease in mistake by about 0.5% and found that models with covering pooling by and large think that it’s harder to over-fit.
• The Overfitting Problem
The AlexNet has sixty million parameters included in the model, a general problem in overfitting. Two techniques were applied to decrease the overfitting problem:
• Data Augmentation
The authors were utilized name safeguarding change to spare their information increasingly solid. In particular, they made picture transformations and even reflections, which amplified the preparation, set by a factor of 2048. Performed Principle Component Analysis (PCA) was additionally applied to the RGB pixel esteems to change the forces of RGB channels, which diminished the main 1 blunder rate by over 1%.
• Dropout
This methodology contained «turning off» neurons with a prearranged probability (e.g. 50%). Its mean parameter of the model is used for different iteration, another random neuron from which they get robust features they forced these neurons. They also increase the training time needed for model modification.
3.1.8 Euclidian Distance-Based Similarity
Euclidean distance method is used for the difference between the input query and database query. The Euclidian equation subtracts one query from another through feature vector and measures the difference, which is mention below.
Where the features are extracted from the input query and database query, in which the first parameter v is the input query vector and the second one database query vector. Distance ‘d’ is calculated for query videos with database query videos. The greater will be occurring when the d is smaller. When the d values become smaller, the result will be good between two (query video and database video) and hence the results will be greater when claimed. Where features are extracted from query video as well as dataset video and find the most similar video are retrieved from the database, which is near to query video contents and follow the most well-known equation (Euclidean distance measurement) that is most efficient distance measurement equation, which is proved through experimental results (Iqbal et al., 2018).
3.2. Testing and Performance Evaluation
After the successful design of the proposed research work, the performance has been evaluated and tested via the evaluation parameters. These parameters have shown different accuracy with respect to the desired seniors and expected outcomes. It is obligatory to test the proposed work. What if there still exist problems which need to be refined. The following are the parameters for the proposed work that has been used for analysis and evaluation perspectives.
3.2.1 Simulation Tool
The tool used for simulation in the proposed research is MATLAB which stands for MATrix LABoratory. MATLAB is created by math works for simulation and graphical user interface and using for animated types scenarios of the real work objects or scenarios. One of the best features of MATLAB is that it supports a high level of mathematical equations and some numerical statements which involve high math. For image processing, it has admirable features.
3.2.2 Performance Evaluation
Based on the proposed performance evaluation parameters the proposed work has been checked. For evaluation two parameters have been used as a core contribution. The performance evaluations have been thoroughly discussed in Section IV in the form of tabular and graphical representation.
3.2.3 Performance Evaluation Parameters
The given are the performance evaluation parameters that are used for the analysis and accuracy of the proposed research work.
3.2.3.1 Accuracy
Accuracy is a technique to characterize the classifier assessment and figure the presentation of the framework. Precision computes all right expectation perception isolated by the all-out perception number or genuine number, if characterization exactness is higher than the exhibition of the framework is better. Precision is determined by utilizing Equation 1.
3.2.3.2 Loss
The loss method is used to check the learning and testing procedures of profound neural systems. Misfortune is generally utilized in profound learning. Misfortune can be characterized as the normal «blunder» is the distinction between genuine and anticipated qualities.
3.3. Precision and Recall
Our system is evaluated on two metrics and recall. The most popular evaluated methods, these two techniques are used for the content-based video retrieval system. Precision P is calculated for the number of same elements retrieved and the number of elements retrieved from the database; it calculates the accuracy of the retrieval system. Recall R is calculated between the two values. The ratio between the number of correct elements retrieved and the total number of related elements that are presented in the database. Precision P and recall R are calculated by the following equations.
3.4. F-Measure
It calculates precision, mean, and recall calculating score. It supposes both the recall and precision of the system to test the f score. F score is very accurate and balanced recall and precision. It is implicit as a weighted normal of recall and precision. It is defined in Equation 3 as:
3.5. Mean square error
Mean square error (MSE) is a metric that fined the difference between the predicted values from the observed values between 0 and 1 in the analysis. The symbol of sigma in mathematics, the character that looks like E is called summation. That is the summation of all values, from start i=1 till n, through this we add all points from start to an end. For each point, we take the y is the predicted points for the ith observations, and the ‘y’ is the correct observed values for the ith observation. We subtract the correct observed values from the ‘y’ predicted values and calculate the square of the result. In the last to put the summation of all the (y – y’)² values, and divide it by n, n is the total number of videos in the database which will give the mean square error (Mathieu et al., 2015).
3.6. Dataset
We are using UCF101; this data set in the current time is a huge data set of human actions. They contain 101 classes of actions and 13k short clips and 27 hours of video data. This data set contains user-uploaded video and cluttered backgrounds. Moreover, this data set provides standard activity acknowledgment results on this new dataset utilizing the standard sack of words approach with the general execution of 44.5%. As far as we could possibly know, UCF101 is at present the most testing dataset of activities because of its enormous number of classes, countless clasps, and furthermore unconstrained nature of such clasps.
In this section, a thorough overview of the proposed model has been given along with the simulation tool and simulation performance parameters for evaluation and analysis. This section has given a complete idea that how the proposed work has been carried out by using the proposed simulation environment and parameters. In short, this section gave a thorough idea about the research methodology step by step. The research methodology is the core contribution of the proposed research work which is a simulation-based framework for achieving the results from the simulation.
4. Results and Discussion
In this section, a detailed discussion of the simulation results has been discussed. This section is consisting of simulation-based results in which each scenario has been explained with proper justification. These have been portrayed in the form of graphs and tables for better and clear understanding. Also, the evaluations have been debated with the other feature extraction models of the video retrieval system.
4.1. Experimental Setup
The proposed system is evaluated and tested on GeForce NVidia 8 GB dedicated GPU with window 10 operating system is installed. MATLAB is used as a simulation and programming tool which is best suitable for rapid prototyping.
Table 2. Experimental Setup
Name |
Configuration |
Operating System |
Microsoft Windows 10 |
Simulation Tool |
MATLAB |
Libraries |
Numpy, Time, SciPy, PyLab, Matplotlib, OpenCV |
Implementation Environment |
TensorFlow Keras |
Dataset |
UCF101 |
4.2. Dataset
We are using UCF101; in which data is organized in 101 groups, And 13320 videos from 101 categories, which is as of now the biggest dataset of human activities. It comprises 101 activity classes, this informational index comprises over 13k clasps and 27 hours of video information. The database contains sensible client transferred recordings containing camera movement and a jumbled foundation. Moreover, this informational index gives gauge activity acknowledgment results on this new dataset utilizing the standard sack of words approach with the general execution of 44.5%. Supposedly, UCF101 is right now the most testing dataset of activities because of its enormous number of classes, countless clasps, and furthermore unconstrained nature of such clasps.
Figure 5 shows the 101 actions of the UCF101 data set in a single frame. The border color of the frame specifies which action belongs to which category. Like human action interaction etc. and the label on the frame specifies which class the video belongs to or from whom that video belongs.
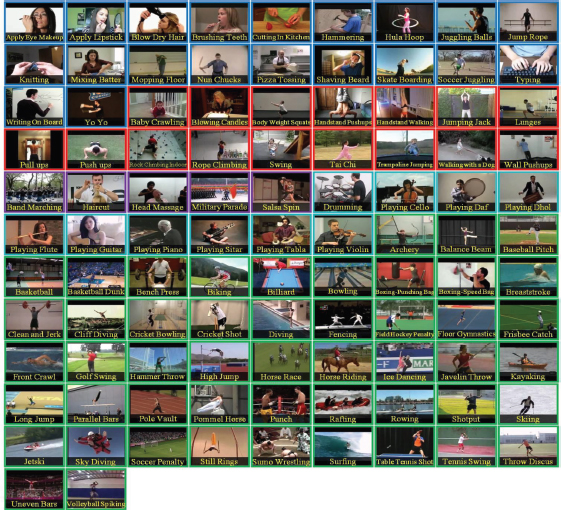
Figure 5. Visual Results of UCF101 dataset
The average length of the clips for each action is depicted in green.
Figure 6 shows that the total time of videos for each class is using blue bars and the average length for each class in green color. All clips have the same frame rate and resolution 320*240. And all files have the avi formats.

Figure 6. Total time of videos for each class is illustrated using the blue bars
The distribution of clip durations is illustrated by the colors.
The graph in Figure 7 shows the total number of clips in each class. The clips are distributed in colors. The colors in each bar show the duration of different clips in each class.
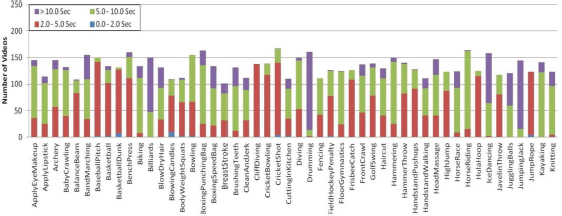
Figure 7. Number of clips per action class
4.3. Evaluation for the Proposed System
In the case of classification problems having only one classification accuracy might not give you the whole picture. So, Accuracy or loss is used to summarize the algorithm performance. Through the calculation of accuracy and loss, we find out where the system is wrong and where the system is right and which type of error coming into the system. An accuracy and loss are used to check the performance of a classification model on a set of test data for which the true values are known.
4.4. Results on UCF-101 Dataset
The UCF-101 dataset is the most testing one, incompletely because of the enormous volume of video and somewhat because of the high level of perspective varieties with which the video is gathered. This isn't basically an observation dataset rather the recordings were gathered to assess normal movement acknowledgment errands. Given an inquiry video, the goal is to recover a video of a similar movement independent of the perspective varieties, and changes in hues or surfaces, and so on. The recordings in this dataset were taken with shifting foundations, which make it a fine possibility for assessing the reasonableness of our technique. We extricated CNN highlights utilizing AlexNet from these pictures of the recordings and utilized them to recover the top-positioned video. The goal was to recover however many pertinent recordings as could be allowed. Figure 8 contains aftereffects of picked question recordings, where the furthest left video is the inquiry and the remaining are top-positioned video dependent on the separation between the question and the dataset video. Essentially, in inquiry 2, the best 6 pictures have been recovered accurately. In the third inquiry, applicable pictures were recovered at positions 2, 4, 5, 6, and 8, regardless of the way that there exists a tremendous divergence in their experiences. In the remainder of the inquiries, pertinent pictures were recovered at top positions which show the abilities of proposed highlights. Despite the fact that the outcomes on this dataset are not solid, we accept that if an all the more remarkable CNN model is utilized, these outcomes can be significantly improved.
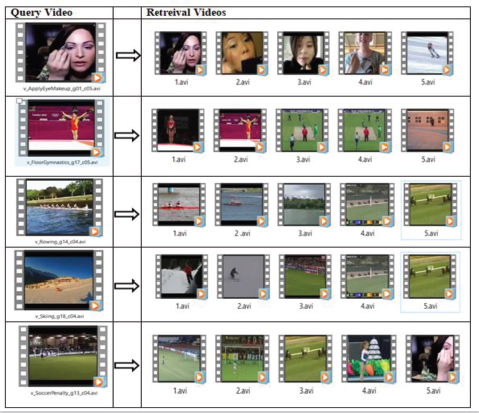
Figure 8. Retrieve result of FC6 on UFC101 Dataset
In figure 8 the experimental result on dataset UCF101 shows on one video 1, 2, 3, 4, and 5. It made 6 numbers of clusters for all videos. From the FC6 simulation result, we obtained 44% accuracy and 56% loss. This layer of the AlexNet model gives very poor performance.
In Figure 9 the experimental result on videos 1, 2, 3, 4, and 5. It made 6 numbers of clusters for all videos. From the FC7 simulation result, we obtained 60% accuracy and 40% loss. This layer of the AlexNet model gives poor performance. This 20% good than FC6.
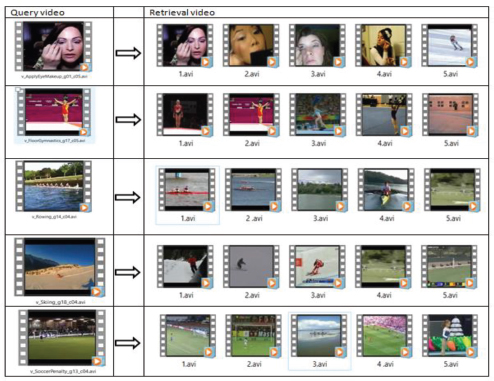
Figure 9. Retrieve result of FC7 on UFC101 Dataset
In Figure 10 the experimental result on videos 1, 2, 3, 4, and 5. It made 6 numbers of clusters for all videos. From the FC8 simulation result, we obtained 90% accuracy and 10% loss. This layer of the AlexNet model gives poor performance. The proposed method test on the UCF101 data set and give very good results on layer FC8.
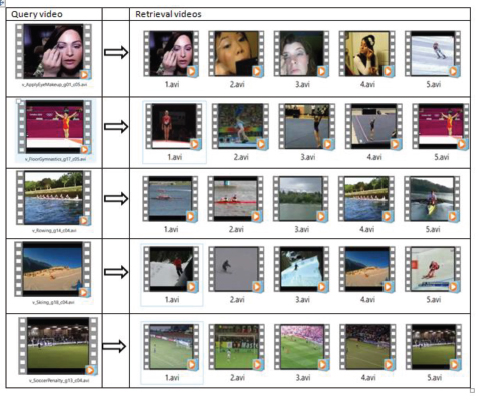
Figure 10. Retrieve result of FC8 on UFC101 Dataset
4.5. Retrieval Performance of Videos
The system performance is evaluated on the matching of input query and database query by subtracting the input query from the database query. The difference between the two videos found through the Euclidean distance formula. The keyframes are the head of the clusters. These keyframes applying the AlexNet model to extract features. For the performance evaluation, different types of videos are tested. For presentation, a different type of videos is acquired from UCF101 including shorts movies, military documentaries, music videos, and cartoon videos. The video length is 1-2 minutes. Different keyframes are selected from videos and save features in the feature vector. The redundant frames are skipped during the reading of videos. The same videos are searched on the selected keyframes. The experimental result on videos 1, 2, 3, 4, and 5 is divided by the total number of frames 164, 151, 300, 188, and 159 respectively. It made 6 numbers of clusters for all videos. From the FC6 simulation result we obtained 60% accuracy and 20% loss from video 1, 60% accuracy and 40% loss form video 2, 60 % accuracy and 40% loss form video 3, 40% accuracy and 10% loss form video 4, 40% accuracy and 60% loss form video 5. The experimental result on videos 1, 2, 3, 4, and 5 is divided by the total number of frames 164, 151, 300, 188, and 159 respectively. It made 6 numbers of clusters for all videos. From the FC7 simulation result we obtained 60% accuracy and 40% loss from video 1, 80% accuracy and 20% loss form video 2, 80% accuracy and 20% loss form video 3, 60% accuracy and 40% loss form video 4, 80% accuracy and 20% loss form video 5. The experimental results on videos 1, 2, 3, 4, and 5 are divided by the total number of frames 164, 151, 300, 188, and 159 respectively. It made 6 numbers of clusters for each video. From the FC8 simulation results, we have obtained 80% accuracy and 20% loss from video 1. Similarly, 90% accuracy and 10% loss from video 2. 90% accuracy, and 10% loss from video 3. 90% accuracy, and 10% loss from video 4. And 90% accuracy and 10% loss from video 5. Table 3 is regarding the accuracy comparison of FC8 with FC7 and FC.
Table 3. Accuracy Comparison of FC8 with FC7 and FC6
Model Name |
Video_1 Accuracy in %age |
Video_2 Accuracy in %age |
Video_3 Accuracy in %age |
Video_4 Accuracy in %age |
Video_5 Accuracy in %age |
Average Accuracy |
FC6 |
40 |
40 |
60 |
40 |
40 |
44% |
FC7 |
60 |
80 |
80 |
60 |
80 |
72% |
FC8 |
80 |
90 |
90 |
90 |
90 |
90% |
Note: The value of 44% in Table 3 is the model accuracy which is FC6 and 72% is the accuracy of FC7 whereas, 90% is the accuracy in average accuracy of the proposed model named FC8. In this sense, the FC8 is the proposed model which has given the highest accuracy as compared to FC6 and FC7.
The results of the proposed method on dataset UCF101 are shown in Figure 11. The retrieving of the same vides from different colors and having the same structure. Some of the different videos are also collected from the database. This is due to the same nature of th4e videos that are similar to the input query.
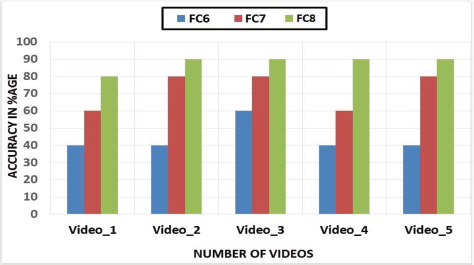
Figure 11. Comparison of FC8 (the proposed model) with FC7 and FC6
Note: The Figure 11 actually illustrates the overall accuracy in percentage of the proposed model FC8 in comparison with the FC6 and FC7. 5 videos have been executed in which each accuracy has been generated from which the proposed model FC8 has given highest accuracy in all scenarios.
In Figure 11 shows the results of all three layers in the term of accuracy. We have evaluated the precession and recall. We have got 40% accuracy on fc6, and 60% accuracy on fc7, and 90% accuracy on Fc8. The accuracy graph Figure 4.8, shows that the retrieval performance of our proposed method is better than the other state-of-the-art methods. Hence, it is clear from these results that the proposed algorithm outclasses existing techniques by a significant margin.
4.6. Loss of Model layers in terms of MSE
Mean Square Error (MSE) is a metric that fined the difference between the predicted values from the observed values between 0 and 1 in the analysis. The symbol of sigma in mathematics, the character that looks like E is called summation. That is the summation of all values, from start i=1 till n, through this we add all points from start to an end. For each point, we take the y is the predicted points for the ith observations, and the y’ is the correct observed values for the ith observation. We subtract the correct observed values from the y predicted values, and calculate the square of the result. In the last to put the summation of all the (y-y’)² values, and divide it by n, n is the total number of videos in the database which will give the mean square error. In table 4 shows the results of the mean square error of layers fc6, fc7, and fc8 with corresponding videos.
Table 4. MSE of Layers FC6, FC7, and FC8
Model Layer |
MSE |
FC6 |
0.7 |
FC7 |
0.6 |
FC8 |
0.2 |
Note: The value of MSE is actually the error in which the lowest error value denotes that the model has performed well. In Table 4, the values of MSE are illustrated in which the FC6 has 0.7, FC7 has 0.6 and FC8 has the MSE of 0.2. This means that the lowest error ratio is shown by FC8 which is better as compared to other FC6 and FC7.
Mean square error towards 1 is means a high error in the model while 0 gives a low error. In the given table fc6 gives 0.7 error its mean high error. Fc7 and give 0.6 errors which are one point low than fc6. And fc8 gives 0.2 errors its mean give a very low error. With the state of the art techniques, the fc8 results are very good in performance.
4.7. Precision and Recall
Our system is evaluated on two metrics and recall. The most popular evaluated methods, these two techniques are used for the content-based video retrieval system. Precision P is calculated for the number of same elements retrieved and the number of elements retrieved from the database; it calculates the accuracy of the retrieval system. Recall R is calculated between the two values. The ratio between the number of correct elements retrieved and the total number of related elements that are presented in the database.
4.8. F-Measure
Through the f score, we calculate precision and recall measuring scores. It calculates more accurately the results of precision and recall. It defines the ratio between precision into recall and precision plus recall into two. F-score is a more accurate and balanced value of recall and precision. After the calculation of the f-score, we get the values which are given in Table 5.
Table 5. Precision, Recall, and F score evaluation comparison of three layers
|
FC6 |
FC7 |
FC8 |
||||||
Video |
Precision |
Recall |
F score |
precision |
Recall |
F score |
precision |
Recall |
F score |
1 |
0.40 |
0.20 |
0.16 |
0.60 |
0.30 |
0.40 |
0.80 |
0.40 |
0.53 |
2 |
0.40 |
0.20 |
0.16 |
0.60 |
0.30 |
0.40 |
1.00 |
0.50 |
0.76 |
3 |
0.60 |
0.30 |
0.40 |
0.60 |
0.30 |
0.40 |
1.00 |
0.50 |
0.76 |
4 |
0.60 |
0.30 |
0.40 |
0.80 |
0.40 |
0.53 |
1.00 |
0.50 |
0.76 |
5 |
0.60 |
0.30 |
0.40 |
0.80 |
0.40 |
0.53 |
1.00 |
0.50 |
0.76 |
Table 5 shows the simulation results of three layers in terms of precision, recall, and F-score. In the above table, every layer is five videos such as 1, 2, 3, 4, and 5 each video are precision, Recall, and F-Score values of every layer. On five videos fc6, fc7, and fc8 give the above mention values in the table; the Fc6 layer obtained precision value 0.60, Recall 0.30, and F-Score 0.40. Similarly, the fc7 layer obtained precision value 0.80; Recall value 0.40 and F-score values are 0.53 respectively, while Fc8 obtained precision values 1.00, Recall values 0.50, F-score values are 0.76. Furthermore, the proposed Alex Net Fc8 layer achieved the highest values of precision, Recall, and F-Score.it is observed that the precision value of the proposed AlexNet Fc8 layer is better than other Fc6 and fc7 layers.
Furthermore, in figure 4.10 the proposed Alex Net Fc8 layer achieved the highest values of precision, Recall, and F-Score.it is observed that the precision value of the proposed AlexNet Fc8 layer is better than other Fc6 and fc7 layers. Because fc6 and fc7 give low precision and recall values and fc8 get a high value towards 1. When precision and recall value near one it shows that the system performance is better. Figure 12 is regarding the performance of proposed AlexNet layer-based Confusion matrix.
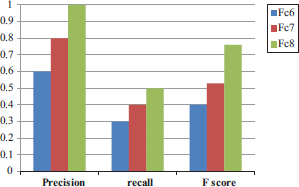
Figure 12. performance of proposed Alex net layer-based Confusion matrix
4.9. Time Complexity Performance
The proposed system is evaluated and tested on GeForce NVidia 8 GB dedicated GPU with Windows 10 operating system is installed. MATLAB is used as a simulation and programming tool which is best suitable for rapid prototyping.
Table 6. Time Complexity.
Video No |
Total Number of Frames |
Number of cluster Frames |
Time on GPU |
1 |
164 |
6 |
1186 sec |
2 |
151 |
6 |
1120 sec |
3 |
300 |
6 |
1471 sec |
4 |
188 |
6 |
1232 sec |
5 |
159 |
6 |
1594 sec |
Figure 13 shows the time of videos taken on GPU testing. From the first video checked total numbers of frames are 164 and take six frames as keyframes and takes a total time of 1186 seconds. From the second video checked total numbers of frames are 151 and take six frames as keyframes and takes a total time of 1120 seconds. From the third video checked total numbers of frames are 188 and take six frames as keyframes and takes a total time of 1471 seconds. From the fourth video checked total numbers of frames are 188 and take six frames as keyframes and takes a total time of 1232 seconds. From the fifth video checked total numbers of frames are 159 and take six frames as keyframes and takes a total time of 1594 seconds.
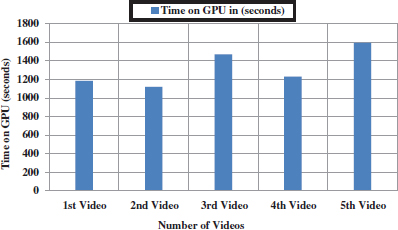
Figure 13. Performance of Proposed Method on GPU
4.10. Training and testing of the proposed system
Training and testing is the major and key aspect in the CBVR system in which the real-time concept is used for the requirements of the recently taken datasets to be generated the needy output. This system is especially and particularly utilized in YouTube/Dailymotion etc. for the last two decades in which many related videos are displayed because of the contents in the queried videos. This is actually the activity of the searched video which results to display several related videos in which the same not exact copy but somehow similar activities are taking place. First of all the data are taken and then trained for testing but it is a broad term. In some systems, the data are stored in their databases i.e., pre-stored data in which the feature models do exist. In the new FV (Feature Vector) system the features are saved of the dataset and then this is tested against the mentioned dataset. Now, if we take a dataset that will need training and then that new dataset will be taken accordingly. These two datasets will be tested against each other in the current scenario for further processing. In other words, the new data will be taken and then tested in an efficient and effective manner with respect to the desired task. The proposed CBVR is a real-time system which needs no pre-data storage or taking data from the database. This system is actually taken the dataset as input which is trained and then it is tested. It can take new queries for that data to be processed. The data is tested against the recent taken data due to the real-time nature of the proposed system. The new queries are used for searching for the data that is taken as input. The queries are actually used for searching in the existing database to find train/test the required data. Due to this nature of real-time, there we’ve not taken training & testing. The most and key factor by not taking the data for training and testing especially for storing is that this is a REALTIME system in which only the recent data are processed and it generates the required output/result from that data. Table 7 is regarding the Illustration of FC6, FC7 & FC8 with Units, Weights, and Connections.
Table 7. Illustration of FC6, FC7 & FC8 with Units, Weights, and Connections
Layer |
Units |
Weights |
Connections |
FC6 |
1000 |
4,096,000 |
4,096,000 |
FC7 |
4096 |
16,777,216 |
16,777,216 |
FC8 |
4096 |
67,108,864 |
67,108,864 |
|
Total |
87,982,080 |
|
4.11. Evaluation & Justification of FC6 and FC7 with FC8 Layer
FC stands for Fully Connected in the given expression which is a layer in the CNN for feature extraction providing an appropriate arrangement for segregation and classification process of images and other associated contents in the videos etc. FC6, FC7, and FC8 are layers that have diverse features in contrast with one another that is achieved by the required task. In short, these are the levels of fully connected layers as mentioned 6, 7, and 8 which denote that each level has an improvement as compared to the second last one. FC7 is an improved and extension of FC6 and FC8 is an improved and extension of FC7. In the FC6 layer, there exist units which connect it with additional features to be carried out. For the fully connected layers, let Ni, Pi, and Ui be the number of output units, parameters (weights), and connections of layer Li.
FC6 Layer:
N6=1000 units. P6 = U6 = 4096*1000 = 4,096,000.
FC7 Layer:
N7 = 4096 units. P7 = U7 = 4096*4096 =16,777,216.
FC8 Layer:
N8 = 4096 units. (Max pooling: input 13/2 = 6) N8 = 4096; P8 = U8 = 8*8*256*4096 = 67,108,864.
Notice that the number of parameters is much larger for these layers than the convolutional ones.
Overall, AlexNet has about 660K units, 61M parameters, and over 600M connections.
Notice: the convolutional layers comprise most of the units and connections, but the fully connected layers are responsible for most of the weights. More modern networks can do better with fewer parameters (e.g., GoogLeNet).
From the above explanation and justification, it has been revealed that FC8 Layer is much more effective than the other FC6 and FC7 Layers. Due to a high number of units, weights and connections FC8 layer has high accuracy and low loss and therefore this layer has given the best results in the entire scenario. After a successful simulation from MATLAB, the proposed model AlexNet FC8 has shown outstanding performance in contrast with FC6 and FC7. The accuracy of FC8 is greater in percentage as compared to FC6 and FC7. Furthermore, the loss of video retrieval is also much less as compared to the existing models. The proposed model FC8 has shown the best results which are considered the excessively best among other models as mentioned.
5. Conclusion
In this work, we have proposed a new technique through which we extract the feature of contents from videos. For video retrieval, the color histogram of the video is stored in the feature vector and calculating the color histogram of selected frames. Keyframes are selected through the k-mean algorithm. From the keyframes, we are extracting color histogram features through the AlexNet model of CNN. The proposed approach is fundamentally very powerful because of the less consumption of time. The results of the system calculated through the Euclidean distance equation. The value of input query subtracting from the database query. The lowest values become the topmost result. The performance was evaluated on the equation of accuracy and loss. While the recent methods have the ability to process millions of videos in a very short time duration. The contribution is the core achievement in research which denotes the role and character in the desired field of study. In this research, the main contribution is the implementation of the color histogram and AlexNet that were not implemented with the existing work. To the best of our knowledge, this is the first attempt that has been conducted on video retrieval systems for the extraction of features from video files rather than text files. By applying color histogram and AlexNet the proposed work have given above 90% accuracy which is considered outstanding in contrast with the existing state of the art solutions. Another main and key contribution is the evaluation based on the performance parameters for improvement in the existing work by modifying and generating the alternative results and in the end, these were then compared with proper justification.
Color-Based approaches have been suggested in this research but the enhancement of content-based video retrieval and video organization processes still has a very long research area. A content-based video retrieval system has more gaps for research. Some suggestions for a future research study are being provided in the field of CBVR.
1. The framework we used in the selected technique for the analysis of the color histogram may be increased in different directions or on a different scale to get more accuracy in the CBVR.
2. The color histogram features are very light and sample, in the future, better feature analysis techniques can be used to get better results.
3. A good method of similarity measure can be used to get more accuracy because the Euclidean distance is a very easy method for similarity measures.
Conflicts of Interest
Authors declare no conflict of interest.
References
Asha, D., Y. M. Latha, and V. S. K. Reddy. 2018. Content based video retrieval system using multiple features. Int. J. Pure Appl. Math.(IJPAM), 118(14), 287–294.
Bolettieri, P., F. Carrara, F. Debole, F. Falchi, C. Gennaro, L. Vadicamo, and C. Vairo, 2019. An image retrieval system for video. In International Conference on Similarity Search and Applications (pp. 332–339). Springer, Cham.
Chen, X., Y. Zhang, Q. Ai, H. Xu, J. Yan, and Z. Qin. 2017. Personalized key frame recommendation. In Proceedings of the 40th International ACM SIGIR Conference on Research and Development in Information Retrieval (pp. 315–324). ACM.
El Ouadrhiri, A. A., E. M. Saoudi, S. J. Andaloussi, O. Ouchetto, and A. Sekkaki. 2017. Content based video retrieval based on bounded coordinate of motion histogram. In 2017 4th International Conference on Control, Decision and Information Technologies (CoDIT) (pp. 0573–0578). IEEE.
Han, S, J, Pool, J. Tran and W. Dally, 2015. Learning both weights and connections for efficient neural network. In Advances in neural information processing systems (pp. 1135–1143).
Iqbal, S., A. N. Qureshi, and A. M. Lodhi. 2018. Content Based Video Retrieval Using Convolutional Neural Network. In Proceedings of SAI Intelligent Systems Conference (pp. 170–186). Springer, Cham.
Jones, S., and L. Shao. 2013. Content-based retrieval of human actions from realistic video databases. Information Sciences, 236, 56–65.
Lingam, K. M., and V. S. K. Reddy. 2019. Key Frame Extraction Using Content Relative Thresholding Technique for Video Retrieval. In Soft Computing and Signal Processing (pp. 811–820). Springer, Singapore.
Mathieu, M. C. Couprie, and Y. LeCun. 2015. Deep multi-scale video prediction beyond mean square error. arXiv preprint arXiv: 1511.05440.
Rossetto, L., I. Giangreco, H. Schuldt, S. Dupont, O. Seddati, M. Sezgin, and Y. Sahillioğlu. 2015. IMOTION—a content-based video retrieval engine. In International Conference on Multimedia Modeling (pp. 255–260). Springer, Cham.
Sedighi, V., and J. Fridrich. 2017. Histogram layer, moving convolutional neural networks towards feature-based steganalysis. Electronic Imaging, 2017(7), 50–55.
Sikos, L. F. 2018. Ontology-based structured video annotation for content-based video retrieval via spatiotemporal reasoning. In Bridging the Semantic Gap in Image and Video Analysis (pp. 97–122). Springer, Cham.
Song, J., H. Zhang, X. Li, L. Gao, M. Wang, and R. Hong. 2018. Self-supervised video hashing with hierarchical binary auto-encoder. IEEE Transactions on Image Processing, 27(7), 3210–3221.
Thanh, T. M.,P.T Hiep, T.M Tam and K. Tanaka, 2014. Robust semi-blind video watermarking based on frame-patch matching. AEU-International Journal of Electronics and Communications, 68(10), 1007–1015.
Tarigan, J. T., and E. P. Marpaung. 2018. Implementing Content Based Video Retrieval Using Speeded-Up Robust Features. International Journal of Simulation–Systems, Science & Technology, 19(3).
Zhang, C., Y. Lin, L. Zhu, A. Liu, Z. Zhang, and F. Huang, 2019. CNN-VWII: An efficient approach for large-scale video retrieval by image queries. Pattern Recognition Letters, 123, 82–88.
Author’s Biography

Altaf Hussain received his MS and BS Degrees in Computer Science from The University of Agriculture Peshawar, Pakistan (2017) and University of Peshawar, Pakistan (2013), respectively. He worked at The University of Agriculture as a Student Research Scholar from 2017-2019. During his MS Degree he has completed his research in Computer Networks especially in Routing Protocols in Drone Networks. His recent approach is PhD in Computer Science & Technology. He has served as a Lecturer in Computer Science Department in Govt Degree College Lal Qilla Dir L, KPK Pakistan from 2020-2021. He has published many research papers including survey/review and conference papers. He was Research Scholar in (Career Dynamics Research Academy) Peshawar, Pakistan for one and a half year. Currently he is working as a Research Assistant in the Department of Accounting & Information Systems, College of Business and Economics, Qatar University. His research specialties/interests include Wireless Networks, Sensor Networks, and Unmanned Aerial Vehicular Networks.

Mehtab Ahmad received master’s degree in Computer Science in 2020 from Institute of Computer Science & IT (ICS/IT), The University of Agriculture Peshawar, Pakistan. He worked at The University of Agriculture as a Student Research Scholar from 2017-2019. During his MS Degree he has completed his research in Deep Learning with AlexNet especially in Content based video retrieval. His recent approach is PhD. His research interest includes Wireless Computing, Deep Learning, Image Processing, and Big Data.

Tariq Hussain received his MS and BS Degrees in Information Technology from the Institute of Computer Sciences and Information Technology The University of Agriculture Peshawar, Pakistan (2019), and University of Malakand, Pakistan (2015) respectively. He has published many research papers in the area of Computer Networks. Currently he is a Doctoral Student at School of Computer Science and Information Engineering, Zhejiang Gongshang University China. His research interests are the Internet of Things, 3D Point Cloud, Big Data, Data analytics and AI.

Ijaz Ullah ris working as a visiting Lecturer with the Department of Computer Science, University of Swabi, Swabi Pakistan. He has completed his Bachelor degree in Computer Science from University of Peshawar, Pakistan and Master Degree from EIT Digital Master School. EIT Digital Master School provides dual degrees. So, he got Master in Cloud Computing from University of Rennese 1 France and ICT Innovation degree from Technical University of Berlin Germany. His research interest includes Cloud Computing and Networks.