
Regular Issue, Vol. 11 N. 1 (2022), 45-63
eISSN: 2255-2863
DOI: https://doi.org/10.14201/adcaij.27348
|
ADCAIJ: Advances in Distributed Computing and Artificial Intelligence Journal
Regular Issue, Vol. 11 N. 1 (2022), 45-63 eISSN: 2255-2863 DOI: https://doi.org/10.14201/adcaij.27348 |
Analysis of Sentiments on the Onset of COVID-19 Using Machine Learning Techniques
Vishakha Aryaa, Amit Kumar Mishrab, Alfonso González-Brionesc,d,e
a,b School of Computing, DIT University, Dehradun 248009, India
c Research Group on Agent-Based, Social and Interdisciplinary Applications (GRASIA), Complutense University of Madrid, 28040 Madrid, Spain
d BISITE Research Group, University of Salamanca. Calle Espejo s/n. Edificio Multiusos I+D+i, 37007, Salamanca, Spain
e Air Institute, IoT Digital Innovation Hub, Calle Segunda 4, 37188, Salamanca, Spain
vishakha.27arya@gmail.com, aec.amit@gmail.com, alfonsogb@ucm.es
ABSTRACT
The novel coronavirus (COVID-19) pandemic has struck the whole world and is one of the most striking topics on social media platforms. Sentiment outbreak on social media enduring various thoughts, opinions, and emotions about the COVID-19 disease, expressing views they are feeling presently. Analyzing sentiments helps to yield better results. Gathering data from different blogging sites like Facebook, Twitter, Weibo, YouTube, Instagram, etc., and Twitter is the largest repository. Videos, text, and audio were also collected from repositories. Sentiment analysis uses opinion mining to acquire the sentiments of its users and categorizes them accordingly as positive, negative, and neutral. Analytical and machine learning classification is implemented to 3586 tweets collected in different time frames. In this paper, sentiment analysis was performed on tweets accumulated during the COVID-19 pandemic, Coronavirus disease. Tweets are collected from the Twitter database using Hydrator a web-based application. Data-preprocessing removes all the noise, outliers from the raw data. With Natural Language Toolkit (NLTK), text classification for sentiment analysis and calculate the score subjective polarity, counts, and sentiment distribution. N-gram is used in textual mining -and Natural Language Processing for a continuous sequence of words in a text or document applying uni-gram, bi-gram, and tri-gram for statistical computation. Term frequency and Inverse document frequency (TF-IDF) is a feature extraction technique that converts textual data into numeric form. Vectorize data feed to our model to obtain insights from linguistic data. Linear SVC, MultinomialNB, GBM, and Random Forest classifier with Tfidf classification model applied to our proposed model. Linear Support Vector classification performs better than the other two classifiers. Results depict that RF performs better.
KEYWORDS
sentiment analysis; COVID-19; TF-IDF; Linear SVC; machine learning; NLTK; GBM; random forest
1. Introduction
On 31 December 2019, the clusters were reported by the Chinese authority a new strain coronavirus (novel coronavirus, nCoV) was identified. It is a large family of viruses that causes illnesses like cold, Severe Acute Respiratory Syndrome (SARS-CoV), and also Middle East Respiratory Syndrome (MERS-CoV). The novel Coronavirus disease of 2019 (COVID-19) subsequently named Severe Acute Respiratory Syndrome Coronavirus 2 (SARS-CoV-2) discovered in the city named Wuhan, Hubei Province, China, in December 2019. The COVID-19 then speedily reached different parts of China and then the whole world. On Jan 20, China confirmed the human transmission of novel coronavirus. The WHO declared the outbreak as a pandemic (Kemp S., 2021). As of May 2020, 221 countries have reported more than 126 million people suffered from coronavirus worldwide, 21.7 million active cases, 102 million people have recovered till now and, 2.7 million people have lost their lives (Worldometers 2020). Whereas in India, 11.9 million (confirmed cases), 10.4 million (recovered), and 161 thousand (deaths). A heat map of the most impacted countries worldwide plotted on the total number of confirmed cases of COVID-19 (Figure 1).
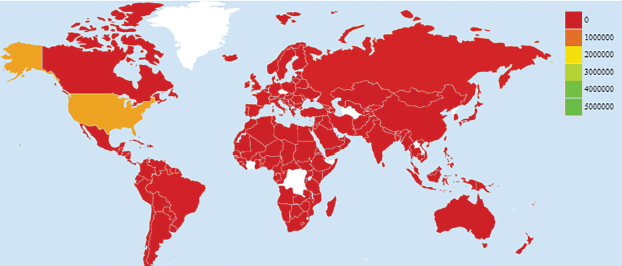
Figure 1. Heat map of confirmed COVID-19 cases Worldwide
To end this pandemic an important countermeasure is «lockdown» globally imposed by all the countries worldwide as a safety measure. Some new measures implemented like social distancing in crowded areas, mask to cover nose and mouth, wash hands frequently and portable hand sanitizers, minimum 6 feet distance in grocery stores, avoid touching face and maintaining distance with an affected person. Avoid closed spaces, close contact, and crowded place: 3CS. The usual symptoms of the coronavirus are fever, cough, tiredness, and difficulty in breathing. Other symptoms are loss of smell and taste, headaches, body pain, nasal congestion, skin rashes, etc. Figure 2 shows the symptoms of coronavirus in the below graph. To keep you healthy, avoid going outside only (if necessary), eat healthy food, do yoga, meditation and quitting tobacco. Lockdown created distress among people like job loss, starvation, financial distress, suicides, accidents due to migration, alcohol, exhaustion, etc.
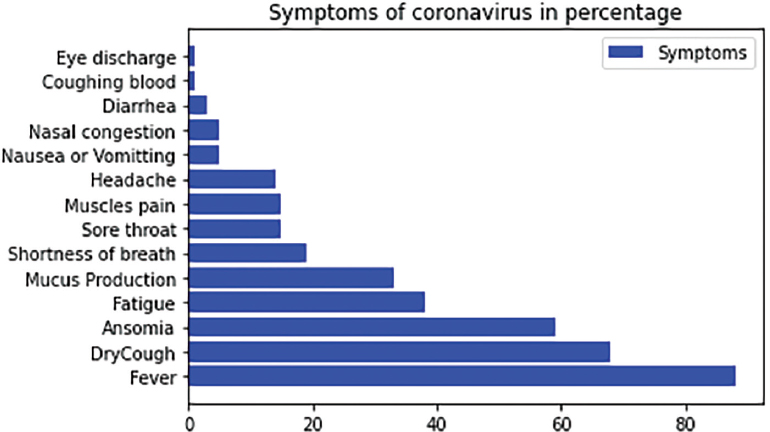
Figure 2. Various symptoms of the coronavirus disease
Pandemic has created a kind of physiological and emotional imbalance which affects the stability of the mind. It is very common between different age groups (students, employees) and is a serious health concern of the mental state (Hatton et al., 2019). With the expansion of different social media platforms (Weibo, Twitter) people enabled to share their emotions whether good or bad. Nowadays, mental stress is an especially major concern among the young generation and they are suffering from ample stress (Ramalingam et al., 2019). Growth in stress shows symptoms like anxiety, unmotivated, irritability, restlessness, sleep disorders, and poor diet. Technology advancement, such as digital media, smartphones, blogs, social networks, video conferencing influences researchers to retrieve huge data sets for analysis. For emotional identification, Emotion artificial intelligence is ongoing research in the area of text analysis. With the growth of digital media, datasets are available in both text and images for sentiment analysis (Tate et al., 2020). Based on the keywords word-list user's tweets are being classified as negative or neutral, which helps to detect depression. Globally text messages widely used form of communication. For Emotion Artificial Intelligence, textual data is being used for data analysis and to detect sentiments using various ML techniques (Raichur et al., 2017).
As ML is a vigorous technique emerged to analyze these data. ML uses advanced statistical and probabilistic techniques to build intelligent systems having the capability to automatically learn from the data. Machine Learning is efficient in analyzing big datasets generated from various sources. In the 1950s ML, the term theoretically referred to by Allan Turing and named by Arthur Samuel and is being used in various fields including medical health since the 1990s. ML is providing benefits to various fields, includes medical diagnosing, voice and speech recognition, image recognition, and NLP, which allow researchers to retrieve valuable information from datasets, and built an intelligent System (Khan et al., 2014). In health fields such as bioinformatics, ML shows notable advances by analyzing complex data. Researchers are using ML techniques for diagnosing mental illness (Vuppalapati et al., 2018). In the mental health sector, majorly five conventional ML algorithms are used, Support Vector Machines (SVM), Random Forest (RF), K-Nearest Neighborhood (KNN), Gradient Boosting Machine (GBM), and Naive Bayesian (NB). Reviewing literature survey states that Support Vector Machines (SVM), Gradient Boosting Machine (GBM), Random Forest, and Naive Bayesian, used in mental health area (Pranckevicius and Marcinkevicius, 2017). The purposes of Machine Learning techniques are to examine the datasets and retrieve vital information. Mainly, Supervised and Unsupervised learning is used in the health sector. Reinforcement learning (RL) is also a type of learning used for the analysis of data.
COVID-19 has become a global concern for different groups, governments, and organizations to discuss subjects related to the pandemic communicating over social media. People share their opinion, distrust, anger, hope, sadness, and other feelings during the lockdown. Some parts of the world show more distrust than others. Lockdown created panic situations losing jobs, starvation, migration, fear of losing loved ones, and fear of death, emotions shared by people on the social media platform (Shatte et al., 2019). Twitter is one of the largest platforms where people share their daily basis worldwide. In this research, the COVID-19 Twitter dataset collected from https://ieee-dataport.org/ contains Twitter ids later hydrated using Hydrator web-based application. Text accumulated from April 2020 during lockdown to analyze the sentiments of people going through this period. Keywords like #COVID-19, #unemployent #covid19 used to collect the textual data. Natural Language Processing (NLP) analyzes the sentiments of tweets and classifies them as positive, negative, or neutral. It helps to make a faster and more accurate decision (Baheti et al., 2019). Sentiment analysis was performed on Tweets retrieved from the Twitter database (Samuel et al., 2020). N-grams feature extraction from a text or documents applied uni-gram, bi-gram, tri-grams, and n-grams. Data pre-processing is to clean the noise from data removing punctuation, stopwords, etc. NLP is applied to subjective tweets rather than objective and classifies them as positive, negative, or neutral. Linear SVC, MultinomialNB, GBM, and Random Forest classification implemented to the model, depicts RF performs better (Subhani et al., 2017). The remaining structure of the paper follows: Section 2 briefs the literature survey, Section 3 describes the motivation and objectives of the proposed model, Section 4 describes the overview of the framework of the proposed model, Section 5 explains the experimental process and the results of the proposed system, and Section 6 summarizes conclusion and future work.
2. Literature Survey
Analyzing sentiments and making decisions has become a challenging job with enormous data generated by users from diverse web sources. Clinicals, psychologist and sociologist concerned about the mental state of a person way of thinking, mood, their opinions, and emotions will find the solution to reach a better conclusion. (Ahuja and Banga, 2019) illustrates on Mental Stress detection on students using Machine Learning techniques perform analysis on students to examine stress at different levels on college students. Exams and recruitment stress also examine the time they spent on the internet. (Yazdavar et al., 2018) using online data predicts Mental stress analysis aim to predict the depressive behavior using big-modal based on online data particularly, implementing statistical method using heterogeneous data features like images and content, and build intelligent models to analyze depressed symptoms of a person. (Ramalingam et al., 2019) analyses Depression using Machine Learning Techniques using a large dataset for analysis of common behavior among depressing people. It helps to determine the person's needs and emotions able to detect its suicidal tendency. (Cho et al., 2019) reviewed Machine Learning Algorithms for diagnosing mental illness using various techniques and to find the best model. It also provides information about the limitation and properties of ML algorithms in the mental health sector. (Aldarwish et al., 2017) analyses the level of depression using social media posts and to collect user’s posts from SNS and classify posts according to their mental health levels and create an intelligent model using SVM, and Naive Bayes classifiers that classify users content. (Stolar et al., 2018) illustrates using speech recognizing techniques for detecting adolescent depression from speech improves classification rates of depression compared to the parameter of best individual roll-off. It is most effective for the acoustic spectral feature. (Deshpande et al., 2017) illustrates emotion detection using Emotion Artificial Intelligence to analyze Depression level, particularly in content analysis. For conducting emotion analysis NLP applied to users Twitter content focusing on depression. Classifiers used are SVM and Naïve-Bayes (NB). (Nguyen et al., 2014) illustrates the study of characteristics of (CLINICAL) from content analysis online communities which aim in comparing with other communities. It uses statistical techniques and ML to compare online messages between both communities using content generated by online communities. (Calderon et al., 2018) used ML techniques to predict Suicidal Tendency propose a simulation of the dataset generated; the data shows the adolescent/young population with suicidal tendency. It uses a supervised ML algorithm to analyze the suicidal tendency of adolescents in a better way. (Troussas et al., 2013) used a Naïve Bayes classifier for sentiment analysis on Facebook status using for language learning it may be positive, negative, or neutral. They explore a different method to represent the data unigram model and perform cross-validation. (Hussain et al., 2015) builds a predictive model based on SNS for depression regarding data MDD (Major Depressive Disorders). It is based on the questionnaire techniques such as CESD-R and Beck Depression Inventory (BDI). Classify user status as displayer and non- displayer. (Dubey, 2020) illustrates Sentiment analysis of tweets has been done in twelve countries to analyze the sentiments during the lockdown. However, a positive approach throughout the world and some countries show more distrust, fear, and anger the US, France, Netherlands, and Switzerland than other countries. (Bania, 2020) implemented Sentiment analysis on tweets collected from different time frames statistical and machine learning techniques on 40,000 tweets collected using Tweepy API. Tweets are classified into three categories positive, negative and neutral. TF-IDF is used to extract features and applying grams. Multiple classification algorithms are applied to the data and find out the best fit classifier model. (Desai et al., 2016) illustrate the detailed analysis of sentiments techniques on unstructured Twitter data comparative study based on techniques of different identified parameters. (Das et al., 2018) compared both text sentiment classification used techniques TF-IDF and TF-IDF Next Word Negation. Also, applied different text mining algorithms, and LSVM performed better. (Alamoodi et al., 2021) shows a detailed and comparative analysis of disease, outbreaks, and pandemic occurred in the last ten years. Review categories into four: lexicon method, machine learning, hybrid models, and individual models. Different patterns were observed and articles were identified and grouped accordingly. This study affirms opportunities for future research in related areas. (Rathi et al., 2018) approaches to analyzing these posts using NLP subjective posts are classified as positive, negative, or neutral. Improve the potency of the model by combining SVM and Decision tree to attain better accuracy. We have reviewed (n=40) research papers for detecting mental illness using different ML techniques. The research papers have been collected from PubMed, Google Scholar, Science Direct, Conference Papers, and Journals. Keywords used to select paper diagnosing mental illness, sentiment analysis, depression, and machine learning. All these studies depict stress detection using Social media posts like Twitter, Facebook, clinical records, and Biosensors like HRV, ECG, and EEG.
3. Objective
Reviewing the literature survey, researchers have implemented various sentiment analysis models or studies in the direction of pandemic and epidemic. The whole world is grappling with COVID-19 disease, which has affected the mental health of several people worldwide, and now it is the most concerned topic to consider. Levels of anxiety, fear, social distancing, and isolation impacted mental health. Mental depressive disorder (MDD), also known as «clinical depression» is the world's most common mental disorder. Opinion mining or sentiment analysis is a method of text classification in which thoughts, opinions, and expressions shared by people on social media sites are retrieved, analyzes, and categorize sentiments as positive, negative, and neutral. The objectives carried out in the research are as follows: Prepare dataset as tweets collected from https://ieee-dataport.org and a CSV file contains 5000 Twitter ids and sentiment score. Further, Twitter ids hydrated through a Hydrator web-based application and download the CSV file. Tokenization of tweets is the primary stage of text analysis. Removing noise from the dataset increases the efficacy of the model. Calculate the polarity of subjective tweets and classify them into positive, negative, and neutral. TF-IDF term frequency and inverse document frequency, feature extraction method used to convert the text into the numeric format. Further, N-grams were also applied to the dataset. Linear SVC, Multinomial, and Random Forest with TF-IDF classifier applied to train the model and evaluate to obtain accuracy.
4. Methodology
The proposed method is used for detecting sentiment from Tweets using Natural Language Processing (NLP). NLP is used to analyze sentiments of diverse datasets like tweets, reviews, surveys, etc. It is done on subjective text than on objective. The subjective text carries emotions, thoughts, feelings, or moods. Two approaches of sentiment analysis: The supervised approach and the unsupervised lexicon approach. Block diagram illustrates the methodology of the proposed system Data collection, Data pre-processing, and evaluation of classification model for sentiment analysis (Figure 3). Natural Language Toolkit (NLTK) is a python package used for sentiment analysis in the proposed system with its different processing libraries. Further, machine learning algorithms are applied to the proposed model to calculate the accuracy.
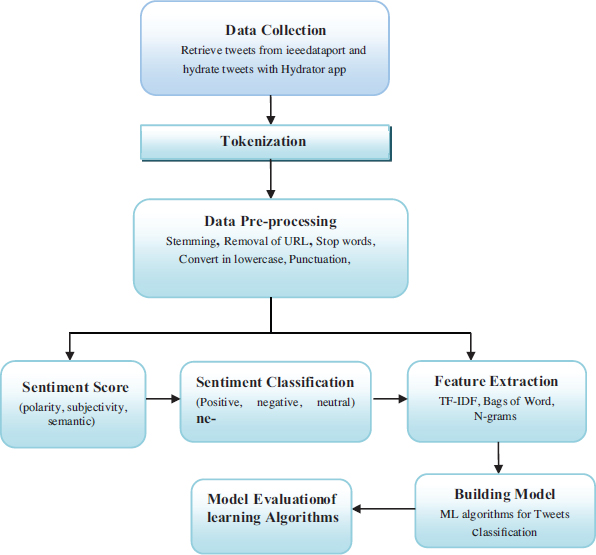
Figure 3. Architecture of the proposed model
4.1. Data Collection
A set of COVID-19 related tweets was extracted from April 2020 using the Hydrator application and downloaded into a CSV file. Tweets were collected during an outbreak of coronavirus disease to analyze the sentiments of people's opinions, thoughts, and expressions. Hydrator application extracting tweets using Twitter Ids displays all the information related to original Twitter Ids (Figure 4). Register on https://ieee-dataport.org/ download a CSV file containing Twitter Ids and sentiment score, then to fetch the Tweets from the Twitter database need to hydrate the Ids using Hydrator a web-based application. Relevant information is retrieved and stored in a CSV file. After hydrating, 3586 rows and 27 columns are extracted. File contains hashtags like #COVID_19 #Covid #unemployment etc, text, created at, re_tweets, source etc.
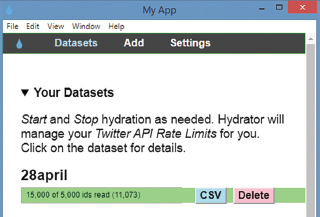
Figure 4. Hydrator application to extract tweets using Twitter Ids
4.2. Data Pre-processing
Pre-processing is a necessary step as raw tweets collected from the database have lots of noise, errors, missing values, URLs, punctuations, and outliers. Cleaning of raw data and removing missing values then extract the relevant features from the dataset. It ensures that the data is relevant and accurate. It improves the efficacy of the model. Pre-processing includes standardization, organization, and formatting of data. Pre-processing of the dataset is necessary before analysis transforms raw data to an understandable format. It removes noise data such as missing values, errors, and outliers. It follows Tokenization, data cleaning (removing URLs, punctuations, converting to lowercase, etc.), stopwords, stemming, and POS tagging. Table 1 shows tweets after pre-processing, the sentiments classified into positive, negative, or neutral.
Table 1. COVID-19 Twitter Dataset after pre-processing
|
Text |
Sentiment |
0 |
India coronavirus lockdown Stranded migrants c... |
1 |
1 |
RT ChrisTheJoumo We've updated our on applyin... |
1 |
2 |
Shri DasShaktikanta for taking in the suggest... |
1 |
3 |
Loaded up on SYM earlier Next COVID play |
1 |
4 |
Along with the COVID pandemic |
The upcoming hurricane season in the Caribbea... |
4.3. Word Cloud
It is a visualization technique of textual data in which highlighted and big size words have a higher frequency of occurrence. It is used to visualize and analysis of textual data from social media. It helps the analyzer to evaluate frequently occurring words and give exploratory text analysis. Figure 5 shows the word cloud of high-frequency words in pre-processed tweets.
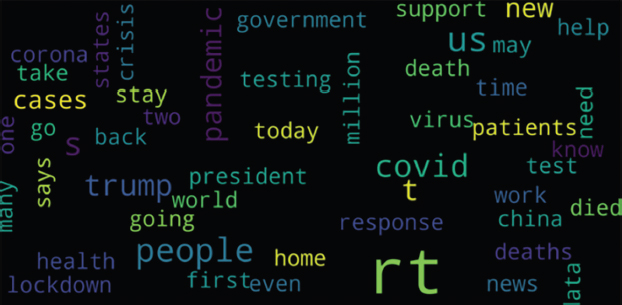
Figure 5. Wordcloud representation of Twitter data after pre-processing
4.4. Sentiment Analysis of COVID-19 Tweets
Emotions, sentiments, opinions, and expression are subjects of sentiment analysis. Sentiment analysis or opinion mining is used to analyze the intensity of emotion whether it's positive, negative, or neutral (Chancellor and De, 2020). VADER lexicon is one of the Python packages used for sentiment analysis. Lexicon Valence Aware Dictionary and Sentiment Reasoner (VADER) included in the NLTK package is an unsupervised lexicon method and rule-based used to detect the sentiment of social media sites. Tweets extracted from the Twitter database are classified under lexicon sentiment (words) labeled according to the semantic orientation positive, negative or neutral (Cavazos et al., 2016).
4.5. Subjective Polarity
VADER determines the subjective polarity of sentiment how much negative or positive a sentiment. SentimentIntensityAnalyzer() used as object and si.polarity_scores() used to give polarity he positive, negative, neutral, and compound score. If compound >0 is categorized as positive, compound<0 is categorized as negative, and compound=0 categorized as neutral sentiments. It gives the positive, negative, neutral, and compound scores (Figure 6). The compound score is a lexicon metric that calculates the sum of all positive and negative sentiments normalized between -1(negative) to +1 (positive). The graph depicts the scores counts of sentiments showing positive sentiments the most (Figure 7).
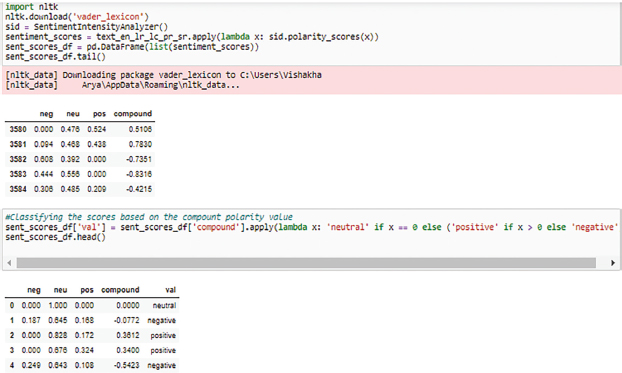
Figure 6. Polarity score of sentiments pos, neg, neutral and compound
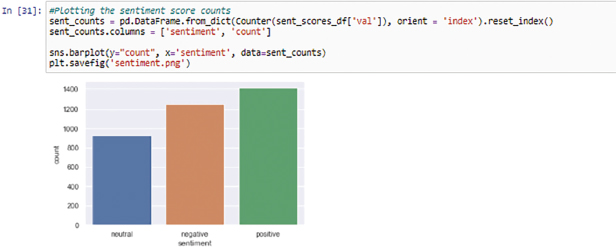
Figure 7. Scores count of sentiments
Normalization of sentiments results in the compound score. It adds more than one sentiment word in a sentence, normalizes, and provides the compound score. Positive, negative, and neutral values assign to text related to compound value accordingly. Sentiment score indicates how positive and negative the sentiment of a data. Subjective context is used to label the sentiments it expresses strong emotions. Equation (1), indicates X sum of all polarity words. Alpha is a constant word.
Sentiment matrices produced by the VADER lexicon were obtained as the positive, negative, neutral, and compound values of tweets were also calculated. Graphical representation of sentiment matrix is shown below (Figure 8). Heat maps are the graphical representation of the sentiment matrix that indicates the sentiment values as colors. It depicts the correlation between the features of the dataset (Figure 9).
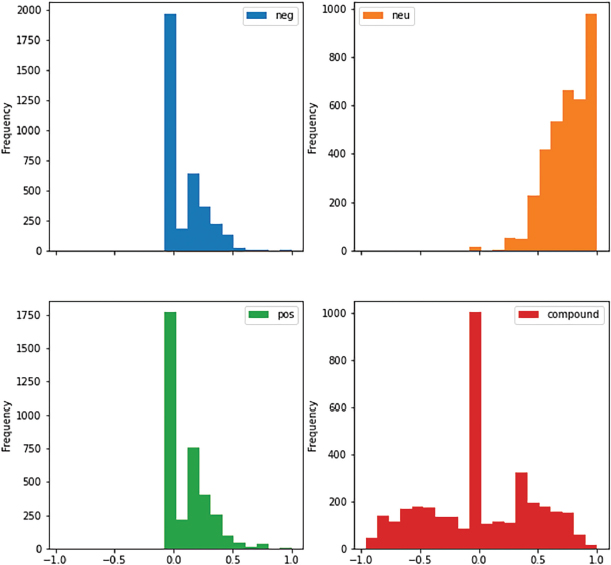
Figure 8. Histogram plot of four sentiment matrices of COVID-19 Tweets
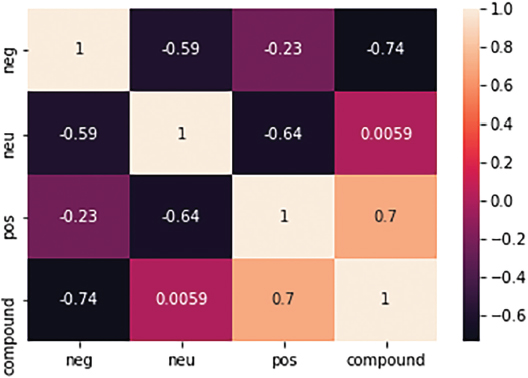
Figure 9. Heatmap representation of sentiment matrices
4.6. TF-IDF
TF-IDF termed as Term Frequency-Inverse Document Frequency is a method used for quantifying the textual data into the numeric format from the corpus (Figure 10). Term frequency defines the number of words occurring in a document or corpus. Applying, TF-IDF approach with classifier models enhances the efficacy of the model.
TF = (Frequent words in corpus/ Total words in a corpus)
Inverse Document Frequency defines as distinct words in a corpus.
IDF = Log ((Total Documents)/ (Documents with words))
For example, we take sentences from our corpus as follows:
corpus = ['india lockdown stranded migrants return hom', 'rt varifrank could opposite one including dr fauci anyway know', 'company working us pharmaceutical giant pfizer begun human trials potential vaccine' ]
S1 = 'india lockdown stranded migrants return hom'
vocabulary = ['india', 'lockdowm', 'return', 'one', 'human', 'company','us', 'vaccine]
TF values:
S1 = [1, 0, 1, 0, 0, 0, 0, 0],
IDF values weighted:
S1 = [1.69314718, 2.38629436, 1.69314718, 1.69314718, 1.69314718, 1.69314718, 1.69314718, 1.69314718]
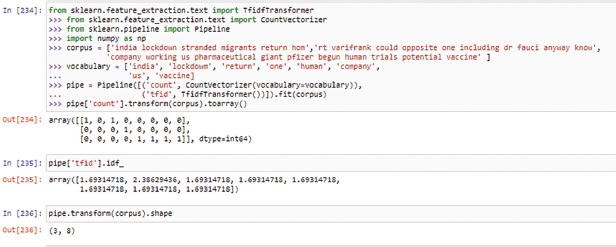
Figure 10. Tf-Idf Vectorization
4.7. Machine Learning Algorithms for Classification
After pre-processing selection of learning models are an important part of the experimental analysis part. In the literature survey, observed various classification models used for text classification using feature extraction techniques n-grams, Tf-Idf, wordvec etc. For tweets analysis, Naïve Bayesian, Support Vector Machine, Gradient Boosting, Linear Regression, Random Forest Classifier implemented on the dataset. In research, classification techniques used for tweets are Linear SVC, Random Forest Classifiers, and MultinomialNaiveBayes, GBM (El-Jawad et al., 2018).
4.7.1 Supervised Learning
In this type of learning, the dataset act as a teacher. It has a role to train the model and learns from observation. The trained model predicts when new data is fed to the machine. Mathematically, the model contains the input as X and the output as Y, and an algorithm is needed to learn the mapping function: Y=f(X). ML algorithms widely used in the healthcare department that recognize patterns and make decisions help clinical practitioners (Ghaderi et al., 2015). An example of SL is text classification used to detect sentiment from the textual feed posted by individuals. Diagnosis of Major depressive disorder (MDD) is characterized as a depressed and non-depressed post. It may be positive, negative, or neutral.
4.7.2 Unsupervised Learning
It contains unlabeled data. Unlike, SL there is no teacher and supervision. Mathematically, there is an input variable(X) but no output variable(Y). In this learning, the algorithm has to learn from observations and find out its structure for data. When the dataset is fed into the model, it finds patterns on the data makes clusters, and split the dataset into those clusters. USL uses the clustering method (K-mean, hierarchical, KNN, principal component analysis) to sort, spilt, and group into clusters. As an example, Genetics use to cluster DNA patterns to analyze evolution in biology also help in diagnosing class of cancer patients based on gene computation.
4.7.3 Support Vector Classifier
It is a supervised machine learning model, Linear SVC provides the «best fit» results for the data. SVC tries to maximize the gap between the classes. It widens the boundary to give the best results. The classes are linearly separated. Support Vector Machine (SVM) categorizes into two classes: Linear Support Vector Classification (SVC) and SVC. Plotting mapped into high dimensional features. Pre-processing of data provides more efficient results than raw data. Cleansing of data removes all the noise from the data gives accurate results and better decision making.
4.7.4 Random Forest Classifier
Random Forest classifier is a classification technique ensemble multiple decision trees of datasets and combines them to give a more accurate result. It is a multiclass problem that performs well with both numeric and absolute features. RF is supervised learning used for both regression and classification. Forest builds decision trees on sample datasets and foretells results for each decision tree. Perform voting for each result with the highest vote as the final result.
4.7.5 MultinomialNB
Multinomial Naïve Bayes classifier is a supervised learning method used for text classification and used for distinct feature extraction (text counts). It works on an integer count of words. This algorithm is used for multinomial distributed data. It also works well with TF-IDF feature extraction. MultinomialNB is a probabilistic approach and predicts results on probability. Calculates the text counts from a corpus and predicts the highest probability as result.
4.7.6 GBM
Gradient Boosting classification model used to classify the text as 0 or 1. It works on the principle of ensemble and combines weak algorithms to build an accurate predictive model. Decision trees are for the implementation of gradient boosting. It is efficient for complex datasets and has higher efficacy also reduces over-fitting. GBM has three main factors loss function, weak learners, and adaptive models. It is greedy algorithms.
In this research above-mentioned machine learning classifiers were implemented on the dataset. Dataset splits into training and testing data of 80:20. It splits the data into two parts X as input variable and y as output variable. The test size splits the dataset as per define value ranges from 0 to 1. Train data learn from the models and Test data implements learning from the training model. To analyze the efficacy of the model, we use a method called test and split.
5. Evaluation of Model
The machine learning models implement for testing and validation of the Twitter dataset. The dataset split for train_test_validation into 80:20 means 80% data for training and 20% data for testing. The measures used for evaluating the model are precision, recall, f1-score, and accuracy. In Multi-class classification, the classifier categorizes into three: positive, negative, and neutral. Classification evaluation measures for matrix building are True positive (TP), True Negative (TN), False Positive (FP), and False Negative (FN). These measures are used for plotting the confusion matrix. The confusion matrix is plotted for both binary classification and multi-class classification. The evaluating measures of the confusion matrix are elaborated in Table 2. For qualitative assessment of all measures, macro-average and a weighted average precision, recall, and f1-score calculated used to evaluate train models for Multi-class classification.
Table 2. Evaluation measures of the Confusion matrix
Measures |
Description |
True Positive (TP) |
Cases predicted as True, actually they are True. Predicted values same as actual value. |
True Negative (TN) |
Cases predicted as False, actually they are False. Predicted value same as actual value. |
False Positive (FP) |
Cases predicted as True, actually they are False. Predicted value not same as actual value. |
False Negative (FN) |
Classes predicted as False, actually they are True. Predicted value not same as actual value. |
6. Results and Discussion
Before implementing the model, need to divide the data into train and test sets. Train the model on the train set and evaluate the model on the test set. In order, to classify the sentiments of tweets as positive, negative, and neutral applied four machine learning classifiers: Random Forest, Gradient Boosting, Support Vector Classifier, and MultinomialNB. RF as compared to other models performed better. The classification model has achieved an accuracy of 75%. In linear SVC tends to converge huge amount of data with kernel=’linear’ yield best results like decision boundary and metrics score. The proposed model implemented linear SVC accuracy of 71%.
In Table 3 precision, recall, f1-scores, and accuracy of all classification models are shown. Multinomial Naïve Bayes classifier used for distinct feature extraction (text counts). This algorithm is used for multinomial distributed data. This classifier is implemented on the model obtains an accuracy of 70%. Gradient boosting shows low accuracy than other models of 67%. To measure the quality of the model calculated macro and weighted avg. precision, recall, and f1-score (suitability). Graph representation of confusion matrix for machine learning classifiers (Figure 11).
Table 3. Confusion Matrix of Random Forest, SVC, GBM, and MultinomialNB classifier
Model |
|
Precision |
Recall |
F1-score |
Accuracy |
GBM |
Negative |
0.78 |
0.52 |
0.63 |
|
|
Neutral |
0.55 |
0.83 |
0.66 |
|
|
Positive |
0.76 |
0.69 |
0.72 |
0.67 |
|
Macro Avg |
0.69 |
0.68 |
0.67 |
|
|
Weighted Avg |
0.70 |
0.67 |
0.67 |
|
Random Forest |
Negative |
0.87 |
0.63 |
0.73 |
|
|
Neutral |
0.61 |
0.92 |
0.74 |
|
|
Positive |
0.81 |
0.77 |
0.79 |
0.75 |
|
Macro Avg. |
0.77 |
0.77 |
0.75 |
|
|
Weight Avg. |
0.78 |
0.75 |
0.75 |
|
SVC |
Negative |
0.74 |
0.71 |
0.72 |
|
|
Neutral |
0.68 |
0.73 |
0.70 |
0.71 |
|
Positive |
0.71 |
0.70 |
0.71 |
|
|
Macro Avg. |
0.71 |
0.71 |
0.71 |
|
|
Weight Avg. |
0.74 |
0.71 |
0.72 |
|
Multinomial Naïve Bayes |
Negative |
0.72 |
0.75 |
0.73 |
|
|
Neutral |
0.64 |
0.69 |
0.66 |
|
|
Positive |
0.74 |
0.67 |
0.70 |
0.70 |
|
Macro Avg. |
0.70 |
0.70 |
0.70 |
|
|
Weight Avg. |
0.70 |
0.70 |
0.70 |
|
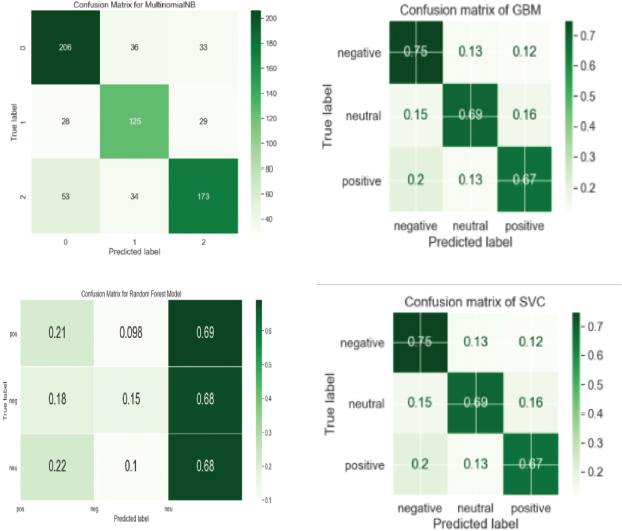
Figure 11. Confusion matrix of all four ML classifiers
7. Discussion
Sentiment analysis has gained pace in the last few years with the expansion of technology people express their views, opinion, expression, and thoughts. Mining these social networking sites sentiments can be analyzed and labeled according to the intensity of the text. In this research, COVID-19 tweets extracted from the Twitter database using the VADER Lexicon method from the NLTK package with different Python libraries, the sentiment polarity of each text calculated as pos, neg, neu, and compound. It is classified as positive, negative, and neutral. From the sentiment score, it was observed that positive is higher than negative than neutral. Visualization of data pre-processing helps in a better understanding of the dataset. Applying, the TF-IDF feature extraction method converts textual into numeric form. Machine learning classification model implemented on the vectorize tweets and target. Random Forest shows the highest accuracy in sentiment analysis of the Tweets. RF and SVC show better results on unseen tweets and classify them into three: positive, negative, and neutral. However, Multinomial Naïve Bayes also performed better than Gradient Boosting. The computational cost of SVC is higher than other classifiers. Naïve Bayes is also a good choice for text analysis.
8. Conclusion and Future Work
The propagation of social media has become difficult to analyze the sentiments of data. This paper the tweets retrieved from the Twitter database from a web-based application hydrator and classify them into positive, negative, or neutral. NLTK is a powerful python package used to analyze the sentiments from textual data. Data pre-processing remove all the noises, outliers and concatenate the data. Word cloud visualization gives the effect to the frequent words. Calculating the sentiment counts and polarity and visualize the tweets in word cloud as negative, positive, and neutral. After pre-processing, the tweets and sentiments are fed to the classification model Linear SVC with Sklearn accuracy of 71%. TF-IDF technique is used to find the occurrence of words quantifies the document and predicts the sentiments of the user. Random Forest Classifier with TF-IDF vectorizer obtains an accuracy of 75% and MultinomialNB obtains an accuracy of 70%. GBM obtain an accuracy of 67%. For future contributions, large datasets need to be embedded in the different classification models. Different languages should be incorporated while analyzing the sentiments from social media to observe the highest accuracy of the classification model that fits the best.
References
Ahuja, R., and Banga, A., 2019. Mental Stress Detection in University Students using Machine Learning Algorithms, 152. 349-353. Procedia Computer Science.
Alamoodi A. H., Zaidan B. B., Zaidan A. A., Albahri O. S., Mohammed K. I., Malik R. Q., Almahdi E. M., Chyad M. A., Tareq Z., Albahri A. S, Hameed H., and Alaa M., 2020. Sentiment analysis and its applications in fighting COVID-19 and infectious diseases: A systematic review. Expert systems with applications, 167, 114155.
Aldarwish, M. M., and Ahmad, H. F., 2017. Predicting Depression Levels Using Social Media Posts, 277-280. IEEE 13th International Symposium on Autonomous Decentralized System (ISADS).
Baheti, R. R., and Kinariwala, S., 2019. Detection and Analysis of Stress using Machine Learning Techniques. International Journal of Engineering and Advanced Technology.
Bania, R. K., 2020. COVID-19 Public Tweets Sentiment Analysis using TF-IDF and Inductive Learning Models, 19(2), 23–41. INFOCOMP Journal of Computer Science.
Calderon-Vilca, H. D., Wun-Rafael, W. I., and Miranda-Loarte, R., 2018. Simulation of suicide tendency by using machine learning: 1-6. 36th International Conference of the Chilean Computer Science Society, SCCC 2017.
Cavazos-Rehg, P. A., Krauss, M. J., Sowles, S., Connolly, S., Rosas, C., Bharadwaj, M., and Bierut, L. J., 2016. A content analysis of depression-related Tweets, 54, 351–357. Computers in human behavior.
Chancellor, S., and De Choudhury, M., 2020. Methods in predictive techniques for mental health status on social media: a critical review, 3, 43. npj Digit. Med..
Cho, G., Yim, J., Choi, Y., Ko, J., and Lee, S. H., 2019. Review of Machine Learning Algorithms for Diagnosing Mental Illness. .16(4), 262-269. Psychiatry investigation.
Das, B., and Chakraborty, S., 2018. An Improved Text Sentiment Classification Model Using TF-IDF and Next Word Negation. ArXiv.
Desai, M., and Mehta, M. A., 2016. Techniques for sentiment analysis of Twitter data: A comprehensive survey, 149-154. International Conference on Computing, Communication and Automation (ICCCA).
Deshpande, M., and Rao, V., 2017. Depression detection using emotion artificial intelligence, 858-862. International Conference on Intelligent Sustainable Systems (ICISS).
Dubey A., 2020. Twitter Sentiment Analysis during COVID-19 Outbreak. SSRN Electronic Journal.
El-Jawad, A., Hodhod, R. A., and Omar, Y. M., 2018. Sentiment Analysis of Social Media Networks Using Machine Learning, 174-176. International Computer Engineering Conference (ICENCO).
Ghaderi, A.. Frounchi, J., and Farnam, A., 2015. Machine learning-based signal processing using physiological signals for stress detection: 93-98. 22nd Iranian Conference on Biomedical Engineering (ICBME).
Hatton, C. M., Paton, L. W., McMillan, D., Cussens, J., Gilbody, S., and Tiffin, P. A., 2019. Predicting persistent depressive symptoms in older adults: A machine learning approach to personalised mental healthcare, 246: 857-860. Journal of affective disorders.
Hussain, J., Ali, M., Bilal, H. S. M., Afzal, M., Ahmad, H. F., Banos, O., and Lee, S., 2015. SNS Based Predictive Model for Depression, 349–354. Lecture Notes in Computer Science.
Kemp, S., 2021. Global Overview Report.
Khan, M., Rizvi, Z., Shaikh, M. Z., Kazmi, W., and Shaikh, A., 2014. Design and Implementation of Intelligent Human Stress Monitoring System, 179-190. International Journal of Innovation and Scientific Research.
Lech, M., 2018. Detection of Adolescent Depression from Speech Using Optimized Spectral Roll-Off Parameters. Biomedical Journal of Scientific & Technical Research.
Nguyen, T., Phung, D., Dao, B., Venkatesh, S., and Berk, M., 2014. Affective and Content Analysis of Online Depression Communities, (5/3), 217-226. IEEE Transactions on Affective Computing.
Pranckevicius, T., and Marcinkevicius, V., 2017. Comparison of Naive Bayes, Random Forest, Decision Tree, Support Vector Machines, and Logistic Regression Classifiers for Text Reviews Classification. Balt. J. Mod. Comput., 5.
Ramalingam, D., Sharma, V., and Zar, P., 2019. Study of Depression Analysis using Machine Learning Techniques, 8, 7C2: 2278-3075. International Journal of Innovative Technology and Exploring Engineering (IJITEE).
Rathi, M., Malik, A., Varshney, D., Sharma, R., and Mendiratta, S., 2018. Sentiment Analysis of Tweets Using Machine Learning Approach, 1-3. Eleventh International Conference on Contemporary Computing (IC3).
Raichur, N., Lonakadi, N., and Mural, P., 2017. Detection of Stress Using Image Processing and Machine Learning Techniques, 9, 1-8. International journal of engineering and technology.
Samuel, J., Ali, G.G.M.N., Rahman, M.M., Esawi, E., and Samuel, Y., 2020. COVID-19 Public Sentiment Insights and Machine Learning for Tweets Classification, 11(6):314. Information.
Shatte A., Hutchinson D.M., and Teague S.J., 2019. Machine learning in mental health: a scoping review of methods and applications, 49(9):1426-1448. Psychological medicine.
Stolar M, N., Lech, M., Stolar S.J., and Allen N.B., 2018. Detection of Adolescent Depression from Speech Using Optimised Spectral Roll-Off Parameters. 5(1). BJSTR.
Subhani, A. R., Mumtaz, W., Saad, M. N. B. M., Kamel, N., and Malik, A. S., 2017. Machine Learning Framework for the Detection of Mental Stress at Multiple Levels, 5, 13545-13556. IEEE Access.
Tate, A. E., McCabe, R. C., Larsson, H., Lundström, S., Lichtenstein, P., and Kuja-Halkola, R., 2020. Predicting mental health problems in adolescence using machine learning techniques, 15(4), e0230389.
Troussas, C., Virvou, M., Espinosa, K. J., Llaguno, K., and Caro, J., 2013. Sentiment analysis of Facebook statuses using Naive Bayes Classifier for language learning, 1-6. IISA.
Vuppalapati, C., Khan, M. S., Raghu, N., Veluru, P., and Khursheed, S., 2018. A System to Detect Mental Stress Using Machine Learning and Mobile Development: 161-166. International Conference on Machine Learning and Cybernetics (ICMLC).
World Health Organization, 2021. Depression is a mental disorder.
Worldometers, 2020 - https://www.worldometers.info/coronavirus/
Yazdavar, A. H., Mahdavinejad, M. S., Bajaj, G., Thirunarayan, K., Pathak, J., and Sheth, A., 2018. Mental Health Analysis Via social media Data: 459-460. IEEE International Conference on Healthcare Informatics (ICHI).