
Regular Issue, Vol. 10 N. 4 (2021), 339-359
eISSN: 2255-2863
DOI: https://doi.org/10.14201/ADCAIJ2021104339359
 |
ADCAIJ: Advances in Distributed Computing and Artificial Intelligence Journal
Regular Issue, Vol. 10 N. 4 (2021), 339-359 eISSN: 2255-2863 DOI: https://doi.org/10.14201/ADCAIJ2021104339359 |
The Approach of Data Mining: A Performance-based Perspective of Segregated Data Estimation to Classify Distinction by Applying Diverse Data Mining Classifiers
Altaf Hussaina, b, Tariq Hussaina, c* and Ijaz Ullahd
aInstitute of Computer Sciences and IT (ICS/IT), The University of Agriculture Peshawar, Pakistan
bDepartment of Accounting and Information Systems, Qatar University, Doha, Qatar
cSchool of Computer Science and Information Engineering, Zhejiang Gongshang University Hangzhou, China
dUniversity of Rennes 1, France
altafkfm74@gmail.com, uom.tariq@gmail.com, ijaz_flair@yahoo.com
*Correspondence Email: uom.tariq@gmail.com
ABSTRACT
The concept of data mining is to classify and analyze the given data and to examine it clearly understandable and discoverable for the learners and researchers. The different types of classifiers are there exist to classify a data accordingly for the best and accurate results. Taking a primary data, and then classifying it into different portions of parts, then to analyze and remove any ambiguities from it and finally make it possible for understanding. With this process, that data will become secondary from primary and will called information. So, the classifiers are doing the same strategy for the solution and accuracy of the data. In this paper, different data mining approaches have been used by applying different classifiers on the taken data set. The data-set consists of 500 candidates’ segregated data for the analysis and evaluation to perfectly classify and to show the accurate results by using the proposed Algorithms. The data mining approaches have been used in which HUGO (Highly Undetectable steGO) Algorithm, Naïve Bayes Classification, k-nearest neighbors and Logistic Regression are used with the extension of the other classification methods that are Support Vector Machine (SVM) and Multi-Layer Perceptron (MLP) as classifiers. These classifiers are given names for further analysis that are Classifier-1 and Classifier-2 respectively. Along with these, a tool is used named WEKA (Waikato Environment for Knowledge Analysis) for the analysis of the classifier-1 and 2. For performance evaluation and analysis the parameters are used for best classification that which classifier has given best performance and why. These parameters are RRSE (Root Relative Square Error), RAE (Relative Absolute Error), MAE (Mean Absolute Error), and RMSE (Root Mean Square Error). For the best and outstanding accuracy of the proposed work, these parameters have been tested under the simulation environment along with the incorrect, correct classifying and the %age has been witnessed and calculated. From simulation results based on RRSE, RAE, MAE and RMSE, it has been shown that classifier-1 has given outstanding performance among the others and has been placed in highest priority.
KEYWORDS
Data Mining; WEKA; Estimation of Segregated data; Data Mining Classifiers; Support Vector Machine; Multi-Layer Perceptron; Logistic Regression; Naive Bayes Classification; k-nearest neighbors; HUGO Algorithm.
1. Introduction
The association of the PCs in each field results into an immense making of data, along these lines the need of capacity becomes quickly. An enormous measure of information is prepared and put away in "daily existence by human" that are related to various fields of life. Various organizations of information i.e., logical information, visual diagrams and pictures are utilized to store the data. Presently the measures of information have now been extended to Terabytes. The crude information must be changed to valuable data for its significant impact and dependable dynamic. The data put away in PC can be utilized in various varieties i.e., playing out specific errands, normally critical thinking. The information investigators utilized this data for guaging to anticipate the future patterns in an assortment of fields Storage, recovery and transmission of the data utilizing PCs as an information processor has changed correspondence. It helps the information digger in part of unique patterns or design and can dissect the future without any problem.
Bayesian organizations group the datasets utilizing probabilistic methodology. The chance is determined ahead of time for a tuple in a given dataset. By utilizing the past determined likelihood for the given new tuple with obscure mark class the upsides of each tuple is determined that have the most noteworthy worth. A resulting plausibility is used to order the information. Profound learning (otherwise called profound organized learning) is important for a more extensive group of AI meth-ods dependent on counterfeit neural organizations with portrayal learning. Learning can be directed, semi-administered or solo. Profound learning structures like profound neural organizations, profound conviction organizations, profound support learning, intermittent neural organizations and convolutional neural organizations have been applied to fields including PC vision, discourse acknowledgment, regular language handling, machine interpretation, bioin-formatics, drug plan, clinical picture investigation, material review and tabletop game projects, where they have created results tantamount to and now and again awe-inspiring human master execution. Counterfeit neural net-works (ANNs) were roused by data handling and dispersed correspondence hubs in natural sys-tems. ANNs have different contrasts from natural minds. In particular, neural organizations will in general be static and emblematic, while the natural mind of most living life forms is dynamic (plastic) and simple. Figure 1 is regarding Deep Learning.
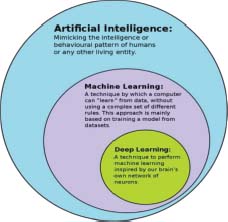
Figure 1: Deep Learning Scenario
Then again, information mining is a course of extricating and finding designs in enormous informational indexes including techniques at the crossing point of AI, measurements, and data set frameworks. Information mining is an interdisciplinary subfield of software engineering and measurements with a general objective to separate data (with astute techniques) from an informational index and change the data into a fathomable design for additional utilization. Information mining is the examination step of the "information disclosure in data sets" cycle, or KDD. Beside the crude examination step, it likewise includes data set and information the board angles, information pre-preparing, model and induction contemplations, intriguing quality measurements, intricacy contemplations, post-handling of found constructions, perception, and web based refreshing. Figure 2 is regarding Data Mining with different illustrations and processing.
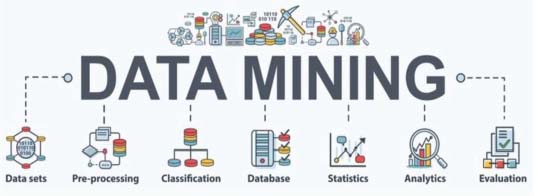
Figure 2: Data Mining Scenario
The expression "information mining" is a misnomer, in light of the fact that the objective is the extraction of examples and information from a lot of information, not simply the extraction (mining) of information. It likewise is a trendy expression and is oftentimes applied to any type of huge scope information or data handling (assortment, extraction, warehousing, examination, and insights) just as any utilization of PC choice emotionally supportive network, including man-made brainpower (e.g., AI) and business knowledge. The book Data mining: Practical AI instruments and strategies with Java (which covers for the most part AI material) was initially to be named simply Practical AI, and the term information digging was just added for promoting reasons. Regularly the more broad terms (huge scope) information investigation and examination — or, when alluding to genuine techniques, man-made consciousness and AI—are more suitable.
Investigating and evaluating researchers’ scores are important for a learning framework to gain careful picture of researchers. However, educators can foresee researcher’s presentation based on score by dissecting and looking at his/her scholastic exhibition. Be that as it may, the researchers’ exhibition may likewise be influenced from social ascribes like home air, parent’s schooling and work and numerous different exercises. Many explores have been completed to anticipate the researcher’s schooling execution. Yet at the same time it needs to recognize the characteristics to anticipate better the researcher’s instructive presentation. Along these lines, this exploration utilized some notable calculations SVM and MLP to foresee the characteristics which can influence the researcher’s presentation better.
The Contributions of the Proposed Approach are as follows:
• To study the existing related literature and to identify the problem.
• To propose a novel approach for the solution of the identified problem in the existing works.
• To propose a Performance-based Perspective of Segregated data Estimation to Classify Distinction by Applying Diverse Data Mining Classifiers.
• To predict the best attributes to improve the performance via data mining techniques to use the classification approach.
• To compare the performance of Classifier-1, and 2 in terms of MSE and Accuracy.
The paper has many sections that are organized in the following arrangement. Section 2 contains the detail overview of related work with the state of the art solutions. Section 3 discussed different technique and methodology to determine best among them these techniques. Section 4 contains detail of all experiment and their result evaluation. Section 5 discuses conclusion and concludes the paper.
2. Review of the Related Literature
This section shows the related work of the concerned study in the perspective of different author’s view from different years up to the current year. This section also shows that how many work have been done relevant to the proposed work and how many have been showed for further studies.
• Related Work
Hoe et al., (2013) as business world is concern, data mining is in use up to some extent, and the its implementation is successful. However, it is new in the field of education, particularly when we consider the higher education. this method is able to identify valuable data to conclude some goal oriented results. Khan et al., (2014) as different methods and techniques of data mining has been used, comparison was performed on these methods on the data of the scholars who stood successful in their study perusal. The data was collected from the University of Tuzla, Department of Economics during the academic year 2010 and 2011 from new comers. The parameters used during the evaluation of the performance of the scholars are socio-demographic variable, high school performance, the entrance examination and the attitude of the scholars towards academia. It is pertinent that the performance of the scholars could be elevated by identifying the assessing factors related with procedure of considering. , it is conceivable to create a model which would remain as an establishment for the advancement of choice emotionally supportive network in advanced education Ktona et al., (2014) used characterization for the scholar in the university depends upon the courses which are taught to the scholars and beside that many other factors involve in the performance. In this paper the authors used characterization to improve the nature of advanced education by distinguishing the principle characteristics that influence the exhibition of the understudies. The information was gathered from Vikram University, Ujjan of Course B.A. The arrangement rule age process depends on the choice tree as a characterization strategy where the created principles are contemplated and assessed. A framework that encourages the utilization of the created principles is constructed which enables understudies to anticipate the last level in a course under investigation. Wang et al., (2012) predicted based on the scholar’s response to the courses studies. Scholars evaluate the course contents, teachers and their learning attitudes. it is hard to foresee understudies’ presentation utilizing two class information in every exercise. The proposed techniques fundamentally utilize inert semantic examination. for foreseeing understudies’ final brings about four evaluations of S, A, B and C. In addition, a cover strategy was proposed to improve the exactness forecast results, the technique permits to acknowledge two evaluations for one imprint to get the right connection between LSA results and understudies’ evaluations. The proposed techniques accomplish 50.7% and 48.7% expectation precision of understudies’ evaluations by SVM and ANN, individually. To this end, the consequences of this examination announced models of understudies’ scholarly presentation indicators that are significant wellsprings of understanding understudies’ conduct and offering input to them with the goal that we can improve their learning exercises. Watchwords Free-style remarks, Latent semantic investigation (LSA), Artificial neural system (ANN), SVM (SVM), Overlap strategy. Mayilvaganan et al. (2014) compared classification algorithms to find out the best predictor of the scholars’ performance in higher education. For experiment purpose WEKA tool is used. The classification algorithm helps to predict and analyze slow learner in semester system and extract rules that helps to improve scholars learning capabilities. Data is collected from different institutes. These institutes are, Department of Computer Science and Engineering, Department of Commerce, Computer Science College in Arts and Science College, Aero science in Engineering college and Software engineering. The total 197 data sets remained after preprocessing. For analysis and classification purpose AODE (Aggregating One-Dependence Estimators), C4.5 algorithm, Naïve Bayesian and Multi Label K-Nearest Neighbor algorithm are selected to find out the best Accuracy of classification algorithm. Multi Label K-Nearest Neighbor provides best Accuracy as compare to the other classification algorithm. This study helps to identify slow learner ratio and failure ratio in scholars, predicted with the help of data mining techniques the exhibition of understudies regarding evaluations and dropout for a subject can be anticipated. In the proposed framework, different classification information mining strategies, for example, guileless Bayes, LibSVM, C4.5, irregular woods, and ID3 are thought about and by defeating the flaws of existing systems to some degree new classification strategy is created. In light of the guidelines acquired from the created procedure, the framework can infer the key components influencing understudy execution. Al-Radaideh et al., (2006) Education mining is using data mining which has set as a current trend. A huge data exhibits in educational data base regarding scholars which has remain unused. Educational institutions needed to be aware about the importance of the scholar’s data. The data while if used correctly can predict the performance of the scholars. The importance of the processing of scholars’ data can help the scholars to improve their performance. It also helps the instructor to guide their scholars in a careful way to improve their performance. It can identify the scholars who need more care and are not performing well. So the instructors thus aware about the scholars who need more care. Choosing the correct attributes can lead to the accurate estimation of target attributes. The classification technique of data mining has the ability to predict the required attributes precisely, subsequent to the knowledge gained through the training data. The WEKA software is used for classification. This tool is free and is important among the researchers to use it in data mining. The scholar dataset has been analyzed with different classification algorithms i.e., Random Forest, Bayesian Classifiers, Common DT algorithm, SVM and Perceptron. Among these classifiers after comparing the final result the best classifier will be suggested. Baradwaj, B.K.S. Pal (2011) the education level of the Portuguese has been enhanced in the term of a decade. Portugal at Europe is at the bottom in academic performance due to high rate of scholar failure. The cause detected was the failure of the scholars in the core subject of Portuguese language and Mathematics. The fields of Business Intelligence, DM can extract the high knowledge of raw data and can confer the useful result. The scholar achievement in Secondary education was analyzed by collected real word data from the questionnaires and school reports. The two center classes (for example Science and Portuguese) were displayed under parallel/five-level classification and relapse assignments. Additionally, four DM models (for example Choice Trees, Random Forest, Neural Networks and SVMs) and three input choices (for example with and without past scores) were tried. Bunker et al., (2012) on the availability of the previous scores high level of predictive Accuracy can be achieved. In spite of the fact that understudy accomplishment is exceptionally influenced by past assessments, a logical examination has indicated that there are likewise other important highlights (for example number of unlucky deficiencies, parent’s activity and instruction, liquor utilization). As an immediate result of this exploration, more efficient understudy expectation devices can be created, improving the nature of instruction and upgrading school asset the board. Grivokostopoulou et al., (2014) the goal of this work is to apply the data mining methods to analyze the scholars’ academic performance on the academic record. EDM is a well-known tool for academic forecasting. The education institutions can use EDU for analysis of scholar’s characteristics.
Summary of the state-of-the-art
After thorough studies of the literature review, it has been revealed that most of the researchers were worked in the same field of study. To the best of our knowledge, it has also been concluded from literature review that no work under the same title, objectives, methodology and proposed framework have done. From the literature review it has been concluded that the above survey of writing it is apparent that understudy execution assessment is a developing field in information mining. Instructive information mining is an investigation of control to building up the techniques for investigating the one of kind sorts of information from instructive settings and it is utilized for development of understudies in better way and discover which zone is more suitable in education field for scholars to provide quality knowledge.
3. The Proposed Methodology
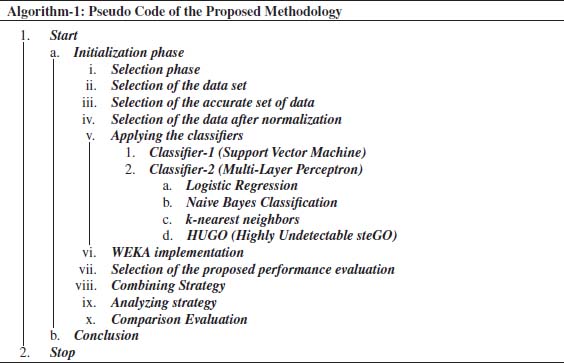
The methodology suggests the tools and techniques that how the proposed work has been carried out in which the objectives of the study have been achieved. This research was carried out to evaluate the efficiency and performance of diverse classifiers for finding the better classifier which can efficiently predict segregated data analysis and estimation. For analysis purpose WEKA tool is selected and the imaginary date of the scholar performance has been compiled. The initial and final estimation min-mix normalization is applied to normalize data. During the initial proceedings, the normalize data is applied on three different data mining algorithms. These algorithms are Classifier-1 (SVM), and Classifier-2 (MLP). Finally, these classifiers were examined to check the performance and accurateness and sort out the better one among them.
Classifier-1
It is a new arrangement framework which depends on factual learning hypothesis. Remote detecting arrangement is its latest application. This is autonomous of dimensionality of information space. The fundamental thought behind this classifier is arrangement strategy is to apply edge line and hyper-plane that different all classes from one another. The information indicates that are nearest the hyperplane are named "bolster vectors". For this reason, information focuses are chosen on hyperplane line to make choice surface. The separation between hyperplane line where bolster vector lies and the hyperplane is M so absolute size of hyperplane between two classes is 2M (Pal, 2008). A scenario of classifier 1 is shown in Figure 3.
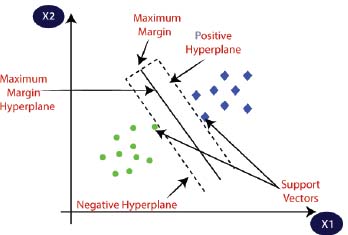
Figure 3: The Proposed Classifier-1
The information indicates that are nearest the hyperplane are utilized to quantify the edge and are place at the nearest of the hyperplane is called bolster vector. It orders the classes.
It is a non-linear technique of classification and mining of data modeling which shows the replications of the real scenarios. It has the feature extraction capabilities in which it extracts the features of the images and then generates the desired output according to the extracted features from dataset. It predicts the hidden features that are found in images and datasets which is primary data. By applying NN on the data converts into secondary data. First raw data then processing and then information can be obtained by using NN. This model changes its results regarding the data that has to process through it and then generates different outputs. This is a standard model that is used for classification, clustering, designing some datasets and other images related and techniques.
Classifier-2
It is a perceptron to be a machine that gets the hang of, utilizing dataset, to dole out info vectors (tests) to various classes, utilizing a direct enactment capacity of the contributions to create yield for target neuron. It has distinctive layer. These layers are Input layer, concealed layer and yield layer. A scenario of this classifier is shown in Figure 4.
Where the structure is:
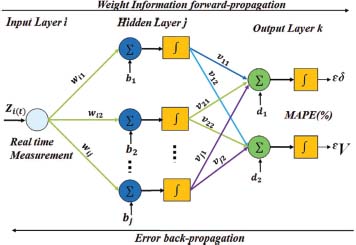
Figure 4: The Proposed Classifier-2
At last, results passed via activation function to generate output for target neurons, which is linear in case of classifier-2.
Logistic regression
Is a statistical model that in its basic form uses a logistic function to model a binary dependent variable, although many more complex extensions exist (Figures 5, 6, 7 and 8).
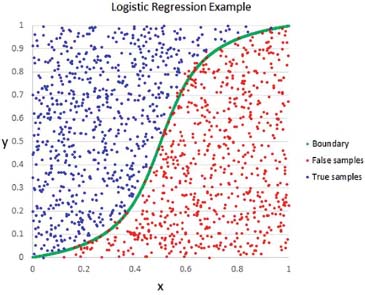
Figure 5: Logistic Regression scenario
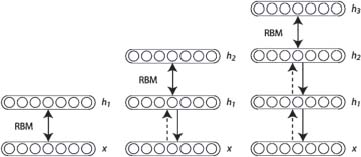
Figure 6: Scenario of HUGO algorithm
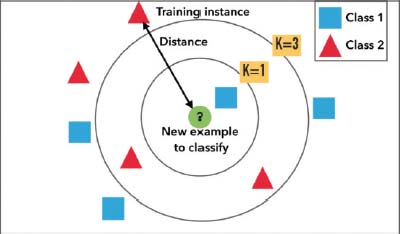
Figure 7: k-nearest neighbor
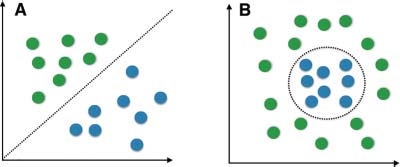
Figure 8: Naïve Bayes classifier
At last, the results have been analyzed which has shown that classification models have shown accurately classified dataset. In this research it has been witnessed and analyzed the performance and Accuracy of three different models and their results have been compared that which one has given better results in estimation of segregated data. The performance will be analyzing in term of MSE, AMSE, RMSE and construct confusion matrix.
• Mean Square Error (MSE)
MSE of an estimator measure the average of square error between definite value and what is predicted value. It has easy way to compute the gradient. It emphasizes the extremes i-e the square of a big number is bigger and small number is even smaller It measures how close the fitted line is to the data space. The mean square error can be calculated using formula
• Mean Absolute Error (MAE)
MAE is a linear score which processes the average scale of the error in the set of forecasts, without bearing in mind its way. All individual’s differences in AMSE are weighted equally in the average therefore it is a linear score. It is more robust to the outlier. Also, it requires complex tools (linear programming) to calculate gradients.
• Root Mean Square Error (RMSE)
RMSE measures the difference between projected value and actual value. It processes the average scale of the error therefore it is a quadratic scoring. It can be calculate using formula.
• Error Matrix
It is also known as error matrix used for classification, which classify actual and predicted value. It is an exact table design that visualizes the performance of an algorithm. It is a kind of contingency matrix having two dimensions i-e actual and predicted value where every row signifies the examples in an authentic class while every column signifies the instances in predicted class. Some of the elementary expressions used in confusion matrix are;
1. The Accuracy (AC) is the proportion of the total number of estimations that were correct. It is determined using the equation:
2. The recall or true positive rate (TP) is the proportion of positive cases that were correctly identified, as calculated using the equation:
3. The false positive rate (FP) is the proportion of negatives cases that were incorrectly classified as positive, as calculated using the equation:
4. The true negative rate (TN) is defined as the proportion of negatives cases that were classified correctly, as calculated using the equation:
5. The false negative rate (FN) is the proportion of positives cases that were incorrectly classified as negative, as calculated using the equation:
6. Finally, precision (P) is the proportion of the predicted positive cases that were correct, as calculated using the equation:
• Confusion Matrix (CnMx)
A confusion-matrix includes information on current and anticipated-classifications made through a rating-system (Figure 9). Operation of such systems is usually measured using the matrix data. The confusion matrix is also called contingency table. The number of correct classification of cases is the sum of the diagonal matrix (a + d); All others are malformed (c + b). The following table shows the confusion-matrix for a classifier of two kinds.
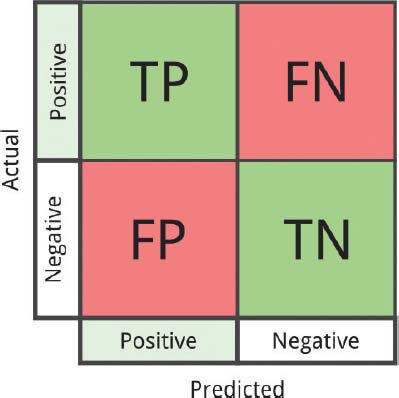
Figure 9: An illustration of CnMx
• Accuracy
The Accuracy (AC) is the proportion of the total number of estimations is correct. It is determined according to the formula:
• True positive rate
The true positive rate (TP) or recall, the proposition of positive cases were identified correctly, as calculated by the equation:
• False positive rate
The rate of false positive (FP) is the proportion of negatives that were incorrectly classified as positive, as calculated by the equation.
• True negative rate
The true negative rate (TN) is defined as the proportion of negative cases are classified correctly, as calculated by the equation:
• False negative rate
The rate of false negatives (FN) is the proportion of positive cases that were incorrectly classified as negative, as calculated by the equation:
• Precision
Precision (P) is the ratio of the expected positive cases have been corrected, as calculated by the equation:
• Recall
Recall is the proportion of exact items nominated. Then, the memory of a placement test, the number of true positives (TP) divided by the sum of true positives (TP) and false negatives (FN).
• F-Measure
It is a composite measure that evaluates the precision / Recall adjustment. It is equal to the harmonic mean of precision and recall weighing. The traditional F-Measure or balanced F-score (score F1) is the harmonic mean of precision and recall:
4. Results and discussion
This section shows and illustrates the simulation results along with discussion and proper justification. The evaluation and performance of Classifier-1 and Clasifier-2 analyzed using MS scholar records. The simulation tool named WEKA is used to check the performance of the mentioned classifiers. The data set consist of 500 records and 50 attributes. The data is stored in excel sheet for further graphical and other visual easy illustrations.
WEKA doesn’t accept data in excel format so first it is converted into CSV format.
• Tool Used for Simulations
For analysis purpose WEKA 3.6.10 is used. The interface of the tool is given in Figure 10.

Figure 10: WEKA Interface Illustration
Using this tool, the performance of classifier-1 and classifier-2 are evaluated using scholar’s data-set to find out the best classification approach among them.
• Classifier-1
To analyze the performance of classifier-1, the HUGO algorithm is used. The model is trained to find out the value of different parameters. Total number of records is 500 in which the 450 records are correctly classified so "the percentage of correctly classified records is 84.1%". Remaining 50records are incorrectly classified so "the percentage to incorrectly classified records is 20.23%". Time taken to build model is 0.64 seconds. The value of different parameter measured using classifier-1 is given in Figure 11.
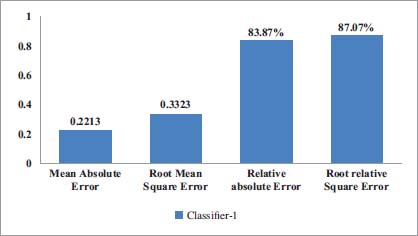
Figure 11: The Performance of Classifier-1 Using Different Parameters
The class label has for possible outcomes. These are good, Fair, Poor and Excellent. A represnts "Fair", b represnets "Good", c represents Excellent and d represents "Poor". The confusion matrix graphical illustration of classifier-1 is given below;
From Figure 12 it is clear that the total records having fair class label are 145, total record having Good class label are 200, total record for Excellent class label are 50 and total record for poor are 34.
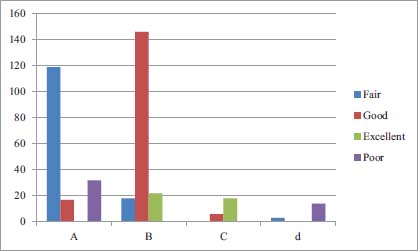
Figure 12: Confision Matrix Table For Classifier-1
• Classifier-2
To analyze the performance of Classifier-2 is used. The model is trained to find out the value of different parameters. Total numbers of records are 500. Among 500 records 450 records are correctly classified so the percentage of properly ordered recorded which 81.23% are. Remaining 50 records are incorrectly classified so the percentage to inaccurately ordered records is 20.214%. Time taken to build model is 8.1 seconds. The values of different parameter measured using classifier-2 are given in Figure 13.
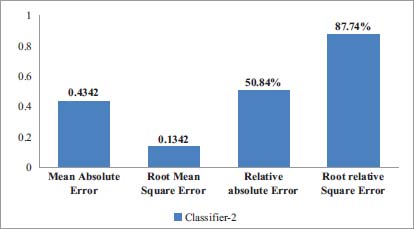
Figure 13: Different Parameters Measured using Classifier-2
The confusion matrix of Classifier-2 is given below;
From Figure 14 it is clear that the total records having fair class label are 100, total record having Good class label are 170, total record for Excellent class label are 30 and total record for poor are 50.
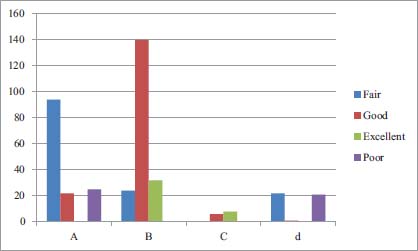
Figure 14: Confision Matrix Table For Classifier-2
• Comparison of Classifier-1 and Classifier-2
Finally, the performance of the model is compared to find out the best model among them. For this purpose, classification error, MAE, RMSE, RAE and RRSE of all the models are compared. The values of these attributes of different attributes are given in Figure 15.
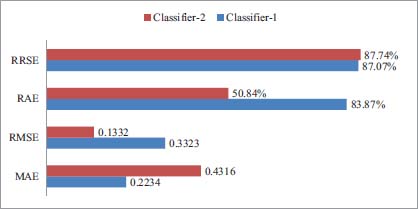
Figure 15: The performance of different models scenario-1.
From Figure 16 it is clear that the performance of Classifier-1 the proposed is outstanding in contrast with the proposed classifier-2.
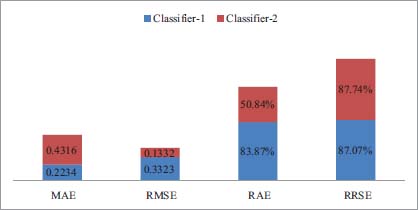
Figure 16: The performance of different models with another scenario-2
In above Figure y-axis represents Mean absolute error and x-axis represents different models. In above figure the MAE value of classifier-2 is higher having value 0.4316 which mean it has low performance. The MAE of classifier-1 is lower than classifier-2. The above figure represents that classifier-1 is better classification model classification model classifier-2 in term of MAE.
In above Figure y-axis represents Root Mean Square error and x-axis represents different models. In above figure the RMSE of Classifier-1 is lower which means it has low performance.
In above figure y-axis represents Root Relative Square Error and x-axis represents different models. In above figure y-axis represents Relative Absolute Square error and x-axis represents different models. In above figure the RRSE value of Classifier-2 has lower value while classifier-2 has higher value of RRSE, which indicates that classifier-1 is best in performance as compared with the other.
In Figure 17 and 18 it is clear that Classifier-1 classified 350 records correctly while remaining 128 records are incorrectly classified. 320 records out of 500 are correctly classified by Classifier-1 while remaining 180 records are incorrectly classified while Classifier-2 correctly classified 360 records while 140 records are incorrectly classified.
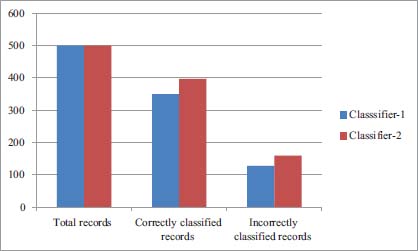
Figure 17: Classification of data models scenario-1
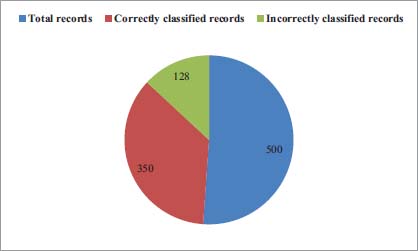
Figure 18: Classification of data models scenario-2
From above it is clear that Classifier-1 is good and has given an outstanding performance than Classifier-2.
5. Conclusion
The concept of data mining is to classify and analyze the given data and to examine it so that to clearly understandable and discoverable for the learners and researchers. The different types of classifiers are there exist to classify a data accordingly for the best and accurate results. Taking a primary data, and then classifying it into different portions of parts, then to analyze and remove any ambiguities from it and finally make it possible for understanding. With this process, that data will become secondary from primary and will called information. So, the classifiers are doing the same strategy for the solution and accuracy of the data. In this paper, different data mining approaches have been used by applying different classifiers on the taken data set. The data set has been transformed from first normal to 3rd normal form by using a normalization approach. The taken two different classifiers for this study are SVM (Classifier-1) and MLP (Classifier-2). These classifiers are given names for further analysis that are Classifier-1 and Classifier-2 respectively. Along with these, a tool is used named WEKA (Waikato Environment for Knowledge Analysis) for the analysis of the classifier-1 and 2. For performance evaluation and analysis the parameters are used for best classification that which classifier has given best performance and why. These parameters are RRSE (Root Relative Square Error), RAE (Relative Absolute Error), MAE (Mean Absolute Error), and RMSE (Root Mean Square Error). For the best and outstanding accuracy of the proposed work, these parameters have been tested under the simulation environment along with the incorrect, correct classifying and the %age has been witnessed and calculated. From simulation results based on RRSE, RAE, MAE and RMSE, it has been shown that Classifier-1 has given outstanding performance among the others and has been placed in highest priority.
Conflict of Interest: The authors declared no conflict of interest regarding the publication of this paper.
References
Al-Radaideh, Q. A. Emad, M. A & M. I. A. (2006). Mining scholar data using DTs. The 2006 International Arab Conference on Information Technology; pp. 1–5.
Baradwaj, B. K. S. Pal. (2011). Mining educational data to analyze scholars’ performance. International Journal of Advance Computer Science and Applications; Vol (2); pp. 63–69.
Bunker, K. R., Singh, U. K. & Pandya, B. (2012). Data mining: Estimation for performance improvement of graduate scholars using classification. IEEE; pp. 1–5.
Grivokostopoulou, F., Perikos, I. & Hatzilygeroudis, I. (2014). Utilizing semantic web technologies and data mining techniques to analyze scholars learning and predicts final performance. IEEE. pp. 488–494.
Hoe, A. C. K., Ahmad, M. S., Hooi, T. C., Shanmugam, M., Gunasekaran, S. S., Cob, Z. C. & Ranasamy, A. (2013). Analyzing scholars records to identify patterns of scholars’ performance. International Conference on Research and Innovation in Information Systems (ICRIIS): pp. 544–547.
Khan, A. R., Ahmed, A. & Ahmed, S. (2014, March). Collaborative web based cloud services for E-learning and educational ERP. Proceeding of 2014 RAECS UIET Punjab University Chandigarh, pp. 1–4. IEEE.
Ktona, A ., Xhaja, D. & Ninka, I. (2014). Extracting relationships between scholars’ academic performance and their area of interest using data mining techniques. 2014 Sixth International Conference on Computational Intelligence, Communication Systems and Networks, pp. 6–11.
Mayilvaganan, M. & Kalpanadevi, D. (2014). Comparising of classification techniques for predicting the performance of scholar academic environment. 2014 International Conference on Communication and Network Technologies (ICCNT): pp. 113–118.
Pal, M. (2008). Multiclass approaches for SVM based land cover classification CoRR: pp. 1–16.
Wang, J. Z. Lu. W. Wu & Y. Li. 2012. The application of data mining technology based on teaching information. The 7th International Conference on Computer Science and Education; pp. 652–657.
References not cited
Bengio, Y., Courville, A., & Vincent, P. (2013). “Representation Learning: A Review and New Perspectives”. IEEE Trans. PAMI, special issue Learning Deep Architectures.
Bengio, Y. & LeCun, Y. (2007). Scaling learning algorithms towards AI. Large-scale kernel machines, 34(5), 1-41.
Ciresan, D., & Meier, U. (2015, July). “Multi-column deep neural networks for offline handwritten Chinese character classification”. In 2015 International Joint Conference on Neural Networks (IJCNN) (pp. 1-6). IEEE.
Fayyad, U., Piatetsky-shapiro, G. & Smyth, P. (2007). From data mining to knowledge discovery in databases (1996). AI Magazine. Vol 17(3).
Han, J., Pei, J. & Kamber, M. (2011). Data Mining: Concepts and Techniques . Elsevier.
Hu, J., Niu, H., Carrasco, J., Lennox, B. & Arvin, F. (2020). Voronoi-Based Multi-Robot Autonomous Exploration in Unknown Environments via Deep Reinforcement Learning. IEEE Transactions on Vehicular Technology. 69 (12): 14413–14423. doi:10.1109/TVT.2020.3034800.
Krizhevsky, A., Sutskever, I., & Hinton, G. E. (2012). Imagenet classification with deep convolutional neural networks. Advances in neural information processing systems, 25, 1097–1105.
Marblestone, A. H., Wayne, G., & Kording, K. P. (2016). Toward an Integration of Deep Learning and Neuroscience. Frontiers in Computational Neuroscience. 10, 94.
Nordbotten, S. (2006). Data mining with Neural Networks. Bergen, Norway.
Ogor, E. N. (2007). Student academic performance monitoring and evaluation using data mining techniques. In Electronics, robotics and automotive mechanics conference (CERMA 2007) (pp. 354–359). IEEE.
Schmidhuber, J. (2015). Deep Learning in Neural Networks: An Overview. Neural Networks. 61: 85–117.
Trevor, H., Robert, T., & Jerome, F. (2009). Hastie T, Friedman J, Tibshirani R. The elements of statistical learning. Vol. 2.
Witten, I. H. & Frank, E. (2002). Data mining: practical machine learning tools and techniques with Java implementations. Acm Sigmod Record, 31(1), 76–77.

Altaf Hussain received his B.S and M.S degrees in Computer Science from University of Peshawar, Pakistan (2013) and The University of Agriculture Peshawar, Pakistan (2017) respectively. He worked at The University of Agriculture as a Scholar Research Scholar from 2017-2019. During his MS Degree he has completed his research in Computer Networks especially in Routing Protocols in Drone Networks. His recent approach is PhD in Computer Science & Technology. He has served as a Lecturer in Computer Science Department in Govt Degree College Lal Qilla Dir L, KPK Pakistan from 2020-2021. He has published many research papers including survey/review and conference papers. He was Research Scholar in (Career Dynamics Research Academy) Peshawar, Pakistan for one and a half year. Currently, he is working as a Research Assistant with the Department of Accounting & Information Systems, College of Business and Economics, Qatar University, Doha, Qatar. His research interest includes Deep Learning, Wireless Networks, Sensor Networks, Radio Propagation Models, and Unmanned Aerial Vehicular Ad-hoc Networks (UAVANETs).

Tariq Hussain received the M.S. degree with the Institute of computer sciences and information technology the agriculture university Pesha-war in 2019. and B.S. degree from University of Malakand Pakistan, in 2015, Now he is a Doctorial student at School of Computer Science and Information Engineering, Zhejiang Gongshang University Hang-zhou China. His research interests are Big Data, Internet of Thangs and Cloud Computing. Data analytics and AI.

Ijaz Ullah is working as a visiting Lecturer with the Department of Computer Science, University of Swabi, Swabi Pakistan. He has completed his Bachelor degree in Computer Science from University of Peshawar, Pakistan and Master Degree from EIT Digital Mster School. EIT Digital Master School provides dual degrees. So, he got Master in Cloud Computing from University of Rennese 1 France and ICT Innovation degree from Technical University of Berlin Germany. His research interest includes Cloud Computing and Networks.