
Regular Issue, Vol. 10 N. 3 (2021), 281-291
eISSN: 2255-2863
DOI: https://doi.org/10.14201/ADCAIJ2021103281291
|
ADCAIJ: Advances in Distributed Computing and Artificial Intelligence Journal
Regular Issue, Vol. 10 N. 3 (2021), 281-291 eISSN: 2255-2863 DOI: https://doi.org/10.14201/ADCAIJ2021103281291 |
Crime Detection Using Sentiment Analysis
Ruba Khan, Shadab Siddiqui, Abhishek Rastogi, Zulfikar Ali Ansari
BBDITM Lucknow, India
rubakhan0606@gmail.com, cseshadabsiddiqui@bbdnitm.ac.in, abhirastogi456@gmail.com, zulfi78692@bbdnitm.ac.in
ABSTRACT
Women and girls have been subjected to a great deal of violence and harassment in public locations around the cities of India, ranging from stalking to abuse harassment and assault. This research paper examines the role of social media in improving women’s safety in Indian cities, with a focus on the use of social media websites and apps such as Twitter, Facebook, and Instagram. This research also looks at how ordinary Indians can develop a sense of responsibility in Indian society so that we can focus on the protection of women in their surroundings. Tweets on the safety of women in Indian cities, which often include images and text as well as written phrases and quotations, can be used to send a message to the Indian youth culture and encourage them to take harsh action and punish those who harass women. Twitter and other Twitter handles that feature hash tag messages are extensively used throughout the world as a channel for women to share their feelings about how they feel when going to work or travelling by public transportation and what is their mental condition when they are surrounded by unknown males, and do they feel safe or not?
KEYWORD
Misuse attack, Twitter, awareness, Indian culture, hash label messages
1. Introduction
Individuals frequently share their unreserved opinions about Indian culture and legislation on the internet, arguing that Indian cities are safe for women (Kolchyna et al., 2015).Individuals can openly express their point of view and women can share their experiences where they have faced
abuse provocation or where we would have retaliated against the maltreatment badgering that was placed on them via online media platforms (Medhat et al., 2014).The tweets on women’s health and reports of mistreatment arouse more information from other women on a similar web-based media site or application, such as Twitter (Kabir et al., 2019).
Different ladies post these comments and tweets, which inspires another 5 men or 10 women to speak out against those who have made Indian urban communities (Ahmad et al., 2016) a dangerous place for women. In recent years, a large number of people have been drawn to online media platforms such as Facebook (Choudhury et al., 2007). It is common practice to use information extraction, information inspection, and information comprehension approaches to extract data from the information available on interpersonal interactions (MacDonald et al. 2006). The use of conduct inquiry based on informal communities can improve the accuracy of the Twitter examination and forecast (O’Hare et al., 2009).
Ladies have the option of visiting the city, which means they can go whenever they like, whether to an Educational Institute or elsewhere. Females, on the other hand, consider that they are in danger in regions such as shopping malls and shopping malls on their way to work because of a few suspicious stares, body disgracing, and disturbing these ladies (Pang and Lee, 2004). There have been instances where young girls’ provocation was completed by their neighbours while they were en route to class, or when there was a lack of security that created a sense of dread in the characters of small young women who (Diakopoulos and Shamma, 2010) endured it throughout their lives because of that one time in their lives when they had to do something unacceptable or were abused by a neighbour or some other unknown individual (Bollen et al., 2011). Most secure metropolitan communities handle women’s health from the perspective of women’s rights to affect the city, unafraid of roughness or abuse.
Rather than imposing limits on women, as is often the case, society should examine the need for female security and realize that women and young women, like men, have a right to be protected in their surroundings.
2. Related Work
• (Bollen et al., 2011) investigate how public mood patterns are reflected in Twitter messages based on sentiment analysis. They examine the interaction between a) macro socio-cultural events, such as the outcome of a political election, and b) the public’s mood state as measured by a well-established six-dimensional psychometric instrument, using a huge corpus of public Twitter messages.
• (Siddiqui et al., 2020) has used the concept of petrinets for modeling which can be used to model the architecture of research work done on the sentiment analysis.
• For sentiment categorization purposes, (Fersini et al., 2014) proposed a novel ensemble approach. The results of the experiments reveal that the proposed approach is extremely effective and efficient. However, as the number of classifiers in the ensemble grows, so does the size of the dataset, which leads to more complex issues.
3. Proposed Work
• The goal of this work is to determine the crime rate using sentiment analysis offered by Twitter messages, as well as to classify which states have the highest number of crimes.
• This work will be valuable since it will aid in the reduction of crime rates through providing city-level crime data.
• There are instances when the harassment of girls was done by their neighbours while they were on the way to school or there was a lack of safety (Wilson et al., 2005) that created a sense of fear in the minds of small girls who throughout their lifetime suffer due to that one instance that happened in their lives where they were forced to do something unacceptable or was violently harassed by one of their own neighbor or any other unknown person.
• The main objective of the work is to basically focus on the role of social media in promoting the safety of women in Indian cities with special reference to the role of social media websites and applications including Twitter.
• This work also focuses on how a sense of responsibility on part of Indian society can be developed in the common Indian people so that we should focus on the safety of women surrounding them.
3.1. Methodology
A. Twitter Analysis
On social media platforms like Facebook and Twitter, people actively debate and express their viewpoints. People’s ideas and sentiments about numerous events can be discovered using social media. There are multiple opinion-based data collection and analytics platforms that try to extract people’s thoughts on various issues.
B. Implementation of Sentimental Analysis of Tweets
Report on the tweets retrieved using the Twitter API, which is given by Twitter. Because of the Twitter API, there are a variety of tools for emotive analysis of data on social media. This work made use of a number of readily available libraries.
C. Graph
A depressed interaction graph G is generated via some social graph model, minimizing the distance between the real and depressed interaction graphs. The input (actual) social media data is used to generate an interaction graph G. An interaction graph represents how social network actors interact with each other. In social media, entities and their interactions are recognized, and an interaction graph is constructed using a vertex set V for entities, an edge set E for interactions, and an attribute set A for both vertex (entity) and edge (interaction) attributes.
D. Final Report
If the number of neutral tweets is unusually large, it indicates that people are less interested in the subject and are unwilling to take sides. It’s also worth noting that the outcomes of the experiment may vary depending on the data, as people’s opinions can shift depending on the conditions. For example, rape news becomes the year’s most trending topic in 2020. For some queries, the neutral tweets are more than 66% which clearly shows the limitation of the views. By above analysis that we have done, it can be clearly stated that Chennai is the safest city whereas Delhi is the unsafe city.
4. Algorithm
Support Vector Machine
Support Vector Machine (SVM) is an administered AI calculation which can be utilized for both grouping and relapse difficulties. Nonetheless, it is generally utilized in order issues. In this calculation, we plot every information as a point in n-dimensional space (where n is number of highlights you have) with the worth of each element being the worth of a specific arrange. At that point, we perform grouping by tracking down the hyper- plane that separate the two classes quite well (take a gender at the underneath preview). Support Vectors are essentially the co-ordinates of individual perception. Support Vector Machine is a boondocks which best isolates the two classes (hyper-plane/line). All the more officially, a help vector machine builds a hyper plane or set of hyper planes in a high-or endless dimensional space, which can be utilized for grouping, relapse, or different errands like anomalies location. Instinctively, a decent partition is accomplished by the hyper plane that has the biggest distance to the closest preparing information point of any class (alleged practical edge), since overall the bigger the edge the lower the speculation blunders of the classifier. Though the first issue might be expressed in a limited dimensional space, it frequently happens that the sets to separate are not directly distinct around there. Consequently, it was suggested that the first limited dimensional space be planned into a lot higher-dimensional space, apparently making the detachment simpler around there.
5. Architecture
The structure of our work is shown in Figure 1. The user signs in via the home page and enters the relevant information, after which he uploads the data or tweets, and then implements sentimental analysis of comments stored in the database in the form of positive and negative text analysis, based on which a modified graph is formed.
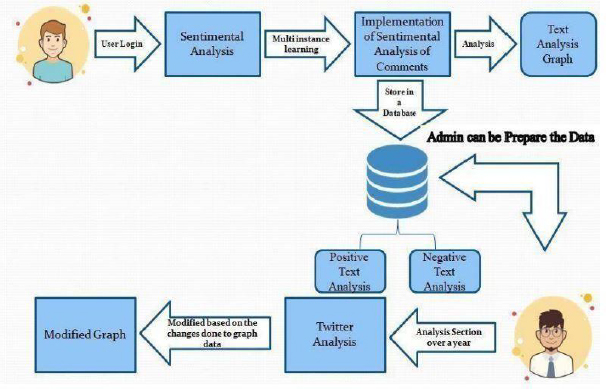
Figure 1: Architecture Diagram
6. Results
We run the program at multiple times, and depending on the number of tweets we receive, we may get different results in each case. We ran the program several times, and these are the averages of the results. If the number of unbiased tweets is high, it means that people are less interested in the topic and can’t think of a positive or negative aspect to it. It’s also important to note that, depending on the test results, we may hear a variety of outcomes, as people’s perspectives might shift depending on the circumstances, such as assault news, which becomes the most trending news in 2020. For certain inquiries, the nonpartisan tweets are over 65% which unmistakably shows the restriction of the perspectives. By above examination that we have done, it tends to be plainly expressed that Lucknow is the most secure city though Delhi is the hazardous city as shown in Table 1.
Table 1 depicts statistics from positive and negative analysis in a tabular format, indicating that Lucknow is the safest city while Delhi is the most dangerous.
Figure 2 depicts the user’s ability to upload photographs and tweets for additional examination.
Figure 3 depicts the comments left by users from various cities.
Figures 4 and 5 demonstrate a positive analysis of data from several cities.
Figure 6 depicts a graphical representation of negative evaluations of various cities based on user comments.
In the form of a bar graph, figure 7 depicts the overall analysis of data as positive, negative, and neutral.
In the form of a doughnut chart, Figure 8 depicts the overall analysis of data as positive, negative, and neutral.
Table 1. Analysis in Tabular form
S. No. |
Name of Cities |
Positive Analysis (%) |
Negative Analysis (%) |
1 |
Lucknow |
9 |
1 |
2 |
Delhi |
14 |
20 |
3 |
Kolkata |
9 |
11 |
4 |
Pune |
12 |
8 |
5 |
Mumbai |
18 |
2 |
6 |
Goa |
9 |
11 |
7 |
Chennai |
13 |
9 |
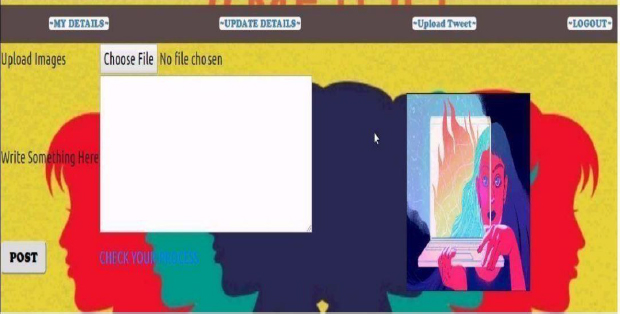
Figure 2: Uploading Tweets
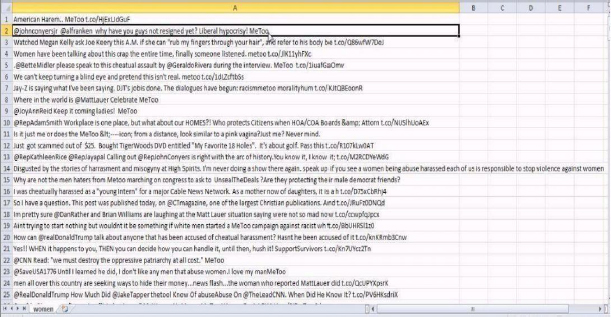
Figure 3: Dataset
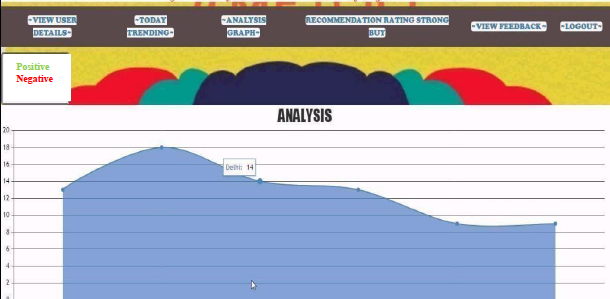
Figure 4: Analysis graph of positive tweets
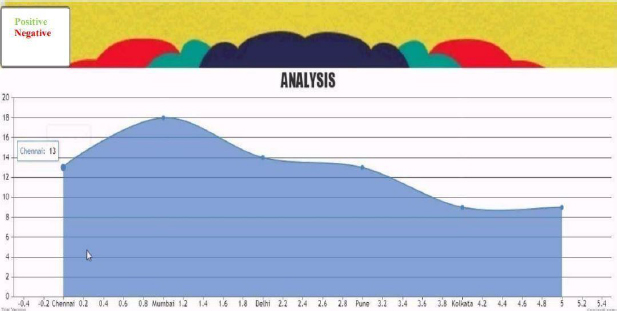
Figure 5: Analysis graph of positive tweets
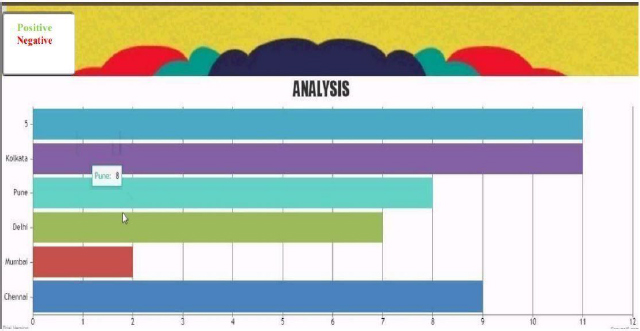
Figure 6: City wise analysis graph negative tweets
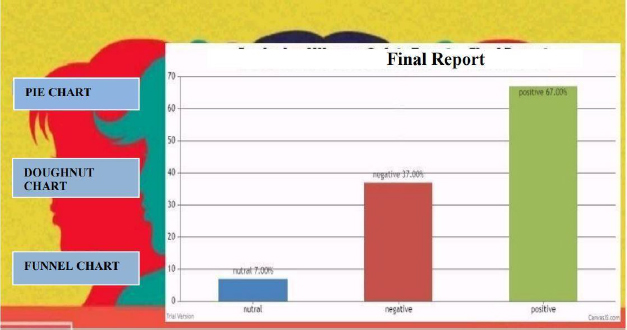
Figure 7: Analysis of women safety tweets
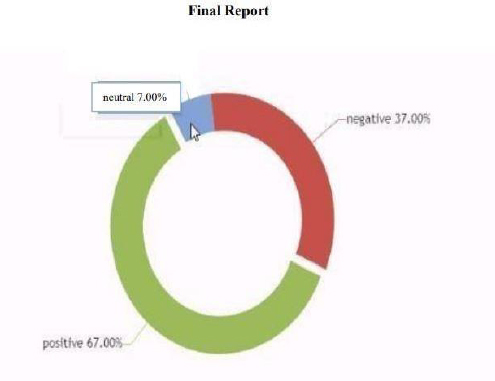
Figure 8: Pie chart analysis of women safety tweets
7. Conclusion and Future Scope
In this research article, we looked into various AI evaluations that can help us sort through and deconstruct the massive amount of Twitter data we’ve collected, which includes a big number of tweets and instant messages published every day. These AI calculations, such as the SPC calculation and direct logarithmic Factor Model techniques, are extremely persuasive and useful when it comes to reviewing large amounts of data. They also help to organize the data into relevant groups. Another sort of AI computation that is widely used to extract important data from Twitter and learn about the issue with women’s security in Indian cities is backing vector machine.
7.1. Future Scope
This effort assists us in detecting crime rates, which may be valuable to us because we can send the data to state-level analysts to help them reduce crime rates in their respective cities. This work is good for crime detection, and as a result, it may be used to reduce crime in a variety of cities. This work can also be enabled into future applications.
8. References
Agarwal, S., Godbole, S., Punjani, D., & Roy, S. (2007, October). How much noise is too much: A study in automatic text classification. In Seventh IEEE International Conference on Data Mining (ICDM 2007) (pp. 3-12). IEEE.
Ahmad, K., Han, J., Hutson, E., Kearney, C., & Liu, S. (2016). Media-expressed negative tone and firm-level stock returns. Journal of Corporate Finance, 37, 152-172.
Baid, P., Gupta, A., & Chaplot, N. (2017). Sentiment analysis of movie reviews using machine learning techniques. International Journal of Computer Applications, 179(7), 45-49.
Bollen, J., Mao, H., & Pepe, A. (2011, July). Modeling public mood and emotion: Twitter sentiment and socio-economic phenomena. In Proceedings of the international AAAI conference on web and social media (Vol. 5, No. 1).
Choudhury, M., Saraf, R., Jain, V., Mukherjee, A., Sarkar, S., & Basu, A. (2007). Investigation and modeling of the structure of texting language. International Journal of Document Analysis and Recognition (IJDAR), 10(3), 157-174.
Diakopoulos, N. A., & Shamma, D. A. (2010, April). Characterizing debate performance via aggregated twitter sentiment. In Proceedings of the SIGCHI conference on human factors in computing systems (pp. 1195-1198).
Fersini, E., Messina, E., & Pozzi, F. A. (2014). Sentiment analysis: Bayesian ensemble learning. Decision support systems, 68, 26-38.
Gamon, M. (2004). Sentiment classification on customer feedback data: noisy data, large feature vectors, and the role of linguistic analysis. In COLING 2004: Proceedings of the 20th International Conference on Computational Linguistics (pp. 841-847).
Kabir, M., Kabir, M. M. J., Xu, S., & Badhon, B. (2019). An empirical research on sentiment analysis using machine learning approaches. International Journal of Computers and Applications, 1-9.
Kolchyna, O., Souza, T. T., Treleaven, P., & Aste, T. (2015). Twitter sentiment analysis: Lexicon method, machine learning method and their combination. arXiv preprint arXiv:1507.00955.
Matsumoto, S., Takamura, H., & Okumura, M. (2005, May). Sentiment classification using word sub-sequences and dependency sub-trees. In Pacific-Asia conference on knowledge discovery and data mining (pp. 301-311). Springer, Berlin, Heidelberg.
Medhat, W., Hassan, A., & Korashy, H. (2014). Sentiment analysis algorithms and applications: A survey. Ain Shams engineering journal, 5(4), 1093-1113.
O’Hare, N., Davy, M., Bermingham, A., Ferguson, P., Sheridan, P., Gurrin, C., & Smeaton, A.F. (2009, November). Topic-dependent sentiment analysis of financial blogs. In Proceedings of the 1st international CIKM workshop on Topic-sentiment analysis for mass opinion (pp. 9-16).
Pang, B., & Lee, L. (2004). A sentimental education: Sentiment analysis using subjectivity summarization based on minimum cuts. arXiv preprint cs/0409058.
Pang, B., & Lee, L. (2009). Opinion mining and sentiment analysis. Comput. Linguist, 35(2), 311-312.
Renault, T. (2020). Sentiment analysis and machine learning in finance: a comparison of methods and models on one million messages. Digital Finance, 2(1), 1-13.
Sarlan, A., Nadam, C., & Basri, S. (2014, November). Twitter sentiment analysis. In Proceedings of the 6th International conference on Information Technology and Multimedia (pp. 212-216). IEEE.
Siddiqui, S., Darbari, M., & Yagyasen, D. (2020). Modelling and Simulation of Queuing Models through the concept of Petri Nets. ADCAIJ: Advances in Distributed Computing and Artificial Intelligence Journal, 9(3), 17-28.
Wang, S. I., & Manning, C. D. (2012, July). Baselines and bigrams: Simple, good sentiment and topic classification. In Proceedings of the 50th Annual Meeting of the Association for Computational Linguistics (Volume 2: Short Papers) (pp. 90-94).
Whitehead, M., & Yaeger, L. (2010). Sentiment mining using ensemble classification models. In Innovations and advances in computer sciences and engineering (pp. 509-514). Springer, Dordrecht.
Wilson, T., Wiebe, J., & Hoffmann, P. (2005, October). Recognizing contextual polarity in phrase-level sentiment analysis. In Proceedings of human language technology conference and conference on empirical methods in natural language processing (pp. 347-354).